Pe,g,.o.
htt. J. Multiphase Flow Vol. 21, No. 4, pp. 667-691, 1995 Copyright ~' 1995 Elsevier Science Ltd 0301-9322(95)00003-8 Printed in Great Britain. All rights reserved 0301-9322/95 $9.50 + 0.00
M O D E L L I N G M O I S T U R E D I S T R I B U T I O N A N D I S O T H E R M A L
T R A N S F E R IN A H E T E R O G E N E O U S POROUS M A T E R I A L
P. C. PHILIPPI and H. A. SOUZAt
Mechanical Engineering Department, Federal University of Santa Catarina, Cx P 476, 88040-900 Florian6polis SC, Brazil
(Received 29 November 1993; in revised form 14 Noz'ember 1994)
Abstract--This paper presents a study of moisture retention and isothermal transfer in a cement and lime mortar. The extended range of pore sizes and the intrinsic heterogeneity of the medium do not allow the use of a single-scale percolation network for numerically describing the topology and the physical processes related to fluid retention and transfer. Three different scales are used for the numerical description of the cement and lime mortar studied in this paper. Electron scanning pictures are used for the geometrical modelling of the material in the three different scales. The heterogeneity is associ,~ed with the fissures network, represented in the first scale, where the medium was conceived as a series of cubic blocks separated by straight channels. The second and third scale are used to represent the pores in the cement and lime paste. A 3D simple cubic percolation site network is used in the third scale to model imbibition and drainage and to predict the hydraulic conductivity in terms of the moisture content. In the second scale, pores are represented as embedded bodies in a continuous medium and the hydraulic conductivity is calculated using Maxwell De Vries theory for composite media. At the first scale level, the isothermal mass diffusivity D~ is modelled by studying an invasion process of liquid water into the fissures network, simulating an actual imbibition experiment, from one extremity of a sample column. Finally, the results of the simulation are compared with experimentally obtained values of Do.
Key Words: heterogeneous porous materials, modelling, moisture retention, moisture transfer, percolation
1. I N T R O D U C T I O N
T h e m a t e r i a l s c o m m o n l y used in b u i l d i n g s exhibit a large range of pore diameters. This is the case of b u i l d i n g m a t e r i a l s based o n h y d r a u l i c a g g l o m e r a t i o n such as c e m e n t m o r t a r s , lime m o r t a r s , concrete a n d related materials. T h e m a n u f a c t u r i n g process produces a h e t e r o g e n e o u s material m a d e u p o f s a n d a n d / o r gravel particles a n d a very fine textured paste. Pore diameters m a y range f r o m some tenths o f a n a n g s t r o m to several micra. The h y d r a u l i c properties of these materials are strongly related to their p o r o u s phase, which is the geometrical space where v a p o u r diffusion a n d capillary flow will take place.
M o i s t u r e transfer in h e t e r o g e n e o u s p o r o u s m e d i a has been extensively studied h a v i n g in view the search for effective properties of a n e q u i v a l e n t h o m o g e n e o u s m e d i u m . Effective m e a n theory ( E M T ) dates b a c k to Maxwell in the n i n e t e e n t h century. K i r k p a t r i c k (1973), p r o p o s e d a general f o r m a l i s m for the theory a n d m o r e recent studies related to E M T m a y be f o u n d in K o p l i k (1982), K i n g (1989), D a v i d e t a l . (1990) a n d H a r r i s (1990, 1993).
T h e p u r p o s e o f the present w o r k is to present a geometrical model for the p o r o u s structure o f a c e m e n t a n d lime m o r t a r , c o m m o n l y used in b u i l d i n g s ( F e r n a n d e s & Philippi 1989), a n d to investigate the influence o f this m o d e l o n the s i m u l a t i o n of m o i s t u r e r e t e n t i o n a n d transfer. A n e t w o r k of fissures a r o u n d a n d between the s a n d grains makes this material a m e d i u m with d o u b l e - p o r o s i t y ( A u r i a u l t & B o u t i n 1992), in the sense t h a t there are two characteristic lengths lp a n d lr, for the pores in the h a r d e n e d paste a n d the fissures, respectively, with lp/l~<< 1. This i n t r o d u c e s a s e p a r a t i o n of scales in the h o m o g e n i z a t i o n process leading to the m a c r o s c o p i c description o f the m e d i u m . It is thus possible to consider the h a r d e n e d paste as a h o m o g e n e o u s m e d i u m with a n effective h y d r a u l i c c o n d u c t i v i t y , w h e n s t u d y i n g m o i s t u r e transfer at the scale o f fissures. This is especially i m p o r t a n t w h e n the fissures m a k e a w e l l - c o n n e c t e d n e t w o r k , since their e q u i v a l e n t h y d r a u l i c c o n d u c t i v i t y Kf is, generally, m u c h
]'Permanent address: Fundamental Techniques Department, Federal University of Ouro Preto, 35400-000 Ouro Preto MG, Brazil.
668 p . c . PHILIPPI and H. A. S O U Z A
greater than the effective hydraulic conductivity K of the surrounding porous matter when the flow is controlled by capillary invasion.
The influence of fissures on the saturated/unsaturated flow in porous media is a very difficult problem. Modelling saturated flow, as affected by a random distribution of cracks, was studied by several authors, including Long & Billaux (1987), Charlaix e t al. (1987), Sayers (1990, 1991) and Harris (1990, 1993). Cinco-Ley & Samaniego (1981), Kissling & Young (1989), Saliba (1990) and Nitao & Buscheck (1991) studied the transient flow in cracks, when affected by the transport process in the porous medium in the immediate vicinity of the crack.
The present study is focused on the combined effect of a transient flow in the fissures, controlled by capillary invasion, and unsaturated flow in the porous medium adjacent to the fissures. A three-scale model is used to represent the heterogeneous, porous structure of a cement and lime mortar and to simulate moisture retention and transfer in this material. The model is based, essentially, on a texture analysis performed on pictures of polished sections of the sample material, taken using an electron scanning microscope.
Saliba (1990) and Daian & Saliba (1991) worked on the same subject emphasizing the role of fissures on moisture transfer. Their results were, however, affected by the lack of information concerning the geometry of fissures and pore size distribution in the hardened paste. In fact, Daian & Saliba's model was conceived based on experimental results on sorption isotherms and mercury intrusion. The volume fractions of pores with small diameters were correctly predicted by using a 3D percolation network whose sites and bond diameters and partial volume fractions were fitted so as to reproduce the experimental values of the sorption isotherms. However, the pore size distribution for large diameters was largely influenced: (i) by the lack of information related to the sorption isotherms for a relative humidity higher than 96% and (ii) by the mercury intrusion results obtained using fractured samples of about 1 mm linear dimension (Saliba 1990), with important effects due to the large surface/volume ratio. In fact, unrealistic pore diameters and fissure widths of nearly 100 lLm were predicted, possibly corresponding to grain removal effects at the surface of the samples.
The same main guidelines used by Daian & Saliba, are followed in this work. However, (i) the present model is a multi-scale model, suitable for representing the intrinsic heterogeneity of the material, and (ii) in the third scale, related to the smaller pore diameters, a site percolation network is used and the sites from different classes are distributed at random. The different classes of sites were chosen following an iso-number distribution from the pore size distribution obtained from the adsorption isotherms and electron scanning pictures. Contrary to Daian & Saliba, no attempt was made to introduce a bond between each of two contiguous sites, in order to reconstitute the desorption isotherms. Constrictions are thus the result of random spatial distribution of sites with different diameters. This assumption is very important and, as will be shown, will largely affect the moisture distribution and transfer at this scale. Another improvement with respect to Daian & Saliba's work concerns the model used for the fissures, based on pictures of carefully polished sections of the sample material, obtained from electron scanning microscopy.
2. M I C R O S T R U C T U R E
Several magnification pictures from carefully polished sections of the sample material were taken using an electron scanning microscope, operating at emissive mode. Details of the procedures to polish the surfaces and to obtain the pictures may be found in Philippi e t al. (1994). The digitalization process was done using a HP IIC scanner, with 256 grey levels. Image analysis filtering operations were performed to identify the different phases and to present these phases with different grey levels,
MOISTURE DISTRIBUTION AND ISOTHERMAL TRANSFER 669
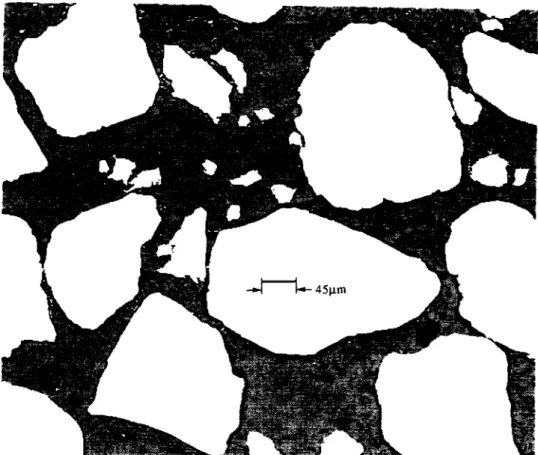
45gin
Fig. 1. Picture of a polished section of the sample material taken using an electron scanning microscope with 200 × magnification after digitalization and image analysis filtering. Each pixel corresponds to 1.25 /~m. Black, white and grey cells represent, respectively, pores, solid matter and porous matter with pore
diameters smaller than 1.25/~m (Philippi et al. 1994).
X-ray diffraction, have found a transition zone between the cement paste and the aggregates, with a smaller mechanical resistance. Fissures around the sand grains were always found, even at fractured surfaces from samples conserved at ambient temperatures and dried at small temperatures (75°C). Saliba (1990) has used networks o f fissures to simulate moisture transfer in cement mortars, finding a better agreement with experimental results. In our own experiments, using mercury intrusion, a critical injection pressure o f ,~ 100 psi was found for the cement and lime m o r t a r corresponding to a throat diameter o f near 3 #m, which is the mean width o f the fissures.
The products o f cement and lime hydration a p p e a r in detail as porous islands using magnifications higher than 3200 × (Philippi e t a l . 1994). A binary representation of a 3200 × magnification picture showing the inner structure o f the hardened paste is shown in figure 2. In this case the pixel dimension is 1250 A. Pores with diameters greater than 1250 A are visible in this figure as black cavities.
Unfortunately, it was not possible to quantitatively describe the size distribution o f small capillary and gel pores from the pictures, as the necessary resolution was not reached even with the highest magnification (which corresponds to 12,500 × magnification). Adsorption isotherms were used to give quantitative information a b o u t the size distribution o f the smaller pores present in the cement and lime paste (Philippi e t a l . 1994).
670 P . c . PHILIPPI and H. A. SOUZA
, . j , - - - - .
L I D
Fig. 2. Binary image of a 3200 × magnification picture taken using an electron scanning microscope showing the porous structure of the cement and lime paste (Philippi et al. 1994).
3. M O D E L
Heterogeneity at the hardened paste level may be described by a scale length lp which can be considered as the maximum diameter observed in the hardened paste (figure 2): lp ~ 12,500 A. At the fissures level the scale length/fcorresponds, nearly, to the mean length of the fissures, in the present case lr ~ 100 pm, from figure 1: If is the minimum length beneath which the medium is heterogeneous from the point of view of geometrical distribution of fissures. In the present work,/~, and/p were
0.36
0.3
0.25
A ¢'~ 0.2 V "0
e'~ 0.15
0.1
0.05
0 i I
100 1001300 IOE)(~
S
/ / //
H
1000 10300
D (AngstrOm)
M O I S T U R E D I S T R I B U T I O N A N D I S O T H E R M A L T R A N S F E R 671 0.06
a A
"o 0.05
~
0.04 o0. '~ 0.~
r-- 0
o ~
¢'~ 0 . ~ m U.
E aN 0
o I I I I I I ~ - - I-°"-~ - ~ - 0
1 2 3 4 5 6 7 8 9 10
D(micnm)
Fig. 4. Pore size distributions in the fissures network obtained using the aperture method from image analysis on figure 1.
calculated from figures 1 and 2, respectively, by measuring the covariance associated to the probability of finding two arbitrary points in the porous phase, when they are separated by a distance u: they correspond to the length u above which the covariance becomes, e~p, where ~ap is the apparent porosity calculated at each picture. The ratio r = lp/k = 0.0125 was considered to be small enough to introduce a separation of scales in the homogenization process, leading to the macroscopic description of the medium (Auriault & Boutin 1992, consider r < 0.1 as small enough to enable scales separation).
In the present case, fissures make a well connected network, with an equivalent hydraulic conductivity Kf much greater than the effective hydraulic conductivity K of the surrounding porous matter, when the flow is controlled by capillary invasion. As wilt be seen in section 6.3, randomly distributing the pores found in the fissures in the medium will significantly underestimate the moisture transfer coefficients (see also Saliba 1990). Identifying the fissures as individual objects with given values of aperture, length and orientation is the current tendency followed by several authors. Fractures were considered in the papers of Long & Billaux (1987), Charlaix et al. (1987), Sayers (1990, 1991) and Harris (1990, 1993), as a planar distribution of individual finite length objects, with particular attention being paid to the problem of calculating the overall permeability from the individual hydraulic resistances, using network or effective medium theory (EMT).
For media drawn by a network of fissures, it is important to know the minimum length in the direction of the pressure gradient, below which the flow cannot be described by supposing the medium to be homogeneous. In fact, although the homogenization length, from the geometrical point of view, corresponds to k, this length can be much larger for describing the flow inhomogeneities. This is especially important for porous media with a well connected fissure network in the immediate vicinity of the external surface in contact with a wetting fluid. The study of this flow entry region is one of the main purposes of this paper (see section 6), particularly, in imbibition transient processes, when the external surface is in contact with a wetting fluid at negative capillary pressures: this is the case in, presently very common, experimental set-ups for measuring the mass diffusivity Do from imbibition transient processes, using straight section columns of sample material (see, for example, Hillel 1980). In this case, the flow in the fissures can be significantly modified by the unsaturated flow in the porous matter in contact with the fissures.
6 7 2 P. C. PHILIPPI and H. A. SOUZA
grains of sand L
b q
line of s ~ r ~
~ ~ s~-'~'g~m~r~
F i r s t S c a l e
embedded pores with D > 10000
porous matter (pores with
cement and lime
o 0 o
o © o l
S e c o n d S c a l e
( M a x w e l l : D e Vries)
solid maner
o O o e o
T h i r d S c a l e
pores with
pores with D < 1000
1000~ < D < 10000~
k.r---'.o----x.)--~ 3 D simple cubic sites n e t w o r k
F i g . 5. T h r e e scale m o d e l r e p r e s e n t i n g the p o r o u s s t r u c t u r e o f the s a m p l e m a t e r i a l .
network. The width L of the blocks was taken as being equal to the scale length lr ~ 100 #m, as a convenient measuring unit to represent the sand and the hardened paste phases at this scale. The fractions of sand and porous blocks are taken so as to preserve the respective fractions observed at the pictures. In the same manner, the thickness 6 = 2.75 pm was chosen to conserve the relative fraction of fissures observed in the pictures.
MOISTURE DISTRIBUTION AND ISOTHERMAL TRANSFER 673
dimensions, complicating the simulations from the point of view of computer storage capacity. For this reason, the range of pore diameters was, somewhat arbitrarily, fractionated in three regions: 10,000 < d < 125,000 A, 1000 < d < 10,000 A and 200 < d < 1000 A. This choice made possible the use of finite percolation networks of sizes 40 x 40 x 40 or smaller (sections 4 and 5), fairly satisfying the condition of statistical homogeneity.
In the second scale (figure 5), the hardened paste was represented as a set of spherical embedded cavities, associated with pores with diameters 10,000 < d < 125,000 A, randomly distributed inside a porous medium composed of solid matter, and pores with diameters smaller than 10,000 ,~. These cavities correspond, roughly, to the pores visible at the 200 x magnification picture (shown in figure 2). They were supposed to be isolated as their number-fraction, calculated from figure 3, was very small. Fissures present inside the hardened paste could communicate these cavities, but no effort was made to take this effect into account. Maxwell-De Vries theory of transfer through composite media with a homogeneously dispersed phase of embedded bodies was used, at this scale, to simulate the transfer of moisture.
In the third scale (figure 5), the embedding phase was represented as a simple cubic site percolation network associated with pores with diameters 1000 ~< d ~< 10,000 A. Pores with diameters smaller than 1000 A were considered as not contributing to the rate of transfer of moisture. In fact, gel pores are very important since they yield the hygroscopic properties of a porous material, i.e. its water vapour sorption characteristics. However, apparently, these pores are not homogeneously dispersed in the hardened paste, but concentrated, forming isolated clusters of connected gel pores, surrounded by larger pores, as can be observed in the higher magnification pictures of the sample material microstructure (Philippi e t al. 1994). Their contribution to moisture transfer will thus be considered to be negligible. When filled with liquid water these clusters will contribute to moisture transfer at small moisture contents and the above assumption must be regarded with care when used for simulating moisture transfer in this range.
The simulation procedure starts at the third scale, corresponding to the smallest scale considered. A 3D network of sites is used for obtaining the spatial distribution of liquid water (section 4) and calculating the hydraulic conductivity in imbibition and drainage processes (section 5). As mentioned earlier, Daian & Saliba (1991) and Saliba (1990) used a sites and bonds percolation network whose diameters were chosen so as to reproduce the static behaviour of the sample material. In the present case, the network was constructed using only the information available from the adsorption isotherms and electron scanning pictures and the cavities were associated with sites distributed in a simple cubic network. Image analysis procedures could be used to identify constrictions in the images, giving information about the distributions to be used in a sites and bonds network, but no attempt was made to improve such a network in the present work. Constrictions were thus supposed to be the result of a random spatial distribution of sites with different diameters.
The presence of embedded cavities, in the second scale, does not contribute to modify the distribution of moisture in the embedding phase since they are isolated. In imbibition, these cavities will be filled with water according with their diameters and after the whole embedding phase be filled with liquid water. In drainage, they will only be drained at the critical potential related to the embedding phase found at the previous step. Their only contribution will be to modify the hydraulic conductivity as bridges to vapour transfer when empty and to liquid transfer when filled with water. As mentioned above, this contribution was calculated by using Maxwell-De Vries theory (section 5.4).
Finally, at the scale of fissures (section 6) the transfer of moisture is simulated as a combined process of Poiseuille flow in the fissures and moisture transfer in the 100 m porous blocks, which behave as blocks of continuum matter with an effective hydraulic conductivity, determined in the previous two steps in terms of the suction potential.
4. MOISTURE D I S T R I B U T I O N IN THE H A R D E N E D PASTE: INVASION PROCESSES 1N P E R C O L A T I O N NETWORKS
674 P . c . PHILIPPI and H. A. SOUZA
Table 1. Cumulative number ~actionfor the 30 classes of sites used in the percolation network
Cumulative Cumulative
Class Diameter (/k) number fraction Class Diameter (A) number fraction
1 1017 0.0475 16 1621 0.76
2 1034 0.095 17 1746 0.8075
3 1053 0.1425 18 1921 0.855
4 1074 0,19 19 2195 0.9025
5 1096 0,2375 20 2743 0.95
6 1120 0,285 21 2841 0.955
7 1147 0,3325 22 2954 0.96
8 1176 0,38 23 3086 0.965
9 1208 0.4275 24 3246 0.97
10 1244 0.475 25 3445 0.975
11 1285 0.5225 26 3702 0.98
12 1334 0.57 27 4058 0.985
13 1385 0.6175 28 4602 0.99
14 1448 0.665 29 5634 0.995
15 1525 0.7125 30 10000 1
to pore diameters smaller than 3000 A (for class 20, d = 2743 A) c o r r e s p o n d i n g to 95% o f the total n u m b e r o f sites in the percolation network. T o increase the n u m b e r o f points between 2743 and 10,000 A, the last class (class 21) was further partitioned into 10 classes. The first 20 classes, n u m b e r e d f r o m 1 to 20, have a frequency in n u m b e r o f 0.0476 and the last 10 classes (numbered from 21 to 30), a frequency in n u m b e r o f 0.0048.
Table 1 and figure 6 show the cumulative n u m b e r frequency n (d ~ D) as a function o f the pore diameter, obtained from the cumulative volume distribution (figure 3) by using:
f
' dVp/dD.... ~D3/6 dD
n(d _< D) = [l]
;o ~ d
Vp/dD n hrain ~ ~
where Vp is the cumulative volume o f pores with diameters smaller than D (figure 3), Dn,,. = 1000 /k and Dmax = 10,000/k.
M o n t e Carlo results f r o m percolation theory Stauffer, 1985) indicate a threshold c o r r e s p o n d i n g to the o c c u p a t i o n fraction of0.3117, which is related in the present case to a critical diameter o f 1147 (class 7) when the n e t w o r k sites are, step by step, occupied by the wetting phase, and to a critical diameter o f 1448 A (class 14), when the sites are occupied by the non-wetting phase. These preliminary results indicate the chief importance o f small pores in establishing the hydraulic properties o f the cement and lime paste. It is, however, i m p o r t a n t to note that, in the present model o f percolation network, the classes o f sites are r a n d o m l y distributed in the network according to their n u m b e r fraction. The model does not take the spatial correlation o f cavities into a c c o u n t and results must be considered with care due to this i m p o r t a n t limitation.
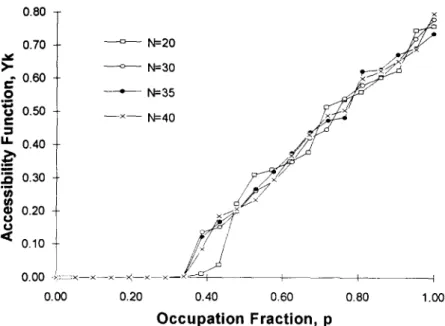
The simple cubic networks were constructed by using a p s e u d o - r a n d o m generator number. Several linear dimensions have been used and different initial values have been tested for the r a n d o m generator. The networks were initially used for simulating classical percolation problems. In this case, a site is considered to be occupied if it belongs to an active class and if it is connected to the surfaces o f the network by a cluster o f occupied sites. Figure 7 shows the influence o f the linear dimension N o f the n e t w o r k over the accessibility function Pk, defined as:
k
Mj~ / = 1
P ~ - - - , [ 2 ]
n
M O I S T U R E DISTRIBUTION AND ISOTHERMAL T R A N S F E R 675
0.9 = ~ ' - = ~ E
0.8
C
0.7
C
0 . 6
,~ 0.5 U.
' - 0.4 e~
E o.3
Z 0.2
0.1
0 I
1000 3000 5000 7000
D
(Angstr6m)b
9000 11000
Fig. 6. N u m b e r frequency for pore diameters 1000 < d < 10,000 A, obtained from figure 3 and by supposing the pores to be spherical cavities.
where Mjk is the a m o u n t o f occupied sites o f class j at the k step and N~ is the total number of sites belonging to class i. A generalization o f the labelling algorithm of Hoshen & K o p e l m a n (1976) was written for 3D simple cubic networks, to find the percolating cluster at each step k. As shown in figure 7 the results for the 403 and 503 networks are almost the same and a total number of 403 sites was found to be convenient for simulation purposes. The influence of the r a n d o m generator was also studied, giving very little dispersion for the 403 and 503 networks (Souza 1993).
Imbibition and drainage were then simulated using a 3D network whose lateral surfaces were considered to be impermeable, the upper surface in contact with water and the lower surface in contact with air (figure 8). In imbibition, the pores are initially empty, the water pressure corresponds
IJMF 2 1 / 4 - - - I
>- f f
O , m
u e-
14.
, m
U)
u
<
0.50
0.5
0.0
0.35
0.30
025
020
0.15
0.10
0.05
0~0-= 0.00
---o--- N=50 / /
N = 4 0
- - x - - N=30
• N = 2 0
0.10 020 0.30 0.0 0.50
Occupation Fraction, p
676 P. C, PHILIPPI and H. A. SOUZA
Wetting Phase
Lateral Surfaces are Imperveous
Non Wetting Phase
PG
/
Fig. 8. Simulation of a static imbibition and/or drainage process on a simple 3D cubic network. The upper surface of the network is in contact with the wetting phase and the lower surface with the non-wetting phase.
Lateral surfaces are supposed to be impermeable.
to 1 atm and the air pressure is considered to be, initially, high enough to drain the pores. The air pressure is then lowered at each step. In drainage the pores are considered as being initially filled with liquid water at atmospheric pressure and the air pressure at the lower surface is increased at each step.
4.1. Simulation of imbibition
Imbibition was simulated in two ways:
(a) In a first model, a pore is considered to be filled with water when: (i) the air pressure satisfies the Laplace equation,
4acos0
pG -- pL -- D ' [3]
where pc, pL are the pressure in the gas and liquid phases, respectively, a is the interfacial tension and 0 is the contact angle and (ii) the site is connected to the water surface by a cluster of filled pores. This means that the imbibition process will be affected by the topology of the network.
(b) In a second model, the pore needs only to satisfy [3], to be filled with water. This corresponds to the assumption that the wetting phase is able to reach non-connected cavities using the pore walls as bridges for liquid transport. In this case, topology will not affect the occupation process. In both cases, air blocking was not considered in the simulations.
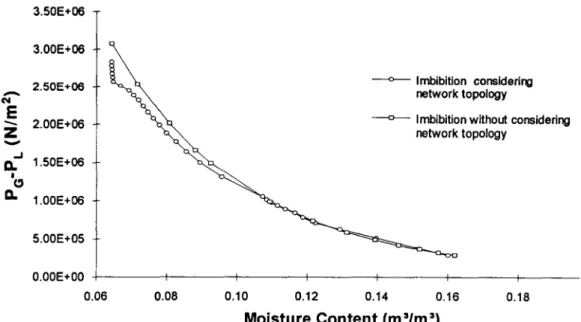
The results are presented in figure 9. Imbibition starts from a moisture content of 0.064 m3/m 3, which corresponds to the volume fraction of pores with diameters smaller than 1000 A (not considered in the simulations). It is seen that, in the present case, there is no meaningful difference between the two invasion models from the point o f view of moisture distribution in the network. In fact, although the second model does not have a threshold and the invasion proceeds as in a network of sites independently connected to the external surfaces of the network presenting a continuous derivative behaviour, the threshold corresponding to the first model starts very early for a pore diameter o f 1147 A related to class 7. As pointed out above, this is attributed to the great number o f fractions of small pores represented in the network, as previously discussed.
4.2. Simulation of drainage
In this case, a given site is considered to be occupied by the non-wetting phase if it simultaneously satisfies the following conditions:
MOISTURE D I S T R I B U T I O N A N D I S O T H E R M A L T R A N S F E R 6 7 7
E
Z
- I
a ,
'o
a ,
3.50E+06
3.00E+06
2.50E+06
2.00E+06
1.50E+06
1.00E+06
5.00E+05
O.OOE+O0
0.06 0.08 0.10 0.12 0.14 0.16
M o i s t u r e C o n t e n t ( m ' l m
=)
Fig. 9. Simulation of imbibition: influence of the topology of the 3D network.
~ Imbibition considering
I I I I I I
0.18
(ii) It is connected to the network surface in contact with air by a cluster of empty sites. (iii) It is connected to the network surface in contact with water by a cluster of filled sites.
Starting with a completely saturated network, at atmospheric pressure the air pressure is increased step by step activating the classes related to the greater pore diameters. At each step, the network is scanned and clusters of active sites are identified. The threshold corresponds to the state where the two opposed surfaces of the network are firstly connected by a cluster of active sites. These sites are emptied from the wetting phase. The simulation proceeds and the sites satisfying conditions (i)-(iii) are emptied at each step.
Isolated clusters of cavities filled with the wetting phase appear in the network in the course of simulation. These clusters cannot be drained as the air pressure is considered to be equally applied at the perimeter of the cluster. They will contribute to an irreducible moisture content, which is very common in drainage experiments.
Simulation of drainage was performed by using 2D square and 3D simple cubic networks. Square networks of 1002 , 2002 , 3002 and 4002 sites were used, but the results are not presented in this paper due to limitations of space, Figure 10 shows the influence of the linear dimension N over the accessibility function Pk for simple cubic networks, in terms of the fraction of sites occupied by the non-wetting phase, p. The results may be compared with figure 7, relating to the classical percolation problem in the same networks. Although the critical occupation fraction is almost the same, nearly corresponding to the 0.3117 occupation fraction of active sites found in percolation literature, in drainage a number fraction of roughly 25% remains filled with the wetting phase at the end of drainage.
Computer processing times have reached 5.11 h with an IBM 3090 computer for simulating the drainage of a 503 sites cubic network and 13.70 h with a Convex C210 computer for simulating the drainage of a 403 sites network.
678 P. C , PHILIPPI and H. A. S O U Z A
0.80
0.70
>- =- 0.60 .9
o 0.50
C
U, 0.40
"~ 0.30
, m
- - - - o - - - N = 2 0
+ N = 3 0
• N=35
- - × - - N = - 4 0
m 0.20 u
'¢C 0.10
0.00 :: : ~ x - - × - - × - - ~ - - × - - × - - -
0.00 0.20 0.40
×
I I I
0.60 0.80 1.00
Occupation Fraction, p
Fig. 10. Simulation of drainage: influence of the linear dimension of the network.
4.3. Influence o f second scale pores on moisture distribution
As mentioned earlier, the consideration of second scale embedded cavities will not modify the static behaviour of the third scale network because they were supposed to be isolated.
Twenty classes of pores were considered to represent the second scale cavities with diameters 10,000 < d < 125,000 A. Class 1 corresponds to the smaller diameters and class 20 to the larger ones. In imbibition, the second scale cavities are only filled after the third scale is completely saturated. They are filled at each pressure step according to their class number, following the stability condition given by the Laplace equation. Air blockage is, again, not considered for simulation purposes.
In drainage, the second scale cavities are only drained at the third scale threshold. These cavities are thus considered to be completely drained at the pressure corresponding to the third scale
3.00E+O6
2.50E+06
, - , 2.00E+06
O,I
E z
,.I
Q.
b
Q.
1.50E+06
1.00E+06
5.00E+05
L
0.00E+00 I I I L t I I I
0.05 0,07 0.09 0.11 0.13 0.15 0.17 0.19 021
Moisture Content (m=/m =)
MOISTURE DISTRIBUTION AND ISOTHERMAL TRANSFER 6 7 9
threshold, which means that each second scale cavity is supposed to be connected with the percolating cluster in the third scale.
5. SIMULATION OF MOISTURE TRANSFER AT THE HARDENED PASTE
Neglecting the effect of the gravity and temperature gradients, transfer of moisture inside a porous structure will be due to the simultaneous action of capillary pressure gradient, promoting liquid water viscous flow and vapour pressure gradient responsible for vapour diffusion. The overall macroscopic transfer properties observed at the macroscopic scale is the result of a complex combination of these two main microscopic mechanisms. Percolation networks provide an important investigation tool to study the effect of these elementary mechanisms of transfer, at the pore scale, and to deduce their influence on the overall macroscopic properties.
Local equilibrium is assumed, i.e. at each elementary volume moisture is supposed to be in equilibrium, which means that:
(i) Capillary pressure and vapour pressure are almost uniform at each elementary volume and cross related by the equilibrium condition
/~ = / & , [4]
where/~v is the chemical potential of vapour and/& is the chemical potential of liquid water. This results in the well known Kelvin equation
Pa - PE = p E R T In h, [5]
M
where pL and M a r e the density and molecular mass of the liquid phase, respectively, R is the universal gas constant, T is the temperature and h is the relative humidity in the gas phase.
(ii) Moisture distribution inside each elementary volume is supposed to be the same in equilibrium at a given value of PG - PL
(or,
alternatively, at a given value of h), for a given invasion process (in the present case: imbibition or drainage, simulated in section 4). The elementary volume is thus supposed to be subjected to a very small pressure (or relative humidity) gradient and moisture distribution is calculated by supposing that it is in equilibrium at the mean value of PC -- PL.5.1. Elementary conductances
Assuming creeping flow, Koplik (1982) developed an expression for the hydraulic conductance associated to the flux of liquid between the centre of a spherical cavity, with diameter D, and an arbitrary opening at its surface, with diameter Do. Following Koplik, this conductance is equivalent to the conductance of a cylinder with diameter Do and length 2Do/rr,
k E - - pLOD4 ~Z
128~ 2Do' [6]
where/~ is the liquid viscosity. In the present case, this means that the resistance to liquid flow between two adjacent cavities in the network, will be imposed by the smaller cavity, which is considered as an opening of diameter Do and behaves like a throat for liquid transfer. The conductance related to liquid flow between the centre of two adjacent sites of diameters D~ and D_~, with D~ > D_~, filled with liquid water, will thus be given by
1 pErrD 4 rt
kE,,-2-- 2 128/~ 2D2" [7]
If the cavity is empty, only vapour diffusion is considered. For cylindrical cavities of length L and diameter D, neglecting the effect of the adsorbed layer of liquid water, the equivalent conductance is given by
2 M 1
6 8 0 P. C, PHILIPPI and H, A. SOUZA
where ~ is the mass diffusivity o f water vapour in air and p~s is the density of vapour at saturation. In fact, in the present case pore diameters m a y be considered as being much greater than the thickness e, o f the adsorbed layer (Souza 1993).
Following the same reasoning as above, the conductance associated to vapour diffusion between the centre o f a spherical site and an arbitrary opening with diameter Do will be written as
kv = pwrt(Do/2)2~ h 2 D o [9]
5.2. Calculation o f the equivalent conductance o f the network
The resistance to fluid transfer between the centre of two neighbouring sites a and b, with d~ >db, is given by
1 1 1
k~b -- ka(db) + kb(db~' [10]
where k, and kb are given by [6] or [9], according to the occupation state of the sites at a given equilibrium condition. The notation k~(dk) means that the conductance k, is a function of the diameter d~.
The centre of the sites may thus be associated with the nodes of a cubic electrical network. Two adjacent nodes are connected by a resistance given by [10]. The lateral surfaces of the network are supposed to be impermeable.
The simulation starts by establishing the state of occupation of each site at a given capillary pressure, by using the methods exposed in section 4. By maintaining the same state of occupation the capillary pressure (or h) is increased at the upper surface of the network by a given amount Ap and the pressure is calculated at each node a by solving the balance equation
~ j a b = O , [ l l ]
b
valid for stationary conditions. The above equation, when applied to each node of the network, gives a set of N3-2N e equations in N 3 2N 2 unknown capillary pressures pi. This system is solved by using a conjugate gradient method (Jacobs 1980).
The ratio between the mass flow m and the capillary pressure difference between the upper and the lower surfaces of the network gives the hydraulic conductance, k, of the network, which can be used to calculate the hydraulic conductivity K associated with the third scale pores,
K = Lg rh _ Lg k, [12]
A Ap A
where K is computed as related to a block of length L and transversal area A, giving the same mass flow rh as the network when submitted to the same capillary pressure difference Ap applied to the network. As a site percolation network was used to represent the porous structure at the third scale, the length L is equal to NDm, where Dm is the mean site diameter and N is the linear dimension of the network. On the other hand, any transversal porous area of the apparent porous block, at the third scale, i.e. Ae,p.3, must be the same as the total projected area of N-' sites of a transversal section of the network. The area A was thus calculated using
7r D~,
A = N- T e,p,~, [131
where the apparent porosity of the third scale pores, e,,p.3, is computed using
e3 [14]
~ap,3 ~ 1 - - ~sand - - £:fiss - - E2
MOISTURE DISTRIBUTION AND ISOTHERMAL TRANSFER 681
1.00E+01
1.00E+O0
1.00E.-01
1.00E-02 m
~' 1.00E-03
1.00E-04
1.00E-05
1.00E-06
0.O6 8
- - - o - - - N=I 5
- - x - - N=20
- - - o - - - N=30
I I I t I I
0.08 0.10 0.12 0.14 0.16 0.18
Moisture Content (m31m 3)
Fig. 12. Results of simulation for the hydraulic conductivity in imbibition: influence of the linear dimension of the network.
5.3. Results
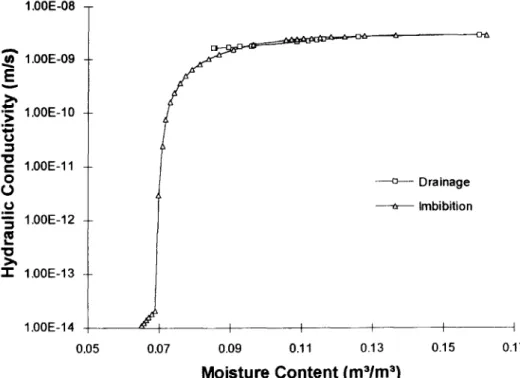
The results for imbibition are presented in figure 12 for three different simple cubic networks ( N = 15, 20 and 30). A linear dimension o f 30 sites was considered to be satisfactory for simulation purposes. A n a l o g o u s results were f o u n d for drainage (figure 13). Figure 14 c o m p a r e s the hydraulic conductivity in imbibition and the drainage process.
In imbibition, figures 12 a n d 14 show a fast increase o f K for water contents just above the critical point related to the percolation threshold, Oci = 0.069 m3/m 3, which corresponds, in this case, to the
1 . 0 0 E - 0 8
A
E
1 . 0 0 E - 0 9N = 1 5
N = 2 0
- - - o - - N = 3 0
1 . 0 0 E - 1 0 J J ~ ] I
0 . 0 6 0 . 0 8 0 . 1 0 0.12 0 . 1 4 0.16 0 . 1 8
Moisture Content (m=/rn 3)
682 P.C. PHILIPPI and H. A. SOUZA
1.00E-08
E
c- o
u
1.00E-09
1.00E- 10
1.00E-11
1.00E-12
1.00E-13
Drainage
Imbibition
1.00E-14 ~ " I I I I I
0.05 0.07 0.09 0.11 0.13 0.15 0.17
Moisture Content (m31rn 3)
Fig. 14. Comparison between the simulated hydraulic conductivity in imbibition and drainage in terms of the water content.
continuity limit of the liquid phase. For higher values of 0 the hydraulic conductivity K increases very slowly. This is related to the high amount, in number, of small pores distributed at random in the network: these pores will dominate the transfer of moisture which, to be transferred, must follow a path in the network percolation cluster composed mainly of sites of small diameters, around 1147 A, related to the critical diameter in imbibition (see section 3). For higher moisture contents, the inclusion of sites of higher diameters to the percolation cluster does not significantly modify the hydraulic resistance which apparently continues to be dominated by the hydraulic resistance of the small sites that are appended to the cluster.
In drainage (figure 14), the hydraulic conductivity has been computed for water contents higher than the irreducible saturation, which corresponds to the water content where the liquid phase becomes discontinuous (0cd = 0.080 m3/m3). It is perhaps important to observe that the water content at which the wetting phase becomes continuous in imbibition, 0c., is not the same content at which the liquid water looses its continuity, 0cd, in drainage. In fact, in drainage 0~d is made up not only by the water contained in sites with d < 1147 A (i.e. 0~,) but also by clusters isolated from the wetting phase in the course of drainage. This was the case for clusters whose perimeter was composed by sites which were drained first.
The results are very close for the hydraulic conductivity, when the process of drainage and imbibition are compared between themselves (figure 14). This result was also obtained by other authors, e.g. Vachaud & Wakil (1970), and means that K will only be dependent on the moisture content for a given temperature: two percolating clusters of pores occupied by the wetting phase will impose the same hydraulic resistance, at the same moisture content, even if their spatial geometrical configurations are very different. In fact, the geometrical configuration of the percolating cluster is not imposed by the moisture content, but by the capillary pressure which gives the relative amount of active sites in the percolation network. As can be seen in figure 11, hysteresis will make the capillary pressures in imbibition and drainage significantly different for the same water content.
MOISTURE DISTRIBUTION AND ISOTHERMAL TRANSFER 683
0.901'00 It
-- ----o--- K/Ko, Present results
08o T
/ -
/ /
0.70
0.60 0.50
0.40 0.30 0 2 0
0.10
0.00 I I I I I I I
0.00 0.10 0.20 0.30 0.40 0.50 0.60 0.70 0.80 0.90 1.00
Occupation Fraction, p
Fig. 15. Hydraulic conductivity as a function o f the n u m b e r occupation fraction of the network. C o m p a r i s o n with Kirkpatrick's results (Kirkpatrick 1973).
comparison was performed taking the results obtained for K in imbibition. Plotting the ratio K/Ko,
where Ko is the hydraulic conductivity at saturation, against p (figure 15) shows that the present results are similar to the ones found by Kirkpatrick (1973), obtained for simple cubic networks 20 x 20 x 20 of sites composed by only two kinds of resistances. This result confirms the network calculations performed in the present work and validates the proposition already stated that the abrupt increasing for K near the threshold in imbibition (figures 12 and 14), is to be attributed to the relative large amount of small diameter pores.
Similarly to Daian & Saliba (1991) another kind of network simulation has been performed separating the contributions of vapour diffusion and capillary liquid flow, considering, in this case, a mass transfer coefficient Dh defined as (Daian & Saliba 1991)
j = -- pv~DhVh. [151
In a first case, the hydraulic resistance to liquid flow was made infinite at each node of the network connected to sites occupied by liquid water. In a second case, the hydraulic resistance associated with vapour diffusion was made infinite. While, in the first case, the flow of moisture is entirely due to vapour diffusion, in the second case, capillary liquid flow will be the only transfer mechanism for moisture. The results (figure 16) show that: (i) vapour diffusion is negligible, except for very low water contents and (ii) the two individual contributions are not additive, i.e. the total mass diffusion coefficient Dh cannot be obtained as a sum of D L and D~ calculated as above. This is the result of phase transitions at the liquid surface and greatly complicates the construction of simplified models to simulate the transfer of moisture at moisture contents where both vapour diffusion and capillary liquid flow are important.
5.4. Influence o f the second scale pores on moisture transfer
As mentioned earlier, at the second scale pores of diameters greater than 10,000 ~ are considered as embedded cavities in a continuous porous matter (figure 5) whose hydraulic properties were obtained in sections 4 and 5.
The hydraulic conductivity K was calculated using (De Vries 1952),
Ar/oKo + ~ ciA~K,
K = " , [161
684 P . c . PHILIPPI and H. A, SOUZA 1.00E-01
1.00E-02 C+V
Vapour Diffusion (V) / ~
1.00E-03
~ Capillary Transfer (C) / /
i n ! /
~; ----o--- Present Simulation
E 1.00E-041.00E-05 e- i n - ~ I
Q
1.00E-O6 I
J
1.00E-07 I I I I ~1 I I I
0.064 0.065 0.066 0.067 0.068 0.069 0.070 0.071 0.072
Moisture Content
(m31m 3)
Fig. 16. Comparison between the simulated transfer coefficient Dh for different processes showing the enhancement of moisture transfer due to phase transition.
where Ko is the hydraulic conductivity related to third scale pores and K, is the hydraulic conductivity related to each class of embedded pores. The terms Ar/o and A~/i represent the proportion in volume of continuous matter and embedded pores of class i, respectively. The coefficients c, are the same as those presented by De Vries (1952).
The results are presented in figure 17. As may be observed, when figure 17 is compared with figure 14, the contribution of second class pores to moisture transfer is very small: the hydraulic conductivity of the hardened paste is not meaningfully affected by the second class capillary pores. This is related to the assumption that supposes them to be isolated and randomly distributed. In fact,
1.00E-08
~.~ 1.00E-09
E
v
1.00E-10 ._
u -I 1D
e- 1.00E-11 O
L) .u_.
1.00E-12
.m
1D
"11" 1.00E-13
i
J
---c--- Drainage ~- Imbibi~on
1.00E-14 I I t I I
0.05 0.10 0.15 020 025 0.30
Moisture Content (m31m 3)
M O I S T U R E D I S T R I B U T I O N A N D I S O T H E R M A L T R A N S F E R
grains of sand
L
685
i il !!i
l iiiii iii! iii !ii!i! i!i!!! il
ii~iii~ili!i:iiii!i!i~iiiiiii!i~il.
~ii iii! ,iii~,ii2iiii~i:ii~i !:ii i~ii i ii!!i!iii~id i~i! i,li~ i!iJ
X i ii!i/i ¸I
i i!iii
Ii!i
il ¸ !i ! i i i i
fsym
. _ j , .... i ~ ¸¸¸ ,
i l ¸ i i~ill!i ~!i!i! ¸¸¸
,. ii ili i .... ii i! i ¸ i l Ill ~i! ! i!i!~ !ii ~!i iii" ~/t~
ii !ii ¸¸¸~i i~"iil ii~i2ii!i/
~k'k blocks of porous matter
Fig. 18. Geometrical model used for studying the liquid water invasion in the fissures network.
the existence o f cracks connecting these embedded pores and spatial correlation in the distribution of second and third scale pores could significantly modify these results.
6. S I M U L A T I O N OF M O I S T U R E T R A N S F E R AT T H E FIRST SCALE: THE ROLE OF FISSURES
Transfer processes within a fractured reservoir have been modelled by Cinco-Ley & Samaniego (1981) by considering a double-diffusive mechanism in fracture and porous block, supposing the flow to be one-dimensional in the block. Kissling & Young (1989) extended Cinco-Ley's work by considering two-dimensional flow in the porous block, assuming the flow equations to be described by constant transfer coefficients. Saliba (1990) considered capillary pressure dependent transfer coefficients to describe the two-dimensional unsaturated flow in the porous blocks surrounding a cracked porous medium, using a constricted channel of constant width to model the cracks. Nitao & Buscheck (1991) studied this problem in the case of vertical fractures considering the effect o f gravity: approximate analytical solutions were developed and compared with a numerical solution o f a set of non-linear integro-differential equations used to model the problem. In the present paper, a model very similar to the one presented by Saliba (1990) is presented. Some main improvements are related to the use of image analysis procedures on polished sections of the sample material which enabled: (i) the precise calculation of the fissures mean width and (ii) the use o f an improved chain model (section 6.1) for calculating the equivalent hydraulic conductivity of the fissures, based on pore diameter distribution in the fissures (figure 4). When compared with the constricted channel model, the chain model appears to give the best results (section 6.3). A detailed description of the mathematical model used is presented in the following.
6.1. Model
686 P, C, PHILIPPI and H. A. SOUZA
0.875/am
I..,, 100/~m ~ l
r ~ b.'-- 1
1.375 ~m
1 ttm
Fig. 19. Numerical grid used to solve the constriction problem. Two-dimensional creeping flow is assumed in solving the Navier-Stokes equation.
Fissures were modelled alternatively:
(a) As straight channels with width 6.
(b) As straight channels of width 6 with constrictions regularly spaced by L/~m. Each constriction was supposed to have the smallest diameter observed at the fissures (1 ~m). A numerical simulation was performed (Souza 1993) using the SIMPLE procedure developed by Patankar (1980), to calculate the effect of the constriction on the hydraulic conductance of the channel (figure 19).
(c) As a chain network of pores distributed according with their relative frequency measured at the pictures (figure 20). In this case, the equivalent hydraulic conductivity of the fissures was calculated from
Kf(6
x 1 ) =kf, gL
~3f(t × 1), [17]Af
where ken is the hydraulic conductance calculated for a series of connected pores disposed in a channel of length L, Af = 6xl is the transversal area of the channel and /;f(L x 1) is the apparent area presented by the fissures in a given transversal section L x 1 of the sample.
6.2. Numerical domain." discretization
Figure 21 represents the numerical grid used to solve the moisture flow problem. The finite volumes method (Patankar 1980) was used for the discretization of the continuum equations at selected nodal points. Flow was supposed to be two-dimensional at the blocks and one-dimensional at the fissures. Moisture content
O,j at each nodal point of the blocks was supposed to be related to the capillary
pressure and calculated by using the imbibition curve obtained at the second scale simulation.The capillary pressure was calculated at the nodal points at each time interval At. The position of the meniscus at the fissure was initially calculated by supposing the fissure walls to be impermeable, using
Kr-~x 2~32p = O, O<_x _< X(t),
[18]and
Kf FOp-] dX(t) [19]
g
Lax-lx.x = pL
dt 'where p is the capillary pressure and
X(t)
is the position of the meniscus in the main branch of the fissure. The solution of the above equations givesx(t) = / - " / ( p o -
pm)t,
X/Ptg
[2o]
~ . A ~ A i
MOISTURE DISTRIBUTION AND ISOTHERMAL TRANSFER 687
2 L
a y i | ~ • ~ J i , i l / ; , . , i [ i , ,
'[ ... i ... i ... i ... ... i ... i ... i ... i ... i ... i ... i ...
I:
'Axi'
i
i
11
j
i
j
i
I 1
i
i
i
i
• ~ ... i.~.._..~ ... ~ ... , ... ~ ... i ... i . . . ,, ~ ... i ... [ ... ! ...
It- ... ~ ... ' ... ' ... tt ~ ... ~ ... ' ... ,Jt, ... i , , , ... , . . .
s y m m e t r y line
Fig. 21. Numerical grid used to solve the invasion problem at the first scale.
where po and pm are the capillary pressures at x = 0 and at x = X, respectively, pm= --2a/3, as the fissure, was supposed to be a straight channel. Bifurcations were taken into account by using the mass conservation law, supposing the flux of liquid to be equally distributed between each of the three bifurcating channels,
Kr po - p b _ 3 Kf pb - - p , , [21]
g Xb g X b - - m '
and using, for each bifurcation,
Kf pb - - p m dXb _ m [22]
g X ' b - m - - pL dt '
where pb is the capillary pressure at the bifurcation and Xb - ~ is the distance between the bifurcation point and the meniscus. These equations were used to correct the meniscus position X(t). Due to geometrical symmetry (figure 21), this calculation needs only to be performed at the last bifurcation point found just to the rear of the position X(t) calculated using [20]. In fact, lateral branches behave as impermeable branches after the liquid front has reached the symmetry lines.
Inside the porous blocks, the following two-dimensional equation, in discrete form, was used:
K(p) ~ + K(p) = ~ ,
where K(p) is the hydraulic conductivity, calculated from (figure 20), 0(p) and is the moisture content, calculated in terms of the capillary pressure using the results found in the numerical simulation of imbibition (section 4).
The capillary pressures are calculated at the nodal points in the fissure, and these pressures are used as boundary conditions for calculating the capillary pressures at the nodal points of the blocks ([23]). The moisture flow into the blocks is then calculated by taking the derivatives of the pressure at the boundary surfaces, and the position of the meniscus is recalculated by solving the correct flow equation in the fissures:
c92p K ( p ) 3p _ 0, [24]
Kr ~-~xZ + 6 Oz
in discrete form. The position of the meniscus is found as the value of X for which p reaches the value pm. These new values of capillary pressure in the fissures are again used as boundary conditions for
[23] and the procedure continues until convergence is achieved.
For x = 0, the sample was supposed to be in equilibrium with liquid water submitted to 10 cm of suction, which corresponds to the value used in imbibition experiments performed with the sample material at 25°C.
688 P.C. PHILIPPI and H. A. SOUZA
0.35
0.30
E
~" 025
E
020
C 0 ¢~ 0.15
..,l
.~_ 0.10 o 3E
0.05
time 9
~×~ ¢ ~ + ~ + × ~ _ - - + - - time 8
~ ' "~\'~+ - - • time 7
" ~ " ~ / / - - × - - t i m e 6
---o--- time 5
---c>-- time 4
0.00 I I I - - ~ - - t
0.00 1.00 2.00 3.00 4.00 5.00
( x l t V 2 ) X 1 0 3
Fig. 22. Evolution with r / = x / t ~2 of the mean value of the moisture content taken over every 10 blocks in the x-direction.
6.3. Results: comparison with imbibition experiments
Figure 22 shows the time evolution of the wetting front from the left surface of the sample for the chain network with 150 blocks in the x-direction. Each point corresponds to a mean value of the water content taken over 10 blocks in the x-direction. The simulation finishes when the wetting front reaches the end of the sample. The time interval At corresponds, for both cases n = 100 and 150 blocks, to a constant fraction of the time spent by the front to reach the end of the fissure network when it is supposed to be impermeable. The interval between two successive times ti and t,+ ~, in figure 22, was taken as 10At. The figure shows the water content profiles as a function of the Boltzmann variable r / = x/t la. It is clearly seen that the moisture profiles converge to a single profile, as predicted by the Boltzmann equation, behaving like a continuous medium for larger times. This is somewhat dependent on the equivalent hydraulic conductivity of the fissures and on the sample length: well defined Boltzmann profiles were attained for n = 150 blocks and higher values of Kf. The final water content profile was smoothed, using a spline method and the mass diffusivity Do was obtained by using the Boltzmann method [see, for example, Hillel (1980)], over the smoothed profile:
Do(O) = -- 1 ~' d--O qdO. [251
Figure 23 shows the final results for 150 blocks in the x-direction, The simulations are compared with the experimental results obtained by Fernandes et al. (1991) in three different imbibition experiments, working with the same sample material and using two different experimental methods: gamma-ray attenuation and the hot-wire method. The expected error calculated for each experimental point is also plotted in figure 23 as vertical bars, taking the experimental dispersion of the water content and the calculating method into account.
M O I S T U R E D I S T R I B U T I O N A N D I S O T H E R M A L T R A N S F E R 689
1°-51
I 0 -6
10 -sZ
1 0 -9_ ~ .
10 -,o
10
- ' 1 ~ i w i w Sample R1, g a m m a - r a y s , test l
10-,2_~AAAAASampIe R1, g a m m a rays, t e s t 2 ~ l e o e e Sample R1, h o t - w i r e
q o c o c o Simulation: Chain Fnode] 10 -'~-4¢0000 Simulation: Channel
~ Simulation: Constricted c h a n n e l I
,,~ ¢~*¢* Calculated with E q u a t i o n - ( 2 6 )
|
10- -~ ... [ ... I ... I ... I . . . I ...
0 . 0 5 0 , 1 0 0.15 0.20 0.25 0.30 0 . 5 5
3 / 3,,
S a t u r a t i o n ( m ,, m )
Fig. 23. Isothermal mass diffusivity: comparison of different simulation models with experimental values, when the sample length is considered to be represented by 150 blocks in the x-direction.
The chain model gives the best results. The channel model overestimates Do, even when constrictions are used. This was somewhat expected as straight channels cannot represent the hydraulic properties o f the fissures displayed at figure 1. Chains of contiguous sites give a more precise representation o f fissures as a series network o f hydraulic constrictions, distributed in accordance with their measured relative frequencies. This better agreement must, however, be regarded with care: fissures were not observed as geometrical entities connected in 2D. The use of 150 blocks in the x-direction was dictated by computer processing limitations, which must be overcome for a more conclusive analysis.
The classical definition of mass diffusivity (De Vries 1958),
8 ~
Do = K -ffff , [26]
is also plotted in figure 23, where ~t' = p/pLg is the suction potential. In this case, 0q~/O0 is taken over an imbibition curve constructed from the overall pore size distribution curve (figure 3) and the values o f K were taken by extrapolating their values from figure 20 for higher moisture contents. The above equation would be applicable if the sample material was supposed to be homogeneous and the pores (including the ones found at the fissures) were randomly distributed in a single network. This is important for comparison purposes: differences with respect to experimental values are very significant, especially for higher moisture contents, showing the great contribution of fissures, considered as a connected chain o f contiguous pores, on the transport properties of mortar.
7. C O N C L U S I O N S
6 9 0 P . c . PHILIPPI and H. A. SOUZA
At the second scale, the pores were supposed to be embedded in a continuous matter whose hydraulic properties were calculated from the third scale model, and Maxwell-De Vries theory for composite media was used to predict the hydraulic conductivity. Eventual fissures connecting second scale pores were not considered, resulting in a weak dependence of the hydraulic conductivity with respect to the morphology and topology of second class pores.
Fissures were modelled as connected channels with an equivalent hydraulic conductivity calculated: (i) by considering the fissures as straight channels, (ii) by considering constrictions and (iii) by disposing the cavities found at the fissures in a series network. The third procedure gave the best results.
Numerical values of isothermal mass diffusivity were shown to have a strong dependence on the particular model used to represent the fissures, although the slope of the curves were apparently independent of fissure geometry.
Acknowledgements--H. A. Souza was supported by CAPES (Coordenaqfio de Aperfeiqoamento do Pessoal de Ensino Superior). The authors wish to acknowledge J.F. Da'/an from LTHE (Laboratoire d'l~tudes des Transferts en Hydrologie et Environment), Grenoble, for many suggestions and discussions on improving the paper. The authors also wish to acknowledge A. Blass for his careful revision of the English language.
R E F E R E N C E S
Auriault, J. L. & Boutin, C. 1992 Deformable porous media with double porosity. Quasi-statics: coupling effects. Transport Porous Media 7, 63-82.
Charlaix, E., Guyon, E. & Roux, S. 1987 Permeability of a random array of fractures of widely varying apertures. Transport Porous Media 3, 31-43.
Cinco-Ley, H. & Samaniego, F. 1981 Transient pressure analysis for fractured wells. J. Petroleum Technol. 1749-1766.
Daian, J. F. & Saliba, J. 1991 Determination d'un reseau al6atoire de pores pour mod61iser la sorption et la migration d'humidite dans un mortier de ciment. Int. J. Heat Mass Transfer 34, 2081 2096. David, C. G., Gueguen, Y. & Pampoukis, G. 1990 Effective medium theory and network theory
applied to the transport properties of rocks. J. Geophys. Res. 95, 165-177.
De Vries, D. A. 1952 The thermal conductivity of granular materials. Bull. Inst. Int. Froid 115-131. De Vries, D. A. 1958 Simultaneous transfer of heat and moisture in porous media. Trans. Am.
Geophys. Union 39, 909-916.
Fernandes, C. P., Philippi, P. C. & Da Cunha, J. A. B. 1991 Determinaqfio da difusividade isot6rmica de umidade atrav6s dos m6todos da sonda t6rmica e a t e n u a ~ o de raios-gama. In Proceedings of the XIXth Encontro sobre Escoamento em Meios Porosos, Campinas, SP, Brazil, pp. 163-167. Fernandes, C. P. & Philippi, P. C. 1989 Vapor condensation and moisture flow in building coating materials. In Heat and Mass TransJOr in Building Coating Materials (Edited by Chaddock, O. B. & Todorovic, B.), pp. 29-41. Hemisphere, Washington, DC.
Harris, C. K. 1990 Application of generalized effective-medium theory to transport in porous media.
Transport Porous Media 5, 517-542.
Harris, C. K. 1993 Effective-medium treatment of fluid flow through anisotropic fracture system--improved permeability estimates using a new lattice mapping. Transport Porous Media
9, 287-296.
Hillel, D. 1980 Fundamentals of Soil Physics. Academic Press. New York.
Hoshen, J. & Kopelman, R. 1976 Percolation and cluster distribution. I--Cluster multiple labeling technique and critical concentration algorithm. Phys. Ret,. B 14, 3438 3445.
Jacobs, D. A. H. 1980 Generalization of the conjugate gradient method for solving non-symmetric and complex systems of algebric equations. Central Eletricity Research Laboratories, Note No. R D / L / N 70/80, Job No. VC032, VC034, VC 453.
Jennings, H. M. 1988 Design of high strength cement based materials: Part 2 Microstructure. Mater. Sci. Technol. 4, 285-290.
King, P. R. 1989 The use of renormalization for calculating effective permeability. Transport Porous Media 4, 37-58.