APPENDIX
APPENDIX 1 – THE GLOBAL BEAUTY MARKET ... 3
Figure 1.1 – Premium and mass products share in the beauty market worldwide from 2005 to 2010... 3
Figure 1.2 - Global beauty sales by product category in 1998 and 2010 ... 3
Figure 1.3 - Global beauty across distribution channels from 2000-2010 ... 4
APPENDIX 2 – INTERNET AND SOCIAL MEDIA USAGE AND PENETRATION – A GLOBAL OVERVIEW ... 5
Figure 2.1 – Digital, Social & Mobile Worldwide in 2015 - Global Digital Snapshot ... 5
Figure 2.2 Digital, Social & Mobile Worldwide in 2015 - Digital in Europe ... 6
Figure 2.3 Active social media penetration in European countries in February 2014 ... 7
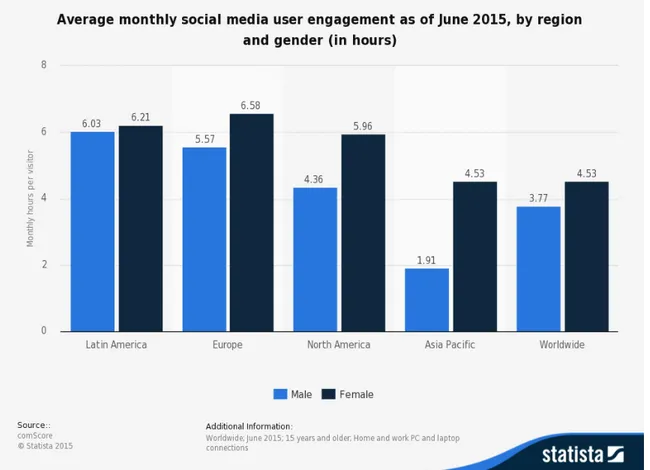
Figure 2.4 Average monthly social media user engagement as of June 2015, by region and gender (in hours) ... 8
Figure 2.5 - Social networks ad spending worldwide, by region, 2013-2017 (eMarketeer) ... 9
Figure 2.6 - Social media advertising revenue in selected countries in Europe in 2015 (in million US dollars) ... 10
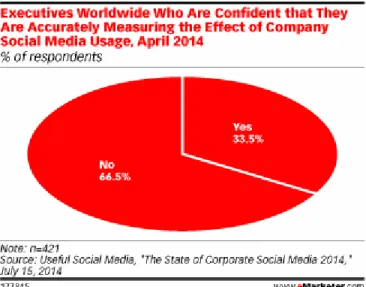
Figure 2.7 - Executives worldwide who are confident that they are accurately measuring the effect of company social media usage, April 2014 (Useful Social Media, 2014) ... 11
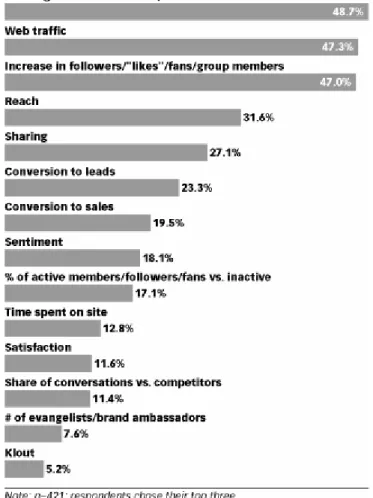
Figure 2.8 - Key Performance indicators (KPIs) for social media according to executives worldwide, April 2014... 12
Figure 2.9 - Number of monthly active Facebook users worldwide as of 4th quarter 2015 (in millions) ... 13
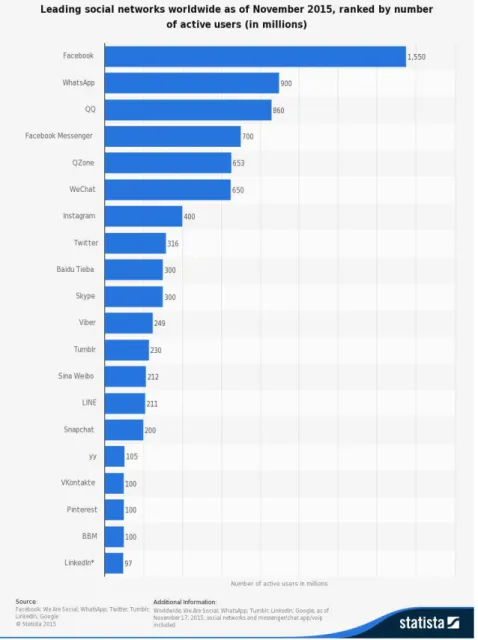
Figure 2.10 - Leading social networks as of November 2015, ranked by number of active users (2015) ... 14
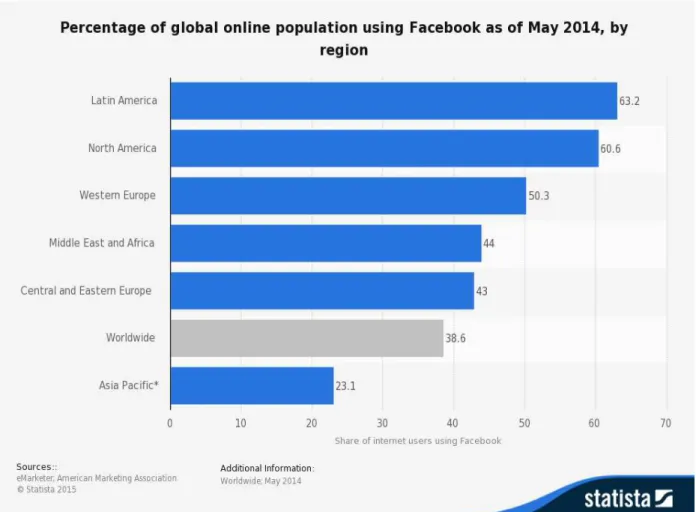
Figure 2.11 - Percentage of global online population using facebook as of May 2014, by region ... 15
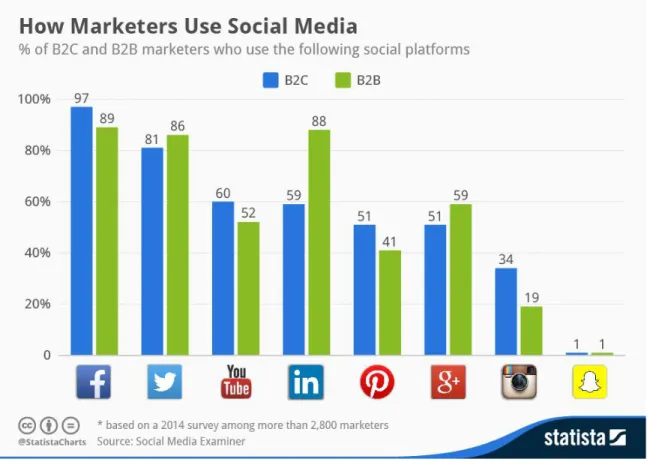
Figure 2.12 - How marketers use social media (% of B2C and B2B marketers who use the following social platforms) ... 16
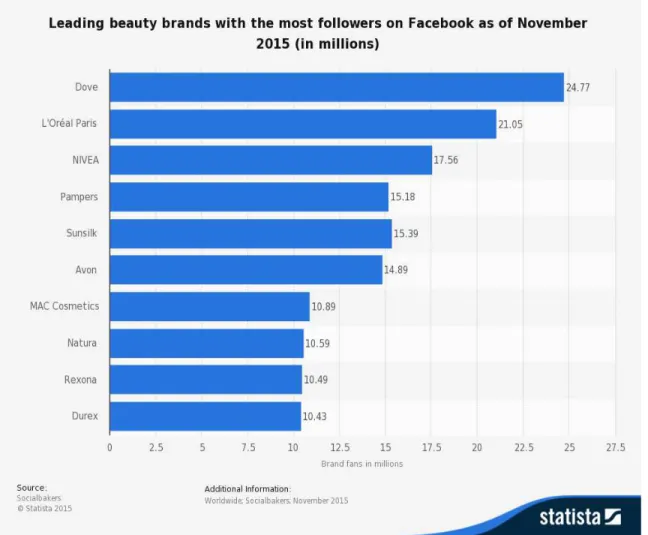
Figure 2.13 - Leading beauty brands with the most followers on Facebook as of November 2015 (in millions) ... 17
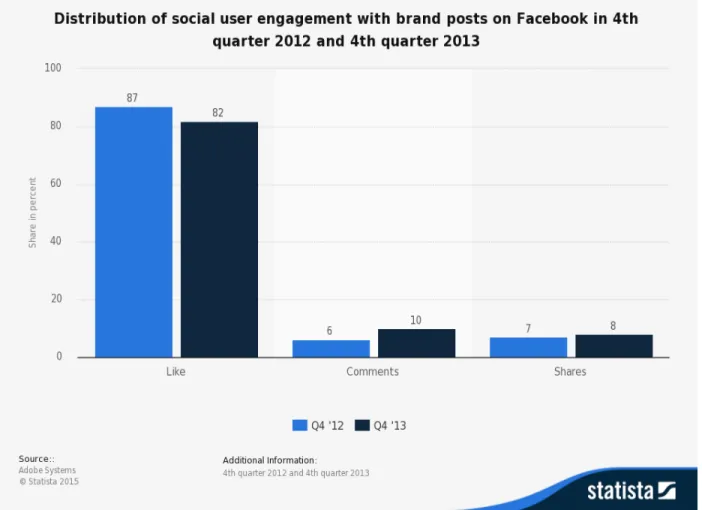
Figure 2.14 - Distribution of social user engagement with brand posts on facebook in 4th quarter 2012 and 4th quarter 2013 ... 18
APPENDIX 3 – SPROUT SOCIAL INDEX ... 19
Figure 3.1 - Regional brand response time (Sprout Social)... 19
Figure 3.2 - Regional brand response rates ... 20
APPENDIX 4 – METHODOLOGY ... 23
Figure 4.1 – Beauty brands under analysis ... 23
Figure 4.2 - Beauty opinion leaders under analysis ... 24
Figure 4.3 – Typification of the posts ... 25
APPENDIX 5 – RESULTS ... 35
Appendix 5.1 – Analysis of the presence of beauty brands on Facebook ... 35
Appendix 5.2 – Analysis of the presence of OLs on Facebook ... 39
APPENDIX 1 – THE GLOBAL BEAUTY MARKET
Figure 1.1 – Premium and mass products share in the beauty market worldwide from 2005 to 2010
Source: Euromonitor Internacional (2011). Barbalova, I.
Retrieved from
https://www.in-cosmetics.com/RXUK/RXUK_InCosmetics/documents/IC11_EuromonitorInt_GlobalBeautyAn dPersonalCare.pdf
Figure 1.2 - Global beauty sales by product category in 1998 and 2010
Product category 1998 2010
Skincare 16.4% 23.0%
Haircare 20.8% 17.3%
Color 13.5% 12.3%
Fragrances 12.9% 10.4%
Toiletries 21.2% 30.6%
Others 5.2% 6.4%
Total sales value (billion USD) 166.1 382.3
Source: Dutton (1999), Barbalova (2011), Euromonitor International
Figure 1.3 - Global beauty across distribution channels from 2000-2010
Distribution channel 2000 2005 2010
Non-store retailing 10.0 14.0 16.1
Drugstores 13.1 12.4 12.8
Department stores 13.3 10.6 9.5
Beauty specialists 13.9 13.1 13.4
Super/Hypermarkets 25.6 26.6 26.9
All others 24.1 23.9 21.3
Source: Barbalova 2011, Moulin 2012, Euromonitor International.
Retrieved from http://www.toknowpress.net/ISBN/978-961-6914-02-4/papers/ML13-365.pdf
Source: Euromonitor Internacional (2011). Barbalova, I.
Retrieved from
APPENDIX 2 – INTERNET AND SOCIAL MEDIA USAGE AND PENETRATION – A GLOBAL OVERVIEW
Figure 2.1 – Digital, Social & Mobile Worldwide in 2015 - Global Digital Snapshot
Source: “Digital Social & Mobile Worldwide in 2015”
Figure 2.2 Digital, Social & Mobile Worldwide in 2015 - Digital in Europe
Source: “Digital Social & Mobile Worldwide in 2015”
Figure 2.3 Active social media penetration in European countries in February 2014
http://www.statista.com/statistics/295660/active-social-media-penetration-in-european-Figure 2.4 Average monthly social media user engagement as of June 2015, by region and gender (in hours)
Figure 2.5 - Social networks ad spending worldwide, by region, 2013-2017 (eMarketeer)
Figure 2.6 - Social media advertising revenue in selected countries in Europe in 2015 (in million US dollars)
Figure 2.7 - Executives worldwide who are confident that they are accurately measuring the effect of company social media usage, April 2014 (Useful Social Media, 2014)
Figure 2.8 - Key Performance indicators (KPIs) for social media according to executives worldwide, April 2014
Figure 2.9 - Number of monthly active Facebook users worldwide as of 4th quarter 2015 (in millions)
Figure 2.10 - Leading social networks as of November 2015, ranked by number of active users (2015)
Figure 2.11 - Percentage of global online population using facebook as of May 2014, by region
Figure 2.12 - How marketers use social media (% of B2C and B2B marketers who use the following social platforms)
Figure 2.13 - Leading beauty brands with the most followers on Facebook as of November 2015 (in millions)
Figure 2.14 - Distribution of social user engagement with brand posts on facebook in 4th quarter 2012 and 4th quarter 2013
APPENDIX 3 – SPROUT SOCIAL INDEX
APPENDIX 4 – METHODOLOGY
Figure 4.1 – Beauty brands under analysis
Profile picture Page fans (likes) Typically replies within PTAT Photos posted by other people Avon
16,797,230 a few hours 3,032 0
Benefit Cosmetics
5,647,117 a few hours 872 227
Essie
8127 a day 785 23
Flormar
936,252 An hour 649 0
Kiehls
1,679,299 hours 174 174
Kiko Milano
3,821,553 an hour 3,607 3,607
L’Oreal Paris
23,837,780 a day 1,026 0
Make up For Ever
minutes
Maybeliine
3,379,228 a few hours 233 0
Inglot
Figure 4.2 - Beauty opinion leaders under analysis Name of the opinion leader Profile picture Page fans (likes) Typically replies within PTAT Photos posted by other people Coquette à
portuguesa Jael Correia
20609 A day 308 493
Devil wears Louboutin
Helena Coelho
23120 N/A 34 117
Glimmer le blonde
Andreia Calisto
18159 An hour 300 84
Inês Franco – Maquilhag em e cabelos
Inês Franco
220946 N/A 6001 0
Inês Mocho
– Make Up Inês Mocho
76299 N/A 2036 464
Last minute dreams
Carolina Flores
14697 N/A 133 0
Last Time Around
Mafalda Castro
10597 N/A 268 37
Sempre na moda
Camila Bento
41304 N/A 138 93
Sketchbook six la petite
Joana Carreira
19623 N/A 0 426
Style it up
Margarida Almeida e Cátia Dias
Figure 4.3 – Typification of the posts
Type Example Description
Album
Album
containing 2 or more photos
Animated image share
Avatar Page share
Cover photo
Cover photo upload
Life event
Option used to add an
experience from a part of a person/entity’s life
Map
Multi share
Share of several pictures in an external source accessed through one (or more) links.
Multi share fixed text
Multi share no end card
From the point of view of the consumer, it looks like a Multi share. Therefore it was merged for the purpose of the analysis
Music aggregation
New album
Photo album (From the point of view of the consumer, it looks like an album.
Therefore it was merged for the purpose of the analysis)
note
Opens a new page, similar to a word
Photo
Rich media
Share Link share
Square image share
From the point of view of the consumer, it looks like a share.
Therefore it was merged for the purpose of the analysis
Video inline
Video that starts playing when the person scrolls down
Video share highlighted
Youtube
APPENDIX 5 – RESULTS
Appendix 5.1 – Analysis of the presence of beauty brands on Facebook
Figure 5.1.1 - Analysis of the engagement rate and average engagement per post generated by each
brand’s Facebook page
Average engagement per post
Engagement rate (Total engagement/Number of
fans)
Essie 81.8 1.81
Flormar 46.6 0.05
Kiehls 33.1 0.00
Make up For Ever 34.3 0.00
Maybelline 264.1 0.03
Kiko Milano 141.3 0.03
Benefit Cosmetics 161.7 0.01
Avon 294.1 0.01
L’Oreal Paris 679.6 0.01
Inglot 162.1 1.43
Figure 5.1.2 - Analysis of the engagement per post depending on whether the post has written content or not (aggregated analysis for all brands)
Analysis of the difference in engagement depending on whether there is written content on the post
Number of posts Total engagement Engagement per post
No text content 302 28,786 95.3
Text content 3,873 695,552 180
Total 4,175 724,338 173.5
Figure 5.1.3 - Analysis of the engagement per post depending on whether the post contains a question or not (aggregated analysis for all brands)
Analysis of the difference in engagement depending on whether there is a question on the post
Number of posts Total engagement Engagement per post
No question 2,923 471,094 161.2
Question 1,252 253,244 202.3
Total 4,175 724,338 173.5
Figure 5.1.4 - Analysis of the engagement per post depending on the type of post (aggregated analysis for all brands)
Analysis of the differences in engagement according to the type of post
Type of post Number of posts Total engagement Engagement per post
Text 1 14 14.0
Life event 2 779 389.5
Map 2 36 18.0
Music aggregation 2 67 33.5
Video share highlighted 6 101 16.8
Avatar 11 9 0.8
Note 21 681 32.4
Event 48 1,451 30.2
Animated image share 59 32,056 543.3
Youtube 66 5,135 77.8
Multi_share 61 4,951 81.2
Cover_photo 90 7,390 82.1
Album 221 28,840 130.5
Share 270 36,578 135.5
Video inline 441 136,465 309.4
Photo 2874 469,785 163.5
Figure 5.1.5 - Analysis of the engagement per post depending on the day of the week (aggregated analysis for all brands)
Analysis of the differences in engagement according to the day of the week the post was made
Day of the week Number of
posts Total engagement Engagement per post
Monday 640 111,816 175
Tuesday 642 142,918 223
Wednesday 657 137,114 209
Thursday 679 101,329 149
Friday 714 120,056 168
Saturday 476 58,837 124
Sunday 367 52,268 142
Total 4,175 724,338 173.5
Figure 5.1.6 - Analysis of the engagement per post depending on hour the post was published (aggregated analysis for all brands)
Analysis of the differences in engagement depending on the hour of the post
Hour of the post Number of
posts Total engagement Engagement per post
0 19 5,127 269.8
1 4 229 57.3
2 1 19 19.0
3 1 18 18.0
4 1 9 9.0
8 14 900 64.3
9 191 21,837 114.3
10 392 74,659 190.5
11 399 119,246 298.9
12 483 97,156 201.2
13 346 60,087 173.7
14 204 26,197 128.4
15 241 36,942 153.3
16 229 47,577 207.8
17 207 31,761 153.4
18 312 45,269 145.1
19 330 30,494 92.4
20 267 25,642 96.0
21 327 58,637 179.3
22 178 39,537 222.1
23 29 2,995 103.3
Figure 5.1.7 - Analysis of the engagement per post depending on the month the post was published (aggregated analysis for all brands)
Analysis of the difference in engagement depending on the month the post was published
Month Number of
posts Total engagement
Engagement per post
January 288 54,535 189.4
February 333 69,734 209.4
March 371 68,803 185.5
April 339 94,508 278.8
May 336 45,844 136.4
June 321 37,650 117.3
July 440 40,084 91.1
August 368 61,167 166.2
September 394 52,535 133.3
October 336 54,918 163.4
November 317 66,096 208.5
December 332 78,464 236.3
Appendix 5.2 – Analysis of the presence of OLs on Facebook
Figure 5.2.1 - Analysis of the engagement rate and average engagement per post generated by each OL’s Facebook page
Average engagement per post
Engagement rate (Total engagement/Number of fans)
Coquette à portuguesa 71.3 2.66
Devil wears Louboutin 246.0 1.95
Glimmer le blonde 29.7 0.68
Las minute dreams 14.8 0.57
Style it up 56.2 0.85
Inês Franco –
Maquilhagem e cabelos 654.8 2.02
Sempre na moda 27.5 0.34
Inês Mocho Make up 27.5 0.18
Last Time around 65.9 1.98
Sketchbook la petite 46.7 4.69
Opinion leaders
Figure 5.2.2 - Analysis of the engagement per post depending on whether the post has written content or not (aggregated analysis for all OLs)
Analysis of the difference in engagement depending on whether there is text content on the post
Number of posts Total engagement Engagement per post
No text content 737 32,682 44.3
Text content 6,436 964,175 149.8
Total 7,173 996,857 139.0
Figure 5.2.3 - Analysis of the engagement per post depending on whether the post contains a question or not (aggregated analysis for all OLs)
Analysis of the difference in engagement depending on whether there is a question on the post
Number of posts Total engagement Engagement per post
No question 5,342 630,106 118.0
Question 1,831 366,751 200.3
Total 7,173 996,857 139.0
Figure 5.2.4 - Analysis of the engagement per post depending on the type of post (aggregated analysis for all OLs)
Analysis of the differences in engagement according to the type of post
Type of post Number of posts Total engagement Engagement per post
Text 1 254 254
Music aggregation 3 23 8
Event 6 156 26
Video share highlighted 8 157 20
Animated image share 13 1,991 153
Avatar 15 353 24
Cover photo 21 1,639 78
Multi share 73 2,769 38
Youtube 137 13,846 101
Album 139 25,377 183
Video inline 143 62,682 438
Share 3,612 267,100 74
Total 7,173 996,857 139.0
Figure 5.2.5 - Analysis of the engagement per post depending on the day of the week (aggregated analysis for all OLs)
Analysis of the differences in engagement according to the day of the week the post was made
Day of the week Number of
posts Total engagement Engagement per post
Mon 1,161 157,696 136
Tue 1,149 162,971 142
Wed 1,124 169,754 151
Thursday 1,117 164,929 148
Friday 1,031 158,513 154
Saturday 757 76,141 101
Sunday 834 106,853 128
Total 7,173 996,857 139.0
Figure 5.2.6 - Analysis of the engagement per post depending on hour the post was published (aggregated analysis for all OLs)
Analysis of the differences in engagement depending on the hour of the post
Hour of the post Number of
posts Total engagement
Engagement per post
0 101 8,870 88
1 38 3,393 89
2 16 1,268 79
3 1 602 602.0
4 2 529 264.5
6 2 580 290.0
7 6 1,202 200.3
8 108 10,666 98.8
9 373 31,120 83.4
10 520 46,145 88.7
11 578 70,953 122.8
12 514 54,823 106.7
13 480 78,986 164.6
16 445 53,561 120.4
17 369 40,605 110.0
18 407 49,461 121.5
19 413 38,628 93.5
20 414 60,511 146.2
21 608 174,677 287.3
22 550 92,670 168.5
23 248 29,721 119.8
Total 7,173 996,857 139.0
Figure 5.2.7 - Analysis of the engagement per post depending on the month the post was published (aggregated analysis for all OLs)
Analysis of the difference in engagement depending on the month the post was published
Month Number of
posts Total engagement
Engagement per post
January 595 94,760 159.3
February 697 104,078 149.3
March 622 86,182 138.6
April 515 69,847 135.6
May 543 56,506 104.1
June 537 90,696 168.9
July 523 70,012 133.9
August 504 73,896 146.6
September 630 74,976 119.0
October 667 109,308 163.9
November 694 87,608 126.2
December 646 78,988 122.3
Appendix 5.3 – Comparing the effect of different criteria on Facebook engagement with posts made by beauty brands and by beauty OLs in Portugal
Figure 5.3.1 – Comparing engagement per post depending on whether the post has written content or not
Figure 5.3.2 – Comparing engagement per post depending on whether the post contains a question or not
179.6
95.3 149.8
44.3
Text No text content
Comparing engagement generated by posts which containt written context and posts which don't
Brand Opinion leader
161.2
202.3
118.0
200.3
No question Question
Comparing engagement generated by posts which contain a question and posts that don't
Figure 5.3.3 – Comparing engagement per post depending on the type of post
0.0 100.0 200.0 300.0 400.0 500.0 600.0 Text
life_event map music aggregation vide_share_highlighted avatar note event animated_image_share youtube multi_share cover_photo album share video_inline photo
Comparing engagement generated by different types of posts
Figure 5.1.5 – Comparing engagement per post depending on the day of the week
Figure 5.1.6 - Analysis of the engagement per post depending on hour the post was published
0 50 100 150 200 250
Mon Tue Wed Thursday Friday Saturday Sunday
Comparing engagement generated across the week
Brand Opinion leader
0.0 100.0 200.0 300.0 400.0 500.0 600.0 700.0
0 1 2 3 4 6 7 8 9 10 11 12 13 14 15 16 17 18 19 20 21 22 23
Comparing average engagement generated across the day
Figure 5.1.7 – Comparing engagement per post depending on the month the post was published
0.0 50.0 100.0 150.0 200.0 250.0 300.0
Comparing average engagement generated in different months