eight postpartum weeks
L. Guedes-Martins1,2,3, A. R. Gaio4,5, J. Saraiva1,3, A. Cunha3, F. Macedo6& H. Almeida1,2,7
1Department of Experimental Biology, Faculty of Medicine, University of Porto, 4200-319 Porto, Portugal,2IBMC-Instituto de Biologia Molecular e Celular, 4150-180 Porto, Portugal,3Hospital Centre of Porto EPE, Department of Women and Reproductive Medicine, Largo Prof. Abel Salazar, 4099-001 Porto, Portugal,4Department of Mathematics, Faculty of Sciences, University of Porto, 4169-007 Porto, Portugal,5CMUP-Centre of Mathematics, University of Porto, 4169-007 Porto, Portugal,6Department of Cardiology, Faculty of Medicine, University of Porto, 4200-319 Porto, Portugal,7Obstetrics-Gynecology, Hospital-CUF Porto, 4100-180 Porto, Portugal.
The aim of this study was to construct reference ranges for the uterine artery (UtA) mean pulsatility (PI) and resistance (RI) indices from 1–8 weeks postpartum. A prospective, cross-sectional, and observational study was performed with 320 healthy women from week 1 through week 8 postpartum. UtAs were examined transvaginally using colour and pulsed Doppler imaging, and the means of the right and left values of the PI and RI, as well as the presence or absence of a bilateral protodiastolic notch, were recorded. The 5th, 50thand
95threference percentile curves for the UtA-PI and UtA-RI were derived using regression models. The
adjusted reference intervals uncovered a convergence trend at the week 8 time-point, although impedance was lower at the week 1 time-point in multiparous women compared with primiparous women. The notching prevalence was 22.5% (9/40) at week 1 and 95.0% (38/40) at week 8. The study revealed consistent evidence of a progressive increase of postpartum uterine impedance and provided new average UtA-PI and UtA-RI reference charts for weeks 1 through 8. Multiparity does not change the trend but does impart a lower rate of increase, likely as a consequence of previous vascular structural and functional differences.
D
oppler ultrasound has been used to measure the flow resistance indices of the uterine arteries during the menstrual cycle1,2, pregnancy3, and labour4,5. Throughout the menstrual cycle, a lack of significant uterine artery (UtA) impedance changes2or higher UtA impedance early and late in the cycle, compared with reduced levels mid-cycle or in the luteal phase, has been reported6,7.The results that accompany the pelvic circulatory changes necessary to adapt the blood supply to the nutri-tionally demanding developing foetus are more consistent over the course of pregnancy. This unique situation translates into a continuous reduction in uterine artery resistance starting by week 6 of pregnancy8,9. This downward trend has been proposed to result from an appropriate trophoblast invasion of the uterine spiral arteries that, when abnormal, correlates with resistive uterine artery behaviour3,10.
In contrast to the extensive literature available during pregnancy, Doppler research on the uterine artery during the postpartum period is scarce. Nevertheless, puerperal conditions affecting the uterine circulation might occur, and the ability of UtA impedance, as measured by Doppler ultrasound, to predict these conditions would be immensely useful11–13. Among the potential complications, preeclampsia, postpartum haemorrhage, retained placental tissue, and infection are particularly relevant.
The absence of reference curves for uterine arteries resistance indices in an uneventful postpartum period has limited the assessment of puerperal conditions, as well as research progression in the area. This is important because in addition to providing relevant knowledge on the return of the local circulation to the previous, non-pregnant state, those reference values could help to more accurately interpret the pathophysiology of the puer-perium13. This need led us to measure the UtA mean pulsatility (PI) and resistance (RI) indices at 1–8 weeks postpartum in an appropriate selected population to derive normative, weekly based reference ranges.
Results
Figure 1 shows the numbers of postpartum women at each stage of the study. The main characteristics and pregnancy outcomes of the 320 women are shown in Table 1. In 40.3% (CI95%: 34.9–45.9) of the cases, Caesarean section was the mode of delivery; in more than 90% of those cases, the reason for that procedure was prior Caesarean delivery, dystocia, foetal distress, or breech presentation (Table 2). The evaluated postpartum period ranged from 1 to 8 weeks, and the collected data were balanced, with 40 observations made per week. SUBJECT AREAS:
OUTCOMES RESEARCH PHYSIOLOGY DISEASES
Received 3 September 2014
Accepted 4 February 2015
Published 5 March 2015
At the time of the Doppler measurements, 30.3% (CI95%: 25.4– 35.7) of the mothers were not breastfeeding, 16.6% (CI95%: 12.8– 21.2) were smokers, and 23.4% (CI95%: 18.9–28.5) had a BMI greater than or equal to 30 Kg/m2. The 10thpercentile of the sample for birth weight was 2770 g.
Figure 2 shows the different types of uterine artery Doppler shift spectra obtained at different time-points. A gradual increase in the RI and PI were observed from A (week 1) to C (week 8), whereas the diastolic flow became weaker, exhibiting a well-defined protodiasto-lic notch (Figure 2C).
The prevalence of uterine artery positive notching (defined as at least one notch) was 22.5% (9/40) at week 1 and 95.0% (38/40) at week 8 (p,0.001), as shown in Table 3. Except for week 3, at which the notch incidence was significantly lower in multiparous women (p
, 0.001), no additional significant, parity-related differences for notching were detected over time.
The reliability coefficient for the UtA-PI was 0.170. The ICC for absolute agreement among the single observer measurements was 0.985, with a 95% CI ranging from 0.982 to 0.988. Similarly, the
reliability coefficient for the UtA-RI measurements was 0.042. The ICC for the absolute agreement among the single observer measure-ments was 0.982, with a 95% CI ranging from 0.978 to 0.986.
The magnitude of the obtained ICC values for the pulsatility and resistance indices allowed for one of the two measurements obtained from each woman to be ignored in the statistical analysis. Because the sonographer only performed one measurement in his/her day-to-day practice, the first measurements were considered.
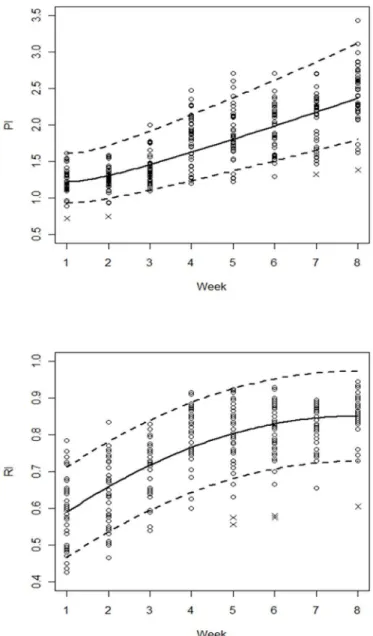
increasing function of the postpartum time, with an increasing rate of softening from the 2ndpostpartum week onwards (Figure 3, Table 5). Adjustment for potential time effect confounders only identified parity as a statistically significant variable; maternal age, BMI, smok-ing, mode of delivery, infant birth weight, breastfeedsmok-ing, and hae-moglobin on postpartum day 2 did not have significant effects on the UtA resistance indices during the first eight postpartum weeks (Table 4). The resulting model was a cubic polynomial on the log-transformed variables, with significant second-order interaction terms between parity and postpartum time. Model estimates are presented in Table 4B, and the 5th, 50thand 95thpercentiles are plotted in Figure 4A. The error variances were allowed to differ depending on the postpartum week. The set of seven observations with standar-dised residuals less than 22.5 compromised the error normality; therefore, those observations were removed (Figure 4A). As depicted in Figure 4A, multiparous women started the postpartum period by
Figure 2|Doppler shift spectra recorded from the uterine arteries at 1 (A), 4 (B) and 8 (C) weeks postpartum.(A) Waveforms with velocities gradually decreasing from the systolic peak and with continuous forward flow in diastole; (B1C) waveforms with a notch and with continuous forward flow in diastole. The pulsatility index (PI) is used as a
measurement of impedance of the flow blood distal to the sampling point
and is automatically calculated according to the formulaPI~ s {d
ð Þ
mean, wheresis the peak,dis the minimum, and themeanis the average
maximum Doppler shift frequency over the cardiac cycle. The resistance
index (RI) is automatically calculated using the formulaRI~ s {d
ð Þ
s ,
wheresis peak systolic,dis end-diastolic,cis early diastolic, andxis
maximum diastolic frequency.
Table 1 | Main characteristics and obstetric data of the 320 women included in the study
n (%)
Age intervals, in years 18–24 54 (16.9)
25–34 166
(51.9)
35–43 100
(31.2) Age,years(mean6SD*) 30.866.50
-Ethnicity White 309
(96.6) Black 4 (1.2) Other 7 (2.2)
Parity .1 119
(37.2)
Body mass index{(kg/m2) 16–24 118
(36.9)
25–29 127
(39.7) 30–44 75 (23.4)
Smoking{ 53 (16.6)
GA{at delivery,weeks(median
6IQR**) 40.1 (39.1–40.6)
-Caesarean section 129
(40.3)
Apgar score at 59 ,7 0 (0)
Birth weight at delivery,g(mean6SD*) 3160.7 (6344.93)
-Haemoglobin on day 2,g/dL(mean6
SD*)
11.1 (61.05)
-Breastfeeding{ 223
(69.7)
*SD, standard deviation; **IQR, interquartile range;
{Obtained by the moment of the Doppler flow acquisition;
{GA, gestational age.
Table 2 | Indication for Caesarean sections (n5129) in the study
sample
Caesarean Deliveries (%)*
Primary Dystocia 26 (20.2)
Non-reassuring foetal heart rate 17 (13.2)
Abnormal presentation 15 (11.6)
Unsuccessful trial of forceps or vacuum 12 (9.3)
Repeat No VBAC attempt 38 (29.5)
Failed VBAC 14 (10.8)
Unsuccessful trial of forceps or vacuum 7 (5.4)
exhibiting lower UTA-PIs than those predicted for the primiparous women. As time progressed, the predicted values for each group approached one another.
UtA-RI.The crude effect of the postpartum week progression on the UtA-RI was estimated using a quadratic polynomial. The regression model equation and the estimated coefficient values are presented in Table 4A. The likelihood ratio test favoured the model with different variances according to the postpartum week. Due to small departures from normality on the left tail, the 5 observations with standardised residuals less than22.5 were removed. The UtA-RI values of these women corresponded to the lowest values observed in weeks 5, 6 and 8. The predicted regression curve was a concave-down increasing function, which would theoretically achieve its maximum at 8.6 weeks (Figure 3).
As for the PI, the adjustment for potential time effect confounders only identified parity as a statistically significant variable. The result-ing model is presented in Table 4B and is plotted in Figure 4B: it is a quadratic polynomial plotted against postpartum weeks, with differ-ent intercept and slope coefficidiffer-ents according to the parity status. Error variances were again allowed to differ with the postpartum week. Six observations with standardised residuals less than 22.5 compromised the error normality and were therefore removed from the model. During the first weeks, the UtA-RI values for multiparous women were significantly lower than those observed for primiparous women (Figure 4, Table 5). However, as time progressed, that effect ceased to be significant, and the predicted values for both groups were no longer significantly different from one another.
Discussion
During the first few weeks after delivery, an important change occurs in the pelvic circulation because the blood requirements of preg-nancy are no longer necessary. Exactly how quickly these regional haemodynamic changes return to the non-pregnant state is not well understood. The process involves spiral artery luminal oblitera-tion due to phenomena such as thrombosis, endarteritis and intima thickening14, which result in increased local vascular resistance15. Although this finding may reflect systemic circulatory changes16,17, an immediate cause for the events is the mechanical pressure im-posed by the contracted postpartum myometrium, as well as, possibly, local immunological phenomena18. As the structural involution of the uterine artery and distal branches occurs, functional changes can be assessed using a computerised analysis of the blood velocity spectrum obtained with Doppler ultrasound. In our cross-sectional investigation, assessment of the UtA-PI and UtA-RI during the first eight weeks postpartum uncovered a progressive, significant increase in UtA impedance.
Statistics.Our study provides reference ranges of the mean UtA-PI and UtA-RI for each week between 1 and 8 weeks postpartum in an appropriately large sample of healthy, normotensive women. Furthermore, stringent and validated methodological guidelines were employed to construct these reference ranges19,20. Although a cross-sectional design was used, we included the same number of observations at each week postpartum for reasons related to clinical practice procedures.
The reliability study of the UtA-PI and UtA-RI measurements was based on the ICC. Because the number of obtained coefficients was greater than 0.7, the authors inferred that the measurements were highly repeatable, with a very low measurement error19,21.
From the statistical point of view, a variety of strategies for con-structing reference intervals and percentile charts have been pub-lished22: linear regression, if necessary, along with modelling of the residual standard deviation; the LMS curves method, introduced by Cole23; the non-parametric HRY method of Healy, Rabash and Young24; and, finally, non-parametric quantile regression. In this study, the authors used the linear model, regressing UtA-PI and UtA-RI on polynomial functions of the postpartum time and con-sidering adjustments for potential confounders such as parity, mater-nal age, BMI, smoking, mode of delivery (vagimater-nal vs Caesarean section), infant birth weight, breast-feeding, and haemoglobin on day 2 postpartum. Because the evaluation of the goodness of fit of the model was very satisfactory, the percentile curves for the UtA-PI and UtA-RI were confidently identified from those linear models.
UtA-PI and UtA-RI reference ranges.Transvaginal assessment of UtA impedance by employing Doppler ultrasound offers several advantages over the transabdominal route25. The vessel is easily identified and is located within close proximity, thus yielding clearer waveforms. Additionally, the insonation angle is near 0u, which results in high reproducibility25,26.
Previous reports addressing postpartum uterine artery impedance reported results with considerable variation in the time-points assessed, the indices employed and the population features, which may underlie the diversity of observations. Although there is a gen-eral consensus that within 12–14 weeks postpartum, the uterine artery impedance rises towards the non-pregnant values13,27–32, the findings are conflicting at earlier days; a marked increase27–32, no change or even a minor transient reduction in impedance data have all been reported13,32.
The current cross-sectional study also provides evidence of an increasing trend towards pre-pregnancy impedance values; in addi-tion, it provides more time points, studied on a regular weekly basis, and considerably extended the number of patients. In agreement with a previous longitudinal study13,33this study showed that by 8
Table 3 | Absolute (relative, %) parity frequencies in each group of 40 women examined per week and absolute (relative, %) frequencies for postpartum uterine artery positive notching (at least one notch)
Parity Positive Notching
Week Primiparous Multiparous All n (%) p-value* Primiparous n (%)
Multiparous
n (%) p-value{
1 28 (70.0) 12 (30.0) 9 (22.5) ,0.001 8 (28.6) 1 (8.3) 0.233
2 28 (70.0) 12 (30.0) 8 (20.0) 8 (28.6) 0 (0) 0.079
3 26 (65.0) 14 (35.0) 17 (42.5) 16 (61.5) 1 (7.1) ,0.001
4 28 (70.0) 12 (30.0) 31 (77.5) 25 (89.3) 6 (50.0) 0.012
5 24 (60.0) 16 (40.0) 34 (85.0) 21 (87.5) 13 (81.2) 0.668
6 24 (60.0) 16 (40.0) 32 (80.0) 20 (83.3) 12 (75.0) 0.691
7 22 (55.0) 18 (45.0) 35 (87.5) 21 (95.5) 14 (77.8) 0.155
8 21 (52.5) 19 (47.5) 38 (95.0) 20 (95.2) 18 (94.7) 1.000
*p-value from ax2-test assessing the value of positive notching frequencies along the postpartum weeks;
{
p-value fromx2-tests assessing the homogeneity of proportions between primiparous and multiparous women (using Bonferroni’s correction for multiple comparisons, significance should be taken at the level
weeks postpartum, the regional pelvic circulation had not yet recov-ered to the non-pregnant state27, emphasising that the time needed for UtA re-adaptation to the non-pregnant state is more extensive than previously assumed13,27. It is possible that longer-term factors acting at the endothelium of the uterine artery or systemically6,31take part in the cardiovascular adaptation that results in the normal waveform30.
Accompanying this trend, the reappearance of the proto-diastolic notch was noticed as early as the second day postpartum27. Our study confirms that in the early days after delivery, only a small number of patients will display notching (defined as at least one notch) but, with a gradual increase each week, the presence of this feature approaches 100% of cases, similarly to the findings of a previous report from others13.
Effect of parity on uterine flow impedance.In our research, mater-nal age, BMI, smoking, mode of delivery (vagimater-nal vs Caesarean
section), infant birth weight, breast-feeding, and haemoglobin on day 2 postpartum did not cause any significant effects on UtA impedance during the first eight weeks postpartum. However, during the same period, UtA impedance was significantly affected by maternal parity, a condition not examined in previous reports and a likely reason for the diversity of results.
In the current study, multiparous women exhibited lower UTA PIs and RIs during the early weeks, which converged to values similar to primiparous RIs and PIs by the eighth week. Presumably, the UtA capacitance properties observed in multiparous women are the result of vascular structural features that remained from the first preg-nancy. In fact, although the well-known spiral artery remodelling that occurs during pregnancy34reverts upon delivery, not all vessels recover to their pre-pregnancy conditions. Indeed, spiral artery internal elastic lamina duplication or fragmentation was described at the endometrial/myometrial junction of parous women in contrast to nulliparous women35. We are convinced that such permanent structural changes endow the spiral arteries with reduced impedance and underlie the parity-related lower UtA-PI and UtA-RI values that we report in the immediate postpartum period.
Figure 3|Sample values and the estimated 5th, 50thand 95thpercentile
regression curves for the uterine artery pulsatility (PI) and resistance (RI) indices in all women during the first 8 postpartum weeks.Points marked with (x) were removed from the model fitting to improve normality.
Table 4 | Estimates of the regression coefficients and correspond-ing p-values for the PI and RI models durcorrespond-ing the postpartum period (A), as well as stratified by the parity status (B). The additive effects of potential time confounders are also shown; only the parity status had a statistically significant time-adjusted effect (A)
Variables CoefficientsRegression p-values
A* log (PI) Intercept 0.203 0.000
log(Week) 20.023 0.653
log2(Week) 0.164 0.000
Multiparous (vs primiparous) 20.127 0.000
BMI 25–29 (vs BMI 16–24) 20.032 0.137 BMI 30–44 (vs BMI 16–24) 20.025 0.337 Age 25–34 (vs age 18–24) 20.022 0.419 Age 35–43 (vs age 18–24) 0.001 0.974
Vaginal (vs Caesarean) 0.036 0.061
Smoker (vs non-smoker) 0.017 0.506
Birth weight (g) 0.000 0.991
Haemoglobin on day 2 (g/dL) 20.007 0.470
RI Intercept 0.508 0.000
Week 0.086 0.000
Week2
20.005 0.000 Multiparous (vs primiparous) 20.037 0.000 BMI 25–29 (vs BMI 16–24) 0.002 0.819
BMI 30–44 (vs BMI 16–24) 0.002 0.873
Age 25–34 (vs age 18–24) 20.002 0.860
Age 35–43 (vs age 18–24) 0.001 0.940
Vaginal (vs Caesarean) 0.001 0.943
Smoker (vs non-smoker) 20.008 0.416 Birth weight (g) 0.694 0.694
Haemoglobin on day 2 (g/dL) 0.106 0.106
B{ log (PI) Intercept 0.255 0.000
Multiparous (vs primiparous) 20.141 0.001
log(Week) 20.229 0.019
log(Week):Multiparous 20.209 0.018
log2(Week) 0.489 0.000
log2(Week):Multiparous 0.127 0.002 log3(Week)
20.115 0.003
RI Intercept 0.535 0.000
Multiparous (vs primiparous) 20.117 0.000
Week 0.088 0.000
Week: Multiparous 0.014 0.000
Week2
20.006 0.000
*A: The estimated equation for PI wasEðlogð ÞjPI wÞ~b0zb1logð Þwzb2log2ð Þw or, equivalently,
EðPIjwÞ~Cwb1zb2logð Þw withC~eb0, for any given weekw. The estimated equation for RI was
EðRIjwÞ~b0zb1wzb2w2.
{
B: The estimated equation for PI was
Eðlogð ÞjPI w,sÞ~b0ð Þszb1ð Þlogs ð Þwzb2ð Þlogs 2ð Þwzb
3log3ð Þw or, equivalently,
EðPIjw,sÞ~Cw
b1ð Þszb2ð Þslogð Þwzb3log2ð ÞwwithC~eb0ð Þs, for any given weekwand parity statuss. The estimated equation for RI wasEðRIjw,sÞ~b0ð Þszb1ð Þswzb2w2.
External validity, study limitations and future research.As with any study, the choice of an appropriate sample is of great importance. While some published studies used routinely collected data, resulting in the inclusion of multiple observations of some participants, Altman and Chitty36 advocate specifically collecting data for the purpose of developing reference ranges (sometimes misleadingly called ‘normal ranges’), with each participant being included only once. Within this objective, it is important to have as unselected a sample as possible because reference data should relate to ‘normal’ characteristics37. In reality, ‘reference intervals’ for known sono-graphic features, either maternal or foetal, are not synonymous with ‘normal ranges’ for these characteristics36,37. This is because in clinical practice, it is extremely difficult (nearly impossible) to obtain a truly unselected population. Our goal was achieved with a method-ology that sought an appropriate selected sample, but we did not have a truly unselected population. Therefore, any maternal condition that could potentially affect the uterine artery Doppler was deemed reasonable to be an exclusion criterion. However, our study design may attract criticism for producing supernormal ranges that are less applicable to the general population. For this reason, despite the current inclusion criteria, we did not exclude participants due to complicating factors that developed after recruitment. Neverthe-less, no complications occurred in the studied group (patients ‘Included in the study’) during the first eight postpartum weeks.
As with the introduction of any new technology into clinical prac-tice, it is essential that those conducting Doppler assessment are adequately trained and that their results are subjected to rigorous audit. Although our data were collected by a single, very experienced
operator, which could compromise the external validity of his results, Doppler blood flow measurements of the UtA impedance were found to be highly repeatable only when carried out by well-trained opera-tors25. Because the usefulness of a screening test depends not only on its predictive ability but also on its reproducibility, future studies are needed to demonstrate the usefulness of these reference ranges, as well as their applicability.
In short, the median 5thand the 95thpercentile regression curves of the pulsatility and resistance indices of the uterine artery increase from week 1 to week 8 postpartum. Parity does not change the trend, but primiparous women have higher UtA resistance indices in the earlier postpartum weeks. The UtA impedance reference ranges pre-sented here are likely to be clinically useful in the assessment of postpartum disorders, including retained placental tissue in the uter-ine cavity, which delays the normal involution of uteruter-ine vessels18,35, infection, postpartum bleeding and enhanced myometrial vascular-ity15. Additional studies are necessary to confirm these findings and to further support the use of postpartum UtA Doppler patterns as a prognostic tool.
Methods
This study was approved by the local ethics committee of the Hospital Centre of Porto, Department of Women’s Reproductive Medicine. All of the subjects provided their informed consent (IRB protocol number: 150-13[096-DEFI/122-CES]). The methods were carried out in accordance with the approved guidelines.
From January 2010 to December 2013, a prospective, cross-sectional, observational study was conducted, including 320 healthy women with singleton pregnancies who
gave birth between the 37thand 41stgestational week, either vaginally or by Caesarean
section. Gestational age was calculated by ultrasonography performed between 11 Table 5 | Predicted percentile values for the uterine artery pulsatility (PI) and resistance (RI) indices according to postpartum week; A - not accounting for parity status; B - stratified by parity status
A
PI RI
Weeks 5th 50th 95th 5th 50th 95th
1 0.930 1.225 1.613 0.466 0.589 0.711
2 0.990 1.304 1.717 0.536 0.659 0.781
3 1.104 1.454 1.915 0.595 0.718 0.840
4 1.233 1.624 2.139 0.643 0.766 0.889
5 1.368 1.802 2.373 0.681 0.803 0.926
6 1.508 1.986 2.615 0.707 0.830 0.953
7 1.651 2.174 2.864 0.723 0.846 0.968
8 1.797 2.367 3.117 0.728 0.851 0.973
B
Primiparous Multiparous
Weeks 5th 50th 95th 5th 50th 95th
PI
1 1.008 1.291 1.653 0.889 1.121 1.413
2 1.047 1.341 1.717 0.849 1.071 1.350
3 1.215 1.556 1.992 0.992 1.251 1.578
4 1.384 1.772 2.269 1.166 1.470 1.853
5 1.534 1.965 2.516 1.343 1.693 2.134
6 1.662 2.128 2.725 1.515 1.910 2.408
7 1.767 2.262 2.897 1.677 2.115 2.666
8 1.850 2.369 3.033 1.829 2.306 2.907
RI
1 0.495 0.617 0.738 0.417 0.514 0.612
2 0.565 0.686 0.808 0.501 0.598 0.696
3 0.622 0.744 0.865 0.573 0.670 0.768
4 0.668 0.789 0.911 0.632 0.730 0.828
5 0.701 0.823 0.944 0.680 0.778 0.875
6 0.722 0.844 0.966 0.716 0.814 0.911
7 0.732 0.854 0.975 0.740 0.837 0.935
and 14 weeks, and the participants were consecutively recruited after meeting the eligibility criteria.
Each woman was assessed only once between days 1 and 56 postpartum and was categorised to the respective week to assess a total of 40 women per week. During the postpartum appointments, a senior specialist reviewed the patients’ medical histories and verified the absence of hormonal contraception or intrauterine devices, present or past gynaecological pathology (e.g., fibroids, adnexal pathology or prior gynae-cologic surgery), hypertension, diabetes and other endocrine disorders, immune diseases, renal and structural heart diseases, haematological conditions (with par-ticular emphasis on postpartum haemorrhage) and acute or chronic infections. Current acceptable medications included vitamin and iron supplements; previous administration of prostaglandin E analogues, low-dose oxytocin regimens, and vaginal misoprostol to induce labour in accordance with ACOG Practice Bulletin
N.107 were also acceptable38.
The medical records included each patient’s age, body mass index (BMI), parity, pregnancy outcome, mode of delivery, and haemoglobin level on day 2 postpartum, the child’s birth weight and Apgar score, and whether the mother was breast- or formula-feeding.
Prior to uterine artery Doppler evaluation, we conducted a rigorous transvaginal ultrasound to exclude uterine structural defects, retained placental tissue or adnexal pathology. In the first week after delivery, a transabdominal assessment comple-mented the evaluation to improve the accuracy. In this setting, the presence of fluid
and debris in the uterine cavity was considered to be irrelevant39. Doppler flow studies
were consecutively scheduled until the requirement of 40 measurements per post-partum week was met.
Doppler flow study.UtA Doppler examinations were performed using a Voluson 730 Pro (GE Healthcare Technologies, Milwaukee, WI, USA) with a 5-MHz vaginal probe. Employing a transvaginal transducer (GE Healthcare Probe Type RIC5-9 W, Horizontal Standard EN60601-1), a single experienced operator (LG-M; 6 years of experience in obstetric and gynaecologic ultrasound) made all of the measurements to minimise inter-observer variability. The measurements were made with the women in the lithotomy position and with empty urinary bladders. Smokers and nursing mothers were required to abstain from smoking and breastfeeding for at least 2 h and 30 minutes, respectively, before the procedure.
A sagittal section of the uterus was obtained, and the cervical canal and internal cervical ostium were identified. Subsequently, the transducer was gently tilted from side to side, and then colour flow mapping was used to identify each uterine artery along the side of the cervix and uterus at the level of the internal ostium. Pulsed wave Doppler was used with the sampling gate set at 1–2 mm to cover the entire vessel, and angle correction was used where appropriate to ensure that the angle of insonation
was less than 30u. The PI and RI were measured when three similar consecutive
waveforms were obtained; then, the mean PI and RI of the left and right arteries were calculated (Figure 2). In general, no more than 1 minute was needed to assess both
arteries. We noted the presence or absence of an early bilateral protodiastolic notch, defined as a persistent decrease in blood flow velocity in early diastole below the diastolic peak velocity.
Intra-observer reliability was obtained from two consecutive readings at the
beginning and the end of the scan of the 640 recordings (right UtA 3201left UtA
320) of resistance and pulsatility indices in the uterine arteries. In the present context, there was only a single observer, who was completely unaware of any of the other results.
Efforts to address potential sources of bias.Any postpartum women attended by our clinical investigator during the study protocol were considered to be potentially eligible. The scheduling of postpartum consultations was randomly made by the hospital secretariat according to the availability of the clinical investigator (AC). Patients were consecutively recruited, and ultrasonographic examinations were scheduled so that a total of 40 women were examined per postpartum week. The selection of the participants was achieved by a single investigator who was unaware of the Doppler measurement results. Finally, the researcher responsible for the Doppler measurements had no access to clinical data that was obtained by the investigator responsible for determining patient eligibility.
Statistical analysis.Sample size calculation basically followed Altman & Ohuma
(2013)40and Papageorghiouet al.(2014)41. It was carried out in relation to the
precision and accuracy of a single percentile and regression-based limits, as first
proposed by Royston (1991)42and extended by Bellera & Hanley (2007)43. In 1991,
Royston42provided the following formula for the standard error of apth percentile
from the normal distribution:
SEp~SD
ffiffiffiffiffiffiffiffiffiffiffiffiffiffiffiffiffi
1z1
2Zp2 n
s
ð1Þ
whereSEis the standard error,SDis the standard deviation of the measurements,Zpis
the value of the standard normal distribution corresponding to thepth percentile, and
nis the sample size.
Our aim was to obtain the 5thand the 95threference percentiles, withZ
p51.645. A
cross-sectional study of 320 individuals, with 40 individuals sampled per week, would then provide
SEp~0:186SD ð2Þ
Bearing in mind that the distance between the extreme percentiles is approximately 3.3 SD, the equation above shows that the percentile estimates will be given with great precision.
Bellera & Hanley43showed that the above formula is only valid at the mean
value of the time covariate. Assuming that the postpartum weeks are uniformly distributed, our sample size would provide a relative margin of error (ratio of the width of the confidence interval for the reference limit to the width of the reference range) of approximately 13%, which also seems to be very reasonable. Nevertheless,
as stated by Bellera & Hanley43, whenever heteroscedasticity of PI values across
postpartum time exists, the above formulae should be used as a rough guide for sample size planning.
Intra-class correlation coefficients (ICC) and 95% confidence intervals (CIs) were calculated with a two-way mixed-effects model. The reliability coefficient, which is the difference value that will be exceeded by only 5% of pairs of measurements on the same subject, was calculated as 1.96 times the standard deviation (SD) of the
differ-ence between pairs of repeated measurements19. The chi-square test or Fisher’s test (as
appropriate) was used to compare proportions.
Maternal age, BMI, parity status (primiparous vs multiparous), smoking, mode of delivery (vaginal vs Caesarean section), infant birth weight, breastfeeding, and hae-moglobin on day 2 postpartum were considered potential time-effect confounders. However, adequate adjustment for these variables identified parity as the only stat-istically significant confounder.
Population reference intervals for the crude and parity status-adjusted behaviour of PI and RI during the first eight postpartum weeks were derived from regression
models20. The fitting process utilised generalised least squares, allowing for errors
with unequal variances. Only linear models were considered, occasionally with log-transformed variables, and no polynomials of a degree greater than 3 were used. In fact, these curves can exhibit unrealistic features such as waviness or sharp deviations
at extreme values of the domain20. After removing the outliers (no more than 7 within
each model), the error distribution assessment did not compromise normality. The 5th
(resp. 95th) percentile curve was then given by the regression predicted curve minus
(resp. plus) 1.96 times the residual standard deviation, whereas the 50thpercentile
curve corresponded to the (mean) regression curve. Whenever possible, model comparisons were based on the likelihood ratio test; otherwise, they were based on the Bayesian information criterion (BIC).
The crude (resp. parity adjusted) effect of the postpartum week progression on the UtA-PI was estimated by a nonlinear model that reduced to a quadratic (resp. cubic) polynomial on the log-transformed variables. The crude (resp. parity adjusted) effect of the postpartum week progression on the UtA-RI was estimated by a quadratic polynomial on the original variables. All of the models, except that of the effect of the crude time on UtA-PI, presented different error variances according to the week being considered.
All of the statistical analyses were performed using the R language and software
environment for statistical computation, version 2.12.144. The significance level was
fixed at 0.05.
Our research has adhered to the Strengthening the Reporting of Observational studies in Epidemiology (STROBE) guidelines for observational studies, and all recommendations were included in the study.
1. Tan, S. L., Zaidi, J., Campbell, S., Doyle, P. & Collins, W. Blood flow changes in the
ovarian and uterine arteries during the normal menstrual cycle.Am J Obstet
Gynecol.175, 625–31 (1996).
2. Ziegler, W. F., Bernstein, I., Badger, G., Leavitt, T. & Cerrero, M. L. Regional
hemodynamic adaptation during the menstrual cycle.Obstet Gynecol.94, 695–9
(1999).
3. Cnossen, J. S.et al. Use of uterine artery Doppler ultrasonography to predict
pre-eclampsia and intrauterine growth restriction: a systematic review and bivariable
meta-analysis.CMAJ.178, 701–11 (2008).
4. Li, H., Gudmundsson, S. & Olofsson, P. Uterine artery blood flow velocity
waveforms during uterine contractions.Ultrasound Obstet Gynecol.22, 578–85
(2003).
5. Valentin, M., Ducarme, G., Ceccaldi, P. F., Bougeois, B. & Luton, D. Uterine artery, umbilical, and fetal cerebral Doppler velocities after epidural analgesia
during labor.Int J Gynaecol Obstet.118, 145–8 (2012).
6. Steer, C. V.et al. Transvaginal colour flow imaging of the uterine arteries during
the ovarian and menstrual cycles.Hum Reprod.5, 391–5 (1990).
7. Sladkevicius, P., Valentin, L. & Marsa´l, K. Blood flow velocity in the uterine and
ovarian arteries during the normal menstrual cycle.Ultrasound Obstet Gynecol.3,
199–208 (1993).
8. Go´mez, O.et al. Reference ranges for uterine artery mean pulsatility index at 11–
41 weeks of gestation.Ultrasound Obstet Gynecol.32, 128–32 (2008).
9. Guedes-Martins, L., Saraiva, J., Gaio, R., Macedo, F. & Almeida, H. Uterine artery
impedance at very early clinical pregnancy.Prenat Diagn.34, 719–25 (2014).
10. Prefumo, F., Sebire, N. J. & Thilaganathan, B. Decreased endovascular trophoblast invasion in first trimester pregnancies with high-resistance uterine artery Doppler
indices.Hum Reprod.19, 206–9 (2004).
11. Zalel, Y., Gamzu, R., Lidor, A., Goldenberg, M. & Achiron, R. Color Doppler imaging in the sonohysterographic diagnosis of residual trophoblastic tissue.
J Clin Ultrasound.30, 222–5 (2002).
12. Mulic-Lutvica, A., Eurenius, K. & Axelsson, O. Uterine artery Doppler ultrasound
in postpartum women with retained placental tissue.Acta Obstet Gynecol Scand.
88, 724–8 (2009).
13. Mulic-Lutvica, A., Eurenius, K. & Axelsson, O. Longitudinal study of Doppler flow
resistance indices of the uterine arteries after normal vaginal delivery.Acta Obstet
Gynecol Scand.86, 1207–14 (2007).
14. Weydert, J. A. & Benda, J. A. Subinvolution of the placental site as an anatomic
cause of postpartum uterine bleeding: a review.Arch Pathol Lab Med.130,
1538–42 (2006).
15. Van Schoubroeck, D.et al. Prospective evaluation of blood flow in the
myometrium and uterine arteries in the puerperium.Ultrasound Obstet Gynecol.
23, 378–81 (2004).
16. Morris, R.et al. Maternal hemodynamics by thoracic impedance cardiography for
normal pregnancy and the postpartum period.Obstet Gynecol.123, 318–24
(2014).
17. Mabie, W. C., DiSessa, T. G., Crocker, L. G., Sibai, B. M. & Arheart, K. L. A
longitudinal study of cardiac output in normal human pregnancy.Am J Obstet
Gynecol.170, 849–56 (1994).
18. Andrew, A., Bulmer, J. N., Morrison, L., Wells, M. & Buckley, C. H. Subinvolution
of the uteroplacental arteries: an immunohistochemical study.Int J Gynecol
Pathol.12, 28–33 (1993).
19. Bland, J. M. & Altman, D. G. Applying the right statistics: analyses of
measurement studies.Ultrasound Obstet Gynecol.22, 85–93 (2003).
20. Royston, P. & Wright, E. M. How to construct ‘normal ranges’ for fetal variables.
Ultrasound Obstet Gynecol.11, 30–8 (1998).
21. Walter, S. D., Eliasziw, M. & Donner, A. Sample size and optimal designs for
reliability studies.Stat Med.17, 101–10 (1998).
22. Hynek, M. Approaches for Constructing Age-Related Reference Intervals and
Centile Charts for Fetal Size.Eur J Biomed Inform.6, 43–52 (2010).
23. Cole, T. J. & Green, P. J. Smoothing reference centile curves: the LMS method and
penalized likelihood.Stat Med.11, 1305–19 (1992).
24. Healy, M. J., Rasbash, J. & Yang, M. Distribution-free estimation of age-related
centiles.Ann Hum Biol.15, 17–22 (1988).
25. Papageorghiou, A. T., To, M. S., Yu, C. K. & Nicolaides, K. H. Repeatability of measurement of uterine artery pulsatility index using transvaginal color Doppler.
Ultrasound Obstet Gynecol.18, 456–9 (2001).
26. Jaffa, A. J., Weissman, A., Har-Toov, J., Shoham, Z. & Peyser, R. M. Flow velocity waveforms of the uterine artery in pregnancy: transvaginal versus transabdominal
approach.Gynecol Obstet Invest.40, 80–3 (1995).
27. Tekay, A. & Jouppila, P. A longitudinal Doppler ultrasonographic assessment of the alterations in peripheral vascular resistance of uterine arteries and
ultrasonographic findings of the involuting uterus during the puerperium.Am J
28. Kirkinen, P., Dudenhausen, J., Baumann, H., Huch, A. & Huch, R. Postpartum
blood flow velocity waveforms of the uterine arteries.J Reprod Med33, 745–8
(1988).
29. Baumann, H.et al. Blood flow velocity waveforms in large maternal and uterine
vessels throughout pregnancy and postpartum: a longitudinal study using Duplex
sonography.Br J Obstet Gynaecol.95, 1282–91 (1988).
30. Long, M. G., Boultbee, J. E., Hanson, M. E. & Begent, R. H. Doppler time velocity
waveform studies of the uterine artery and uterus.Br J Obstet Gynaecol.96,
588–93 (1989).
31. Everett, T. R. & Lees, C. C. Beyond the placental bed: placental and systemic
determinants of the uterine artery Doppler waveform.Placenta33, 893–901
(2012).
32. Nakai, Y.et al. Uterine blood flow velocity waveforms during early postpartum
course following caesarean section.Eur J Obstet Gynecol Reprod Biol.74, 121–4
(1997).
33. Diniz, C. P., Araujo-Ju´nior, E., Lima, M. M., Guazelli, C. A. & Moron, A. F. Ultrasound and Doppler assessment of uterus during puerperium after normal
delivery.J Matern Fetal Neonatal Med.(2014) [Epub ahead of print].
34. Brosens, J. J., Parker, M. G., McIndoe, A., Pijnenborg, R. & Brosens, I. A. A role for
menstruation in preconditioning the uterus for successful pregnancy.Am J Obstet
Gynecol.200, 615.e1–6 (2009).
35. Khong, T. Y., Adema, E. D. & Erwich, J. J. On an anatomical basis for the increase
in birth weight in second and subsequent born children.Placenta.24, 348–53
(2003).
36. Altman, D. G. & Chitty, L. S. Charts of fetal size: 1. Methodology.Br J Obstet
Gynaecol.101, 29–34 (1994).
37. Silverwood, R. J. & Cole, T. J. Statistical methods for constructing gestational
age-related reference intervals and centile charts for fetal size.Ultrasound Obstet
Gynecol.29, 6–13 (2007).
38. ACOG Committee on Practice Bulletins -- Obstetrics. ACOG Practice Bulletin
No.107: Induction of labor.Obstet Gynecol.114, 386–97 (2009).
39. Mulic-Lutvica, A., Bekuretsion, M., Bakos, O. & Axelsson, O. Ultrasonic evaluation of the uterus and uterine cavity after normal, vaginal delivery.
Ultrasound Obstet Gynecol.18, 491–8 (2001).
40. Altman, D. G. & Ohuma, E. O. International Fetal and Newborn Growth Consortium for the 21st Century. Statistical considerations for the development of prescriptive fetal and newborn growth standards in the INTERGROWTH-21st
Project.BJOG.120 Suppl 2, 71–6 (2013).
41. Papageorghiou, A. T.et al. International Fetal and Newborn Growth Consortium
for the 21st Century (INTERGROWTH-21st). International standards for fetal
growth based on serial ultrasound measurements: the Fetal Growth Longitudinal
Study of the INTERGROWTH-21st Project.Lancet.384, 869–79 (2014).
42. Royston, P. Constructing time-specific reference ranges.Stat Med.10, 675–90
(1991).
43. Bellera, C. A. & Hanley, J. A. A method is presented to plan the required sample
size when estimating regression-based reference limits.J Clin Epidemiol.60,
610–5 (2007).
44. R Development Core Team. R: A language and environment for statistical computing. R Foundation for Statistical Computing, Vienna, Austria. http://www. R-project.org/ [12 March 2013] (2010).
Acknowledgments
We are grateful to the staff of the Department of Obstetrics of Centro Hospitalar do Porto. The second author was partially funded by the European Regional Development Fund through the COMPETE program and by the Portuguese Government through the FCT -Fundaça˜o para a Cieˆncia e a Tecnologia - under the project PEst-C/MAT/UI0144/2013.
Author contributions
L.G.-M. designed the study, performed all Doppler measurements, analysed the data, and wrote the manuscript. A.R.G. performed all statistical analyses. J.S. contributed to the critical revision of the manuscript. A.C. coordinated the review of clinical cases. F.M. designed the study. H.A. designed the study, analysed the data, and wrote the manuscript. All authors contributed to the data interpretation and the final version of the manuscript, which all approved. All authors read and approved the final manuscript.
Additional information
Competing financial interests:The authors declare no competing financial interests.
How to cite this article:Guedes-Martins, L.et al. Uterine artery impedance during the first eight postpartum weeks.Sci. Rep.5, 8786; DOI:10.1038/srep08786 (2015).