Long-term outcomes of elderly kidney transplant recipients
Authors
Paula Ferreira Orlandi1 Marina Pontello Cristelli1 Carolina Araujo Rodrigues Aldworth1
Taina Veras de Sandes Freitas1
Claudia Rosso Felipe1
Helio Tedesco Silva Junior1 Jose Osmar Medina de Abreu Pestana1
1 Hospital do Rim.
Submitted on: 10/22/2014. Approved on: 01/12/2015.
Correspondence to: Paula Ferreira Orlandi.
Disciplina de Nefrologia - UNIFESP (Universidade Federal de São Paulo).
Hospital do Rim.
Rua Borges Lagoa, nº 960, 11º andar Vila Clementino, São Paulo, Brasil.
CEP: 04036-002.
E-mail: [email protected]
I
NTRODUCTIONKidney transplantation is currently the best available treatment for end-stage chronic kidney failure (CKF).1,2 In developed countries, besides providing a better quality of life, it also enables a higher survival than what is offered by other forms of renal replacement therapy, at a Introduction: The number of elderly
patients with chronic kidney disease increases progressively, challenging the allocation algorithms in a scenario of organ shortage for transplantation.
Objective: To evaluate the impact
of age on patient and graft survival.
Methods: Evolution of all 366 patients
greater than 60 years transplanted between 1998 and 2010 was analyzed
versus a control group of 366 younger patients matched for gender, type of donor (living or deceased) and year of transplantation. Results: Diabetes mellitus (HR 1.8; IC 1.2-2.6; p = 0,003) and prioritization (HR 2.9; IC 1.2-2.6; p < 0,001), but not age, were independent factors for kidney graft loss. Conclusion: Advanced age was
not related to negative outcomes after kidney transplantation, after excluding recipient death as a cause of allograft loss. Higher mortality rate in this group was associated to a higher frequency of comorbidities, especially diabetes mellitus.
ABSTRACT
Keywords: aged; graft survival; kidney
transplantation; long-term effect; risk factors; survival analysis.
lower cost.3-5 These advantages can also be found even among recipients aged over 60 years, regardless of donor characteristics.6
In Brazil, only a few seniors are benefiting from this treatment as of yet, to the detriment of the large share of this population among patients with chronic renal failure. For example, in 2009, about 40% of the more than 50,000 dialysis patients were older than 60 years.7 However, that same year, only 10.8% of newly enlisted patients on the waiting list for transplant were senior citizens, despite this figure increasing 10 times since 1999.8 Finally, at the Kidney Hospital (HRIM), responsible for 20% of all kidney transplants performed in the country in the same year, only 12.5% of these transplants were allocated to this age range.9 As more recent data shows,7 it is estimated that the number of dialysis patients reached 100,000 in 2013, being 30% the number of patients over age 65 in the last three years, during which period the population enrolled for transplantation in the same age range remained below 15%.8
But there is not yet enough information to justify this conservative approach to treatment of renal failure in these individuals, whom, in a way, are being deprived of this possibility, despite the universal coverage system currently in force in Brazil vis-à-vis organs distribution.
The aim of the study was to compare the clinical and surgical evolution of elderly patients versus controls. Follow up losses
were counted out on the last day of follow up recording. Graft loss was defined as return to dialysis or retransplantation.
M
ETHODSThis is a retrospective cohort study, from a single center, which included elderly patients (defined as 60 years of age or older) who underwent renal transplantation between 1998 and 2010. We excluded second transplant recipients. For comparative analysis, we made up a control group, with patients older than 18 and less than 60 years of age, matched 1: 1 by gender, year of transplantation and type of donor (living/deceased). Information was obtained through review of medical records, after approval by the local Ethics Committee in Research.
STATISTICALANALYSIS
Continuous variables were presented as mean and standard deviation, and the categorical variables as absolute frequency and percentage. The comparative analysis between two groups was estimated using the unpaired Student t-test for continuous variables and the Pearson’s Chi-square test or Fisher’s exact test for the categorical variables. Survival curves were obtained using the Kaplan-Meier method, and comparisons we made using the log-rank test. Logistic regression analysis was used to identify the magnitude of risk factors influence on patient and graft survival suppressing deceased patients and to estimate the relative risk for variables of
interest. To create the multivariate analysis, we used the Cox regression technique, based on 95% confidence intervals. The model included all variables considered for clinical and epidemiological importance according to their statistical significance obtained in the univariate Cox analysis for each outcome evaluated. Continuous variables were categorized for this analysis. The statistical analysis was performed using the SPSS v.22 software (SPSS inc., Chicago, IL, USA). For all statistical tests, we used a 5% significance level.
R
ESULTSDuring the study period there were about 8,500 transplants carried out at the Kidney Hospital (Hrim). Of these, 376 patients had more than 60 years of age and were followed-up in an outpatient basis at the Public Health Care System (SUS). Among these, 10 were re-transplanted and thus excluded. After pairing with the control group, we had a total sample of 732 patients. Minimum follow-up was 1 day, maximum of 10 years with an average of 5 years (1876 days).
DEMOGRAPHICS
The two groups were compared for the various demographic variables, as per depicted on Table 1. The older group had a higher frequency of diabetes mellitus as a cause of kidney failure (26% vs. 12%, p < 0.001), a higher percentage of patients were prioritized for lack of vascular access (5.7% vs. 2.5%,
p = 0.025), there was higher percentage of
women with at least one pregnancy prior to transplantation (87% vs. 72%, p = 0.005) and a higher mean HLA mismatches vis-à-vis the donor (3.1 vs. 2.6, p = 0.001).
TABLE 1 DEMOGRAPHICS FROM 732 PATIENTS, SEPARATED BETWEEN ELDERLY AND CONTROLS
Elderly Controls p
Number of Patients 366 366
Age, years ± DP (min-max) 64 ± 3.6 (60-78) 43 ± 10.4 (18-59)
Skin color - black, n (%) 40 (10.9) 38 (10.6) 0.464
Male gender, n (%) 250 (68.3) 251 (68.5) 0.937
Kidney failure cause, n (%)
Diabetes mellitus 95 (26) 44 (12)
< 0.001
Polycystic kidney disease 40 (10.9) 25 (6.9)
Chronic Glomerulonephritis 21 (5.7) 56 (15.3)
Hypertension 49 (13.4) 41 (11.2)
Undetermined 108 (29.5) 160 (43.7)
Diabetes mellitus and Hypertension 16 (4.4) 6 (1.6)
Urological cause 21 (5.7) 23 (6.3)
Others 16 (4.4) 11 (3.0)
Pre-transplant hemodialysis, n (%) 330 (90.2) 333 (91) 0.606
Time in dialysis, months ± SD 50.7 ± 36.1 49.23 ± 39 0.597
Prioritization, n (%) 21 (5.7) 9 (2.5) 0.025
CMV-negative serology, n (%) 18 (4.9) 26 (7.1) 0.345
Women with ≥ 1 pregnancy, n (%) 101 (87) 83 (72) 0.005
Patients with ≥ 1 transfusion, n (%) 217 (59.3) 230 (62.8) 0.324
Total Panel ± SD 8.5 ± 20.2 7.6 ± 19 0.567
Mismatches ± SD 3.1 ± 2 2.6 ± 1.7 0.001
Donor type (live), n (%) 91 (24.9) 101 (27.6) 0.401
Donor age ± SD 45.6 ± 14 42.8 ± 13 0.005
Deceased donor – expanded criterion, n (%) 74 (26.9) 60 (22.7) 0.434
Time cold ischemia, hours ± SD 23.2 ± 6.01 23.55 ± 6.6 0.576
Graft Delayed Function, n (%) 167 (45.6) 132 (36.1) 0.008
Duration, days ± SD 5.79 ± 11 4.2 ± 8.3 0.036
Induction with Thymoglobulin, n (%) 32 (8.7) 34 (9.3) 0.469
Initial immunosuppression (FK Pred MF), n (%) 139 (38) 125 (34.2) 0.577
Surgical technique (Gregoir), n (%) 204 (56.4) 264 (72.5) < 0.001 Hospital stay (days), days ± SD 17.5 (18.5) 13.6 (11.7) 0.001 SD: Standard deviation; FK: Tacrolimus; Pred: Prednisone; MF: Micophenolate.
SURVIVALANALYSIS
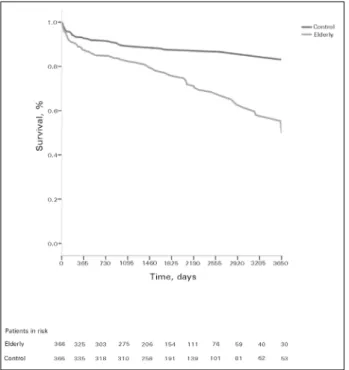
Patient survival was lower in the elderly group, in five years (76.6 vs. 87.7%, p = 0.001) and in ten
years (54.8 vs. 84.3%, p < 0.001, Figure 1). The overall graft survival was 52.9% among the elderly and 72.2% among the controls at 5 years of follow-up (p≤ 0.001); and 39.6% among the elderly and
66.9% among controls after 10 years (p < 0.001,
Figure 2). However, survival was similar between the two groups, in five years (86.6 vs. 75.6% vs.
86.3%, p = 0.782) and after ten years of follow-up
Death with a functioning graft was the main cause of graft loss among the elderly population, accounting for 65% of these. This was also the most common cause of graft loss in the control group, but at a significantly lower frequency (44%,
p = 0.023). Among the other causes of graft loss,
Figure 1. Actuarial patient survival, according to groups: elderly versus control, by the Kaplan-Meier method. Patient survival was lower in the Elderly Group, in five years (76.6 vs. 87.7%. p = 0.001) and in ten years (54.8 vs. 84.3%. p < 0.001).
Figure 2. Kidney graft actuarial survival, according to groups Elderly versus Control, by the Kaplan-Meier method. The grafts global survival was 52.9% among the elderly and 72.2% among controls in 5 years of follow up (p ≤ 0.001), and 39.6% among the elderly and 66.9% among controls after 10 years (p < 0.001).
Figure 3. Kidney graft actuarial survival suppressing deceased patients, according to Groups: Elderly versus control, by the Kaplan-Meier method. Kidney graft survival suppressing deceased patients was similar between the two groups in five years (86.6 vs.75.6% vs. 86.3%, p = 0.782) as well as after ten years of follow up (76.1% vs. 81.1%, vs. 73.8% p = 0.888).
TABLE 2 CAUSES OF KIDNEY GRAFT LOSS AND PATIENT
DEATH, BROKEN DOWN AMONG THE ELDERLY AND CONTROL GROUPS
Elderly Controle Total p
Causes of kidney graft loss
Death 87 (65.2) 38 (43.7) 125 (56.8)
0.023 Graft chronic
nephropathy 14 (10.5) 14 (16.1) 28 (12.7)
Primary non
function 13 (9.8) 10 (11.5) 23 (10.5)
Acute
rejection 9 (6.8) 11 (12.6) 20 (9.1)
Others 10 (7.5) 14 (16.1) 24 (10.9)
Total 133 (100) 87 (100) 220 (100) Causes of
patient death
Infection 50 (51.5) 26 (57.8) 76 (53.5)
0.652 Cardiovascular 26 (26.8) 8 (17.8) 34 (23.9) Neoplasia 7 (7.2) 2 (4.4) 9 (6.4)
Others 8 (8.2) 6 (13.3) 14 (9.9)
Unknown 6 (6.3) 3 (6.7) 9 (6.3)
Total 97 (100) 45 (100) 142 (100) SURGICALCOMPLICATIONSANDCLINICS
group (56.4 vs. 72.5%, p < 0.001, Table 1). This group had a higher frequency of surgical complications - individuals with at least one complication (34.7% vs. 23.2%, p = 0.001) -
among which the following were different when analyzed separately: surgical wound dehiscence (12 3 vs. 4.4%, p < 0.001), urinary fistula (6.0
vs. 2.7%, p = 0.030), incisional hernia (3.0 vs.
0.8%, p = 0.031) and dilated bladder (6.8 vs.
2.2%, p = 0.002, Table 3).
TABLE 3 SURGICAL COMPLICATIONS AFTER THE KIDNEY
TRANSPLANT, ACCORDING TO GROUP: ELDERLY AND CONTROL
Elderly (N = 366)
Control (N = 366) p Dehiscence, n (%) 45 (12.3) 16 (4.4) < 0.001
Lymphocele, n (%) 14 (3.8) 13 (3.8) 0.845
Fistula, n (%) 22 (6.0) 10 (2.7) 0.030 Hematoma, n (%) 12 (3.3) 9 (2.5) 0.507
Hernia, n (%) 11 (3) 3 (0.8) 0.031
Dilated bladder, n (%) 25 (6.8) 8 (2.2) 0.002
Renal artery stenosis,
n (%) 18 (4.9) 20 (5.5) 0.739
Rupture, n (%) 3 (0.8) 3 (0.8) 1.0
Thrombosis, n (%) 8 (2.2) 9 (2.5) 0.806
Graft removal, n (%) 19 (5.2) 20 (5.5) 0.869 Urethral stenosis, n
(%) 5 (1.4) 1 (0.3) 0.101
Total (patients with some complication), n (%)
127
(34.7) 85 (23.2) 0.001
Induction frequency and the initial immunosup-pressive regimen were evenly distributed between the two groups. The elderly had a higher incidence and longer duration of delayed renal graft func-tion (45.6 vs. 36.1%, p = 0.008; 5.8 vs. 4.2 days, p = 0.036), and longer hospital stay (17.5 vs. 13.6 days, p = 0.001; Table 1). The incidence of acute rejection was similar between the two groups (24.6
vs. 29.5%, p = 0.134). During the follow-up
pe-riod, the elderly had higher frequency of readmis-sions (77.3 vs. 70.5%, p = 0.035), cardiovascular events (12.3 vs. 3.8%, p < 0.001) and neoplasms (6.8 vs. 1.6%, p < 0.001, Table 4). On the other hand, immunosuppressive regimen tolerability, as assessed by the need for replacing at least one of
TABLE 4 CLINICAL COMPLICATIONS AFTER THE
TRANSPLANT, BROKEN DOWN ACCORDING TO THE GROUP: ELDERLY AND CONTROL
Elderly Control p Acute rejection, n (%) 90 (24.6) 108 (29.5) 0.134
Cardiovascular
event, n (%) 45 (12.3) 14 (3.8)
< 0.001
Post-transplant
diabetes, n (%) 25 (28) 75 (23.3) 0.186
Neoplasia, n (%) 25 (6.8) 6 (1.6) < 0.001 Re-hospitalization,
n (%) 283 (77.3) 258 (70.5) 0.035
Graft loss, n (%) 133 (36.33) 87 (23.8) 0.001
Patient death, n (%) 97 (26.5) 45 (12.3) < 0.001
Loss of follow-up,
n (%) 18 (4.9) 27 (7.4) 0.166
Immunosuppression
replacement, n (%) 105 (28.7) 89 (24.3) 0.180
the drugs, was similar between both groups (28.7
vs. 24.3%, p = 0.180, Table 4).
In a multivariate analysis (Tables 5, 6 and 7), age greater than 60 years among recipients was independently associated with a higher death risk (HR 2.191; CI 1.523 to 3.150; p < 0.001), as well as type of deceased donor (HR 1.724; CI 1.211 to 2.651; p = 0.013) and diabetes mellitus as a cause
of renal failure (HR 1.507; CI 1.038 to 2.189; p = 0.031). Regarding the risk of loss of renal graft, the variables that affected this outcome were: diabetes mellitus as a cause of renal failure (HR 1.76; CI 1.205 to 2.570; p = 0.003) and transplantation
prioritization due to difficulties in vascular access (HR 2.89, CI 1.205 to 2.570; p < 0.001). Black ethnicity (HR 2.16; CI 1.190 to 3.926; p = 0.011), negative serology for pre-transplant cytomegalovirus (HR 2.04; CI 1.053 to 3.961; p = 0.035) and length
of stay greater than 10 days (HR 1.85, CI 1,232- 2,779; p = 0.003) were independent risk factors for acute rejection.
D
ISCUSSIONTABLE 5 COX HAZARD RATIO ANALYSIS FOR ACUTE REJECTION (95% CONFIDENCE INTERVAL)
Univariate
p Multivariate p
HR CI HR CI
Black skin color 1.534 1.034-2.275 0.033 2.161 1.190-3.926 0.011
Negative CMV 1.872 1.177-2.970 0.009 2.043 1.053-3.961 0.035
Graft delayed function (NTA) 1.879 1.421-2.485 < 0.001 NS
NTA greater than 10 days 1.751 1.194-2.568 0.004 NS
Hospital stay longer than 10 days 2.764 2.025-3.774 < 0.001 1.85 1.232-2.779 0.003
TABLE 6 COX HAZARD RATIO ANALYSIS FOR GRAFT LOSS (95% CONFIDENCE INTERNVAL)
Univariate
p Multivariate p
HR CI HR CI
Age 1.696 1.294-2.224 < 0.001 NS
CKF caused by diabetes 1.866 1.392-2.501 < 0.001 1.76 1.205-2.570 0.003
Prioritization 2.238 1.322-3.788 0.746 2.891 1.205-2.570 < 0.001
Transfusion 1.383 1.037-1.845 0.027 NS
Deceased donor 1.825 1.303-2.556 < 0.001 NS
Thymus globulin 1.593 1.062-2.390 0.024 NS
Graft delayed function (NTA) 2.208 1.689-2.885 < 0.001 NS
NTA greater than 10 days 1.438 1.006-2.055 0.046 NS
More than 10 days of hospital stay 1.937 1.460-2.570 < 0.001 NS
TABLE 7 COX HAZARD RATIO ANALYSIS FOR DEATH (95% CONFIDENCE INTERVAL)
Univariate
p Multivariate p
HR CI HR CI
Age 2.426 1.702-3.459 < 0.001 2.25 1.688-3.437 < 0.001
More than 36 months on HD 1.528 1.089-2.144 0.014 NS
CKF caused by Diabetes 1.863 1.298-2.674 0.001 NS
Deceased donor 1.81 1.186-2.761 0.006 NS
Delayed graft function (NTA) 2.033 1.458-2.833 < 0.001 1.914 1.368-2.679 < 0.001
More than 10 days of hospital stay 1.502 1.066-2.116 0.02 NS
year-follow-up period. The patient’s death was responsible for the significant difference between the overall patient and graft survival curves. However, old age does not constitute an independent factor for allograft poor survival, as shown in graft survival curves suppressing deceased patients (similar to the elderly and non-elderly) and in multivariate analysis (not decisive age for graft loss).
In this study, transplant half-life in the elderly group was 8.2 years, while in the control group was longer than 10 years. This result is similar to that found in large survey of the US transplanted population during the same period of time: 8 to 8.8 years between 2000-2005.10
As for graft survival suppressing deceased patients, studies with smaller populations or with shorter follow-up period also demonstrated the similarity of evolution between youth and elderly groups11 and, in some cases, higher for the elderly.12,13 Probably, as noted in this study, other causes of loss, such as acute rejection and chronic graft nephropathy, most frequently in the younger group, offset the effect of death on graft survival in the elderly group.
Apart from age, diabetes as a cause of renal failure and the type of deceased donor were independent risk factors for patient death (Figures 4 and 5). Between these two factors, diabetes mellitus
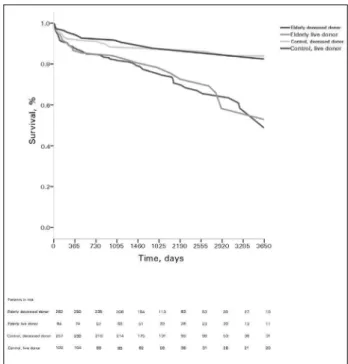
Figure 5. Patient actuarial survival according to the subgroups:: elderly with deceased donor, elderly with live donor, control with deceased donor, control with live donor; by the Kaplan-Meier method- elderly patient survival after 5 years of evolution was similar to that of the deceased donor (75.3%) or live (78.3%); however, lower than the patients in the control group as a deceased donor (87,6%) or live (87.7%) (p < 0.006).
Figure 4. Patient actuarial survival according to the subgroups: diabetic elderly, non-diabetic elderly, diabetic control, non-diabetic control; by the Kaplan-Meier method – Survival of the non-diabetic elderly patient (78.6%) was similar to the diabetic control (78.4%) after 5 years of progression. In comparing the four groups (diabetic elderly 70.3%; non-diabetic control 89%); there was a significant difference (p < 0.001).
elderly patients. By dividing our sample into four distinct subgroups by age and diabetes as cause of renal failure (Figure 4), we note the survival similarity between non-diabetic elderly patients and diabetic youths after 5 years of progression, confirming the importance of such comorbidity in poor patient outcome. After 5 years, we no longer have similarities between the two curves in this sample, which can be related to the small number of patients remaining after this period.
Regarding graft survival, the determining factors for this outcome were prioritization for vascular access, difficulties for dialysis and
diabetes mellitus as a cause of kidney failure. Both factors were found more frequently among elderly recipients (prioritization 5.7 vs. 2.5%, p =
0.025; diabetes mellitus 26 vs. 12%, p < 0.001). This finding confirms the importance of diabetes as a decisive clinical condition in transplant outcome.
Unlike studies in which acute rejection has decisive influence on graft long-term survival,14,15 we did not find this correlation in our data. It is noteworthy that we considered all clinical events
that determined treatment for acute rejection, regardless of histological confirmation and, in addition, we considered only the first episode, 72% of which occurred in the first six months after transplantation. As shown in previous studies, the occurrence of early rejection episodes and response to therapy might explain the little clinical significance of this event.16
There were more postoperative complications (dehiscence, fistula, hernia and dilated bladder) among the elderly and also differences in surgical technique: 72% of young people were submitted to the conventional technique (Lich-Gregoir); while only 56% of the elderly were subjected to this technique. In other studies,17-19 the frequency of urologic complications varies from 1.8 to 20.8%, and is mainly related to being a male recipient from a deceased donor - characteristics for which there were no differences in the groups.
recent meta-analysis shows the association between the conventional technique and lower risk of urinary fistula, as we found here.20 It is possible that the higher number of surgical complications has influenced length of stay, making it higher for the elderly group, 17. 5 days on average against 13.6 days among the younger patients (p < 0.001), which increases cost and risk for the pacient.21,22 Thus, it is possible that a regular preoperative urological evaluation would specifically benefit the elderly group.
The overall incidence of at least one episode of acute rejection in this population was 27% in 10 years. Risk factors independently associated with this outcome in multivariate analysis were black ethnicity, negative serology for CMV and length of stay greater than 10 days, characteristics for which the elderly and control groups were similar. Despite the tendency to lower incidence of rejection among elderly patients in other studies,12,23,24 there was no significant difference in our sample. However, for risk factors traditionally associated with acute rejection, such as pregnancy, mismatches and delayed graft function, the elderly group was more exposed. It is possible that a larger sample would be needed to guide conclusions accordingly.
In our study, the incidence of post-transplant cardiovascular events was three fold higher among the elderly. We believe that diabetes - the most common cause of CKF in this group when compared to young patients, has been one of the factors responsible for this poor outcome; moreover, unconventional factors associated with coronary inflammation and calcification, such as longer time on dialysis, may have accounted for the higher frequency of coronary events in this group. Among the elderly, 26 deaths (26.8%) were caused by cardiovascular disease while there were only eight (17.8%) of the control patients who died from this cause.
The overall frequency of malignancies was 4.23%. Among the elderly, tumors were four times more frequent in the younger age group, and, moreover, caused twice as many deaths. Possible mechanisms associated with increased
incidence of cancer in the elderly include the time required for carcinogenesis, increased tissue exposure to environmental carcinogens and imunoscenescense.25
As in other retrospective studies of database analysis, the reliability of available data in the medical records or even their lack thereof, limits the scope of the results. Second, the fact that the study comes from a single center limits the extrapolation of the results to other populations.
In conclusion, this retrospective cohort from a single center, advanced age per se, ruling out patient’s death as a cause of graft loss, did not represent an independent factor of poor prognosis of renal transplantation in the long term when compared to a younger population, matched by donor type, immunosuppression and year of transplant. However, the higher prevalence of diabetes mellitus was a determining factor of higher mortality among this group, determining worse results in terms of overall survival.
R
EFERENCES1. Wolfe RA, Ashby VB, Milford EL, Ojo AO, Ettenger RE, Ago-doa LY, et al. Comparison of mortality in all patients on dialy-sis, patients on dialysis awaiting transplantation, and recipients of a first cadaveric transplant. N Engl J Med 1999;341:1725-30. PMID: 10580071 DOI:http://dx.doi.org/10.1056/ NEJM199912023412303
2. Ojo AO, Hanson JA, Meier-Kriesche H, Okechukwu CN, Wolfe RA, Leichtman AB, et al. Survival in recipients of marginal cada-veric donor kidneys compared with other recipients and wait-lis-ted transplant candidates. J Am Soc Nephrol 2001;12:589-97. 3. Cornella C, Brustia M, Lazzarich E, Cofano F, Ceruso A, Barbé
MC, et al. Quality of life in renal transplant patients over 60 years of age. Transplant Proc 2008;40:1865-6. PMID: 18675072 DOI:http://dx.doi.org/10.1016/j.transproceed.2008.05.050 4. Rebollo P, Ortega F, Baltar JM, Alvarez-Ude F, Alvarez
Na-vascués R, Alvarez-Grande J. Is the loss of health-related qua-lity of life during renal replacement therapy lower in elderly patients than in younger patients? Nephrol Dial Transplant 2001;16:1675-80.
5. Lumsdaine JA, Wray A, Power MJ, Jamieson NV, Akyol M, Andrew Bradley J, et al. Higher quality of life in living do-nor kidney transplantation: prospective cohort study. Transpl Int 2005;18:975-80. DOI: http://dx.doi.org/10.1111/j.1432-2277.2005.00175.x
6. Merion RM, Ashby VB, Wolfe RA, Distant DA, Hulbert--Shearon TE, Metzger RA, et al. Deceased-donor characteris-tics and the survival benefit of kidney transplantation. JAMA 2005;294:2726-33. PMID: 16333008 DOI: http://dx.doi. org/10.1001/jama.294.21.2726
8. São Paulo. Secretária da Saúde do Estado de São Paulo. Re-latórios de Estatística Geral do Receptor da Central Estadual de Transplantes da Secretaria da Saúde do Estado de São Pau-lo [Acesso 20 Mar 2015]. Disponível em: http://www.saude. sp.gov.br/transplante
9. Registro Brasileiro de Transplantes: Ano XV, Número 4, janei-ro/dezembro de 2009. Homepage da Associação Brasileira de Transplante de Órgãos (ABTO) [Acesso 20 Mar 2015]. Dispo-nível em: http://www.abto.org.br
10. Lamb KE, Lodhi S, Meier-Kriesche HU. Long-term renal allo-graft survival in the United States: a critical reappraisal. Am J Transplant 2011;11:450-62. DOI: http://dx.doi.org/10.1111/ j.1600-6143.2010.03283.x
11. Doyle SE, Matas AJ, Gillingham K, Rosenberg ME. Predicting clinical outcome in the elderly renal transplant recipient. Kid-ney Int 2000;57:2144-50. PMID: 10792636 DOI:http://dx.doi. org/10.1046/j.1523-1755.2000.00066.x
12. Faravardeh A, Eickhoff M, Jackson S, Spong R, Kukla A, Issa N, et al. Predictors of graft failure and death in elderly kidney transplant recipients. Transplantation 2013;96:1089-96. PMID:24056622 DOI: http://dx.doi.org/10.1097/ TP.0b013e3182a688e5
13. Mendonça HM, Dos Reis MA, de Castro de Cintra Sesso R, Câmara NO, Pacheco-Silva A. Renal transplantation outco-mes: a comparative analysis between elderly and younger re-cipients. Clin Transplant 2007;21:755-60. DOI: http://dx.doi. org/10.1111/j.1399-0012.2007.00734.x
14. Ferguson R. Acute rejection episodes-best predictor of long--term primary cadaveric renal transplant survival. Clin Trans-plant 1994;8:328-31.
15. Pirsch JD, Ploeg RJ, Gange S, D'Alessandro AM, Knechtle SJ, Sollinger HW, et al. Determinants of graft survival af-ter renal transplantation. Transplantation 1996;61:1581-6. PMID:8669101 DOI: http://dx.doi.org/10.1097/00007890-199606150-00006
16. Meier-Kriesche HU, Schold JD, Srinivas TR, Kaplan B. Lack of improvement in renal allograft survival despite a marked decrease in acute rejection rates over the most recent era. Am J Transplant 2004;4:378-83. DOI: http://dx.doi.org/10.1111/ j.1600-6143.2004.00332.x
17. Hau HM, Tautenhahn HM, Schmelzle M, Krenzien F, Schoen-berg MB, Morgul MH, et al. Management of urologic com-plications in renal transplantation: a single-center experien-ce. Transplant Proc 2014;46:1332-9. DOI: http://dx.doi. org/10.1016/j.transproceed.2014.04.002
18. Praz V, Leisinger HJ, Pascual M, Jichlinski P. Urologi-cal complications in renal transplantation from cadave-ric donor grafts: a retrospective analysis of 20 years. Urol Int 2005;75:144-9. PMID:16123569 DOI: http://dx.doi. org/10.1159/000087169
19. Slagt IK, Ijzermans JN, Visser LJ, Weimar W, Roodnat JI, Terkivatan T. Independent risk factors for urological com-plications after deceased donor kidney transplantation. PLoS One 2014;9:e91211. DOI: http://dx.doi.org/10.1371/journal. pone.0091211
20. Alberts VP, Idu MM, Legemate DA, Laguna Pes MP, Minnee RC. Ureterovesical anastomotic techniques for kidney trans-plantation: a systematic review and meta-analyses. Transpl Int 2014;27:593-605. DOI: http://dx.doi.org/10.1111/tri.12301 21. Villa M, Siskind E, Sameyah E, Alex A, Blum M, Tyrell R, et
al. Shortened length of stay improves financial outcomes in li-ving donor kidney transplantation. Int J Angiol 2013;22:101-4. DOI: http://dx.doi.org/10.1055/s-0033-1334139
22. Naderi M, Aslani J, Hashemi M, Assari S, Amini M, Pourfar-ziani V. Prolonged rehospitalizations following renal trans-plantation: causes, risk factors, and outcomes. Transplant Proc 2007;39:978-80. DOI: http://dx.doi.org/10.1016/j.transpro-ceed.2007.03.081
23. Weiskopf D, Weinberger B, Grubeck-Loebenstein B. The aging of the imune system. Transpl Int 2009;22:1041-50. DOI: http:// dx.doi.org/10.1111/j.1432-2277.2009.00927.x
24. Wu C, Shapiro R, Tan H, Basu A, Smetanka C, Morgan C, et al. Kidney transplantation in elderly people: the influence of recipient comorbidity and living kidney donors. J Am Ge-riatr Soc 2008;56:231-8. PMID: 18070005 DOI: http://dx.doi. org/10.1111/j.1532-5415.2007.01542.x