* Corresponding author.
E-mail addresses: [email protected] (S. K. Shekhar) © 2013 Growing Science Ltd. All rights reserved. doi: 10.5267/j.msl.2013.11.002
Management Science Letters 3 (2013) 2945–2956
Contents lists available at GrowingScience
Management Science Letters
homepage: www.GrowingScience.com/msl
Does nutritional labeling increase healthy eating fallacy? An exploration into young Indian’s purchase behavior
Suraj Kushe Shekhar* and P.T. Raveendran
Department of Management Studies, Kannur University, Thalassery campus, Palayad, Kannur, Kerala-670661, India
C H R O N I C L E A B S T R A C T
Article history:
Received August 16, 2013 Received in revised format 12 September 2013 Accepted 1 November 2013 Available online
November 1 2013
The paper examines young consumers’ responses towards nutritional labeling, it’s information content and the importance of the functional characteristics of these labels as perceived by young consumers in making informed purchase decisions through personal interviews of 220 respondents using a structured questionnaire. Factor analysis was performed to identify the underlying dimensions among a set of nutritional labeling parameters using principal
component analysis. Based on factor analysis, ten factors emerged. Regression analysis and t
test indicated that, out the ten factors, only three factors namely ‘Nutritional Belief’, ‘Storage
instruction & Information overload’, and ‘Exercise & Nutrition’ were significant. These factors were mainly inclined outside the purview of nutritional labeling purchase influence .It was thus concluded that nutritional labeling had less influence in purchase decisions as far as young consumers were considered. Findings of the study give practical insights on food labeling issues for the food processors and policy makers.
© 2013 Growing Science Ltd. All rights reserved.
Keywords:
Behavior Consumer Labeling Nutrition Packaging Purchase
1. Introduction
Nutritional labeling is an important component of product packages. Crafting a supportive surroundings that assist people to make healthy selection is an imperative underlying standard in encouraging health. Nutrition labeling is one such model of an inhabitants-based approach aspired at aiding the food assortment environment more favorable to healthy choices by providing information to consumers about the nutrient substance of a food. Nutritional labels can abridge the entire notion of healthy consuming. It facilitates to keep track of the quantity of fat and sugar, sodium and fiber, protein and carbohydrates. It also permits consumers to make a well-versed decision of a product's overall worth (Satin, 2002).
Considering India as budding processed and packaged food bazaar, the analysis of consumers’ preferences on labeling attributes becomes important. Nutritional labels provides manufacturers’ information regarding ‘healthy eating fallacy’ of food products. Today the competition in the Indian market is so stiff that different manufacturers position their product with diverse nutritional claims and nutritional information. But are consumers really influenced by these nutritional labeling? Or are consumers getting muddled with information overload? Various studies beyond the territory of our country reveals that consumers are highly heath conscious and nutritional labeling on food products largely influenced their purchase pattern. Is nutritional labeling relevant to Indian context? The present study examines young consumers’ perceptions ,responses, towards nutritional labeling of food products particularly in South Indian context.
2. Literature review
Prathiraja and Ariyawardana (2003) mentioned nutritional labeling as an important function in providing pertinent nutrition information to customers. A study which was conducted at three super markets in Sri Lanka to recognize the market for nutritional labeling and the factors that persuade the consumer’s willingness-to-pay for nutritional labeling indicated that gender, level of education and special dietary status had a positive effect and the household size had a negative effect on the willingness to pay for nutrition information. Cowburn and Stockley (2004) scrutinized the secondary data and concluded that improvements in nutrition labeling could make a little but vital role towards making the existing point-of-purchase surroundings more favorable .They argued that the selection of healthy choices and interpretational aids can assist consumers evaluate the nutrient contribution of specific foods in general diet.
Jones and Richardson (2006) investigated the client’s insight of nutrition label using two determinants: eye movements and healthiness ratings in derby UK. The results showed that clients had a lack of understanding on how to understand nutrition information for regular labels. The traffic light model facilitated to restructure this trouble by representing imperative nutrients to which to the clients noticed. Van et al. (2007) illustrated how consumers approved front-of pack labeling of caloric content of food products and their exact preferences for other forms of information in Europe. The author’s opined that consumers seem to be aware of calories, but they did not seem to completely understand on how to apply them.
of diverse labeling layouts on consumer easiness (understanding, liking and trustworthiness) and also measured the outcomes of the labeling formats on decision-making. They concluded that participants needed considerably less time to assess simpler front-of-pack labeling, and it appeared more suitable in shopping surroundings in contrast to the more difficult labeling formats. Borgmeier and Westenhoefer (2009) identified that diverse food label designs differ in the understanding of clients. Perceived healthiness of food was persuaded by the label layout. However, such changes in perceived healthiness were not likely to persuade food choice and eating.
Stranieri et al. (2010) examined the buyer’s interest towards nutrition labeling, nutritional claims, the information consumers believed to be essential during their purchasing choices and the core uniqueness of those consumers interested in nutrition claims and nutrition labeling use. The results showed that nutrition labeling was a vital tool for product choice. But a majority did not use the labeled information at the time of food shopping. Consumers using nutrition labeling illustrated a higher interest in food safety concerns, used specialists as their resource of information and had specific dietary habits. Patrons concerned about nutrition claims showed considerable links with features influencing purchasing behaviour such as price, brand, certification etc. Ali and Kapoor (2009) discussed the issues influencing Indian consumers’ opinion on food labeling and its impact on food purchase choice making. Urban consumers pointed every food label to include information on product price, manufacturing date along with expiry dates, name and address of the product maker and information on nutritional substances for better management of fitness hazard. It was also noted that learned male consumers of juvenile age, belonging to upper earnings groups and living in moderately larger cities necessitated more technical information on a food label in comparison with others. Vyth et al. (2010) explored a sample of Dutch supermarket to test the real use of nutrition label at the point of purchase. The results revealed that the ‘Choices logo’ seemed to play a role in the food purchases of people who were health-conscious and weight-conscious.
review the correctness of nutrient content claims; review which health/nutrient claims were permissible; and recognize symbols on food labels. The results indicated that most respondents showed the skill to locate and use label information, identify symbols and some nutrient content claims, but an incapability to identify some permitted health/nutrient claims and fake claims.
3. Significance of the study
It is widely believed that present eating practices in general have a propensity to be healthy. In order to make healthier choices, consumers must be capable to differentiate healthier products from less healthy ones. This can be made by making the nutritional composition of foods transparent in the form of nutrition labels. Nutritional labeling has been believed to be the key, chiefly because it can offer consumers with information that can be employed to make informed and healthier food choices. It is an attractive tool for an array of reasons: it sustains the aim of healthy consuming while keeping consumer autonomy of selection, and it diminishes information search rates for consumers .
However the question of the hour is, are Indian consumers really nutritional conscious? Although the literature discussed above gives abundant information on nutritional consciousness and it’s associated purchase behavior of packed foods, hardly less literature exists on consumers’ responses to nutritional food labeling in an Indian context .It is even observed that Indian consumers consume a lot of junk foods. This is particularly prone in the teenage groups. Are young consumers less conscious of their health or do they prefer taste over ‘quality’ and ‘health’? How the provision of nutritional information influences young consumers food choices and whether young consumers rate nutritional information are particularly relevant questions in a state where stoutness is persistent. This paper examines the consumers’ responses towards nutritional labeling, it’s information content and the importance of the functional characteristics of these labels as perceived by young consumers in making informed purchase decisions. The findings of the study will provide practical implications and guiding principle based on young consumers’ perspectives, not only for packed food processors, retailers and package designers for designing effective food labels to win the consumer’s heart, but also for the policy makers at a time when the government is in the process of finalizing the operational guidelines for implementing the packed food safety standard acts in the country.
4. Research methodology
The descriptive research was based on eliciting responses from young semi urban consumers of Kannur district of Kerala State, India. Convenient sampling was used as the sampling technique and a total of 220 responses were elicited from 3 different college going students. Primary data were collected from these students by means of a pre-tested questionnaire. Pretesting of the questionnaire was done among a small group of students from a college to modify/eliminate inconsistency and lack of clarity in certain questions. The final survey questionnaire was comprehensively structured to capture various aspects of nutritional labeling and young consumers’ responses. The final questionnaire consisted of two parts .The first part of the questionnaire (25 questions) was intended to tackle the knowledge and approaches toward diet, health, and perception on nutritional labeling (young consumer’s understanding on nutritional label information, the effect of nutrition labeling on buying decision ) etc. The second part consisted of 9 questions examining on how often consumers used the nutrition information on food packages .Research instrument was designed using a 5 point Likert’s scale (1 =Strongly agree, 2 =Agree,3 = Neutral , 4 = Disagree and 5 = Strongly disagree).60% of the respondents were females. The mean age group of the respondents was 21 years. The study was conducted during the period Jan –May 2013.
500 is considered to be excellent. As a rule of thumb, a sample size of 200-300 is considered to be adequate for proper analysis (Gaur and Gaur, 2009).The present study had 220 respondents .Hence factor analysis was found to be adequate. The first part of the questionnaire was subjected to factor analysis to reduce the 25 questions to a smaller number of factors. The factors so evolved were further subjected to regression analysis and t test to ascertain the statistical significance of the evolved factors as far as the age and sex of the respondents were considered. The second part of the questionnaire was subjected to Kruskal-Wallis test. Data obtained through the questionnaires were analyzed using SPSS software package (Version 12) in 95 percent confidence interval.
5. Results and discussion
Cronbach alpha was used for measuring the reliability of the questionnaire (25+9=34 questions). Malhotra (2008) stated that the coefficient varies from 0-1.Value of 0.6 or less generally signifies unsatisfactory internal consistency reliability. Alpha coefficients below 0.6 are weak in reliability, 0.6-0.8 is moderate strong and 0.8-1.0 is very strong in reliability. For the questionnaire used in the study, the amount of Cronbach alpha coefficient was obtained as 0.713. Hence it was concluded that the desired questionnaire enjoyed acceptable reliability level. Further, a preliminary analysis of correlation matrix revealed the absence of singularity or multicollinearity in data. Hence the entire 25 questions were retained for factor analysis. Also, the Kaiser-Meyer-Olkin value of 0.608 indicated that the patterns of correlation were relatively acceptable (Kaiser, 1974).Bartlett’s test of sphericity (Bartlett, 1950) was also highly significant (p=.000; p <0.001) and hence the factor analysis conducted was appropriate. It was found that after extraction, factor 1 explained the highest variance (12.008 %) followed by factor 2 (8.336 %). After rotation, factor 1 explained 8.167 % of variance followed by factor 2 (7.621 %). All variables with eigen values less than 1 were discarded thus converging to a ten factor solution. From the rotated component matrix (Table 1), the factor loadings less than 0.4 were suppressed and hence not shown. From the scree plot (Fig. 1) and rotated component matrix (Table 1), only 10 factors with eigen values greater than 1 converged and suggested a 10 factor solution. There was a sharp break in the sizes of eigen values (Fig. 1) which resulted in a change in the slope of the plot from steep to shallow. It was observed that the slope of the scree plot changed from steep to shallow after the first ten factors. The Eigen values also dropped from above 1 to less than 1 when moved from factor 10 to factor 11.This suggested that a 10 factor solution may be the right choice. The obtained results from Table I showed that variables/questions (Q6, Q5, Q15 & Q9) had the highest loadings at the first component and hence grouped under factor
name ‘Nutritional Interest & Health Consciousness’. Variables/questions (Q4, Q12 & Q11) had the
highest loadings at the second component and hence grouped under factor name ‘Nutritional Belief’.
Variables/questions (Q14, Q18 & Q22) had the highest loadings at the third component and hence
grouped under factor name ‘Nutritional Attitude’. Variables/questions (Q1, Q2 & Q3) had the
highest loadings at the fourth component and hence grouped under factor name ‘Nutritional
Influence & Understandability’. Variables/questions (Q20 & Q21) had the highest loadings at the
fifth component and hence grouped under factor name ‘Storage instruction & Information
overload’. Variables/questions (Q7, Q8, Q16 & Q7) had the highest loadings at the sixth component
and hence grouped under factor name ‘Nutritional Perception’. Variables/questions (Q13 & Q10)
had the highest loadings at the seventh component and hence grouped under factor name ‘Exercise &
Nutrition’. Variables/questions (Q23 & Q25) had the highest loadings at the eight component and
hence grouped under factor name ‘Nutritional Awareness & Visual Media’. Variable/question (Q24)
had the highest loadings at the ninth component and hence grouped under factor name ‘Nutritional
Awareness & Print Media’. Variable/question (Q19) had the highest loadings at the tenth component
and hence grouped under factor name ‘Nutritional Labeling & Government’. To ascertain the level
of significance with respect to these 10 variables, regression analysis was carried out (enter method)
with age of the respondent as the dependent variable and t test was conducted with sex of the
Table 1
Rotated Component Matrix
Variables after rotation
Component
1 2 3 4 5 6 7 8 9 10
6.I am interested in nutrition .707
5 With regard to packed food purchase, nutrition is highly important .620
15.We should take good care of ourselves to be healthy .596
9 Knowing good or bad is useful because I can change what I eat .539
4.I feel the amount of information given on labels are adequate .770
12.I am confident about the quality of nutrition information on labels .653
11.It is good that our government is watching the nutritional content of the food I buy .559
14.I don't pay much attention to the food products I buy or eat .714
18.It is only necessary for some people to pay attention to food labels so that everyone may gain .580 22.Despite all the information on food labels, I will still buy foods which may not be healthy .559
1.When I buy food products for the first time, I often read the labels on the packages .762
3.The information about the content influence my buying decision .665
2.The information about the content on food packages is quite understandable .604
21.Information on health keeps changing so much that it is hard to know what foods are good for us .752
20.Storage instructions are more important than nutritional information on food products .608
8.I know a lot about nutrition .559
7.It seems that anyone can say anything they want on food labels about nutrition .556
17.We need more control over food labels to improve our eating habits .515
16.I am certain about the accuracy of the nutrition information on food labels .414 .478
13.I exercise regularly .792
10.It is good to know a lot about nutrition even though I am not using it to change my eating habits -.432
23.I get most of the nutritional information from TV .758
25.I get most of my nutritional information from other people -.539
24.I get most of my nutritional information from health magazines .846
19.Strict labeling laws will force manufacturers to provide us better quality food products .878
Source: Survey data
Note: 1. Extraction Method: Principal Component Analysis.
2. Rotation Method: Varimax with Kaiser Normalization.
3. Rotation converged in 20 iterations.
4. The number before each variable indicate the sequence in which the questions were arranged after rotation (sorted by size)
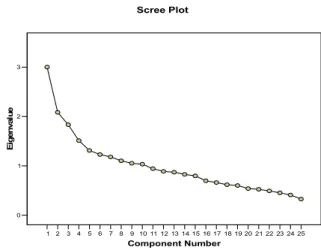
It was found that after extraction, factor 1 explained the highest variance (12.008 %) followed by factor 2 (8.336 %). After rotation, factor 1 explained 8.167 % of variance followed by factor 2 (7.621 %). All variables with eigen values less than 1 were discarded thus converging to a ten factor solution. From the rotated component matrix (Table 1), the factor loadings less than 0.4 were suppressed and hence not shown. From the scree plot (Fig. 1) and rotated component matrix (Table 1), only 10 factors with eigen values greater than 1 converged and suggested a 10 factor solution. There was a sharp break in the sizes of eigen values (Fig. 1) which resulted in a change in the slope of the plot from steep to shallow. It was observed that the slope of the scree plot changed from steep to shallow after the first ten factors. The Eigen values also dropped from above 1 to less than 1 when moved from factor 10 to factor 11.This suggested that a 10 factor solution may be the right choice. The obtained results from Table 1 showed that variables/questions (Q6,
Fig. 1. Scree plot
Variables/questions (Q4, Q12 & Q11) had the highest loadings at the second component and hence
grouped under factor name ‘Nutritional Belief’. Variables/questions (Q14, Q18 & Q22) had the
highest loadings at the third component and hence grouped under factor name ‘Nutritional Attitude’.
Variables/questions (Q1, Q2 & Q3) had the highest loadings at the fourth component and hence
grouped under factor name ‘Nutritional Influence & Understandability’. Variables/questions (Q20
& Q21) had the highest loadings at the fifth component and hence grouped under factor name
‘Storage instruction & Information overload’. Variables/questions (Q7, Q8, Q16 & Q7) had the
highest loadings at the sixth component and hence grouped under factor name ‘Nutritional
Perception’. Variables/questions (Q13 & Q10) had the highest loadings at the seventh component
and hence grouped under factor name ‘Exercise & Nutrition’. Variables/questions (Q23 & Q25) had
the highest loadings at the eight component and hence grouped under factor name ‘Nutritional
Awareness & Visual Media’. Variable/question (Q24) had the highest loadings at the ninth
component and hence grouped under factor name ‘Nutritional Awareness & Print Media’.
Variable/question (Q19) had the highest loadings at the tenth component and hence grouped under
factor name ‘Nutritional Labeling & Government’.
To ascertain the level of significance with respect to these 10 variables, regression analysis was
carried out (enter method) with age of the respondent as the dependent variable and t test was
conducted with sex of the respondent as the grouping variable and yielded the following results as shown in Table 2 and Table 3.
Table 2
Coefficients (a)
Model Unstandardized Coefficients Standardized Coefficients t Sig.
B Std. Error Beta
1 (Constant) 21.455 .117 183.079 .000
Nutritional Interest & Health Consciousness .177 .117 .100 1.503 .134
Nutritional Belief .284 .117 .161 2.415 .017
Nutritional Attitude .146 .117 .083 1.241 .216
Nutritional Influence & Understandability .086 .117 .049 .735 .463
Storage instruction & Information overload .203 .117 .115 1.725 .086
Nutritional Perception -.043 .117 -.025 -.367 .714
Exercise & Nutrition -.022 .117 -.012 -.184 .854
Nutritional Awareness & Visual Media -.004 .117 -.002 -.035 .972
Nutritional Awareness & Print Media .098 .117 .056 .837 .403
Nutritional Labeling & Government .112 .117 .064 .957 .340
Source: Survey data a Dependent Variable: Age
1 2 3 4 5 6 7 8 9 10 11 12 13 14 15 16 17 18 19 20 21 22 23 24 25
Component Number
0 1 2 3
Ei
ge
nv
al
ue
Standardized beta coefficients which give a measure of contribution of each variable to the regression
model (Table 2), indicated that the factor named ‘Nutritional Belief’had the highest beta coefficient.
The t and Sig (p) values which gives an indication of the impact of each factor, showed significance
(p< .05) for factor ‘Nutritional Belief’. The bifurcation of this factor (shown below) is therefore significant.
‘I feel the amount of information given on labels are adequate’, ‘I am confident about the quality of nutrition information on labels’,
‘It is good that our government is watching the nutritional content of the food I buy’
Now it can be easily interpreted that as far as the age of the respondents were considered ,there were significant differences about the faith of the ‘Government watch’ .This reflected in differences in the confidence about the quality and amount of information (information given on labels are adequate) given on food packages. However having nullified (p>.05 ; in significant) the majority of the major
factors (9 factors) and the significance of factor named ‘Nutritional Belief ’ goes well to conclude
that as far as the age of the consumers were considered ,they were less interested in nutritional labeling and it hardly influenced purchase decisions.
The significance level for Levene's test (Table 3) were above 0.05 for all the listed factors and hence
equal variances were assumed. The observed t-values were 2.457 and -2.463 for factors ‘Storage
instruction & Information overload’ and ‘Exercise & Nutrition’ .The two tailed probability of .015
(Storage instruction & Information overload) and .015 (Exercise & Nutrition) were less than .05
and therefore the test was considered significant at .05 level of significance for these two factors only.
Bifurcation of these factors into its constituting variables indicated that there were significant
differences in ‘doing exercise regularly’, ‘importance of storage instruction over nutritional
information’, ‘It is good to know a lot about nutrition even though I am not using it to change my
eating habits’ and ‘Information on health keeps changing so much that it is hard to know what foods
are good for us’ etc. Taking into account of the nullification of other 8 factors along with the above
Table 3
Independent samples test (a)
Levene's Test for Equality
of Variances t-test for Equality of Means
F Sig. t df Sig. (2-tailed) Mean Difference DifferenceStd. Error 95% Confidence Interval of the Difference
Lower Upper
Nutritional Interest &
Health Consciousness Equal variances assumed 1.291 .257 -.741 218 .459 -.10209704 .13776232 -.37361357 .16941948
Equal variances not assumed -.750 193.791 .454 -.10209704 .13618499 -.37069210 .16649802
Nutritional Belief Equal variances assumed 1.355 .246 .355 218 .723 .04894617 .13789591 -.22283365 .32072600
Equal variances not assumed .348 172.838 .729 .04894617 .14083952 -.22904067 .32693302
Nutritional Attitude Equal variances assumed .793 .374 .544 218 .587 .07497613 .13784225 -.19669793 .34665019
Equal variances not assumed .554 197.780 .580 .07497613 .13535322 -.19194460 .34189686
Nutritional Influence &
Understandability Equal variances assumed .311 .577 .282 218 .778 .03892943 .13791055 -.23287925 .31073810
Equal variances not assumed .285 192.141 .776 .03892943 .13669925 -.23069444 .30855329
Storage instruction &
Information overload Equal variances assumed 2.110 .148 2.457 218 .015 .33434049 .13606433 .06617053 .60251045
Equal variances not assumed 2.373 163.754 .019 .33434049 .14092229 .05608146 .61259953
Nutritional Perception Equal variances assumed .517 .473 -1.060 218 .290 -.14582854 .13758169 -.41698906 .12533199
Equal variances not assumed -1.038 172.969 .301 -.14582854 .14049048 -.42312497 .13146790
Exercise & Nutrition Equal variances assumed 1.618 .205 -2.463 218 .015 -.33508252 .13605596 -.60323598 -.06692906
Equal variances not assumed -2.405 171.242 .017 -.33508252 .13929925 -.61004727 -.06011777
Nutritional Awareness &
Visual Media Equal variances assumed 1.477 .225 -1.024 218 .307 -.14088132 .13760533 -.41208845 .13032580
Equal variances not assumed -1.009 176.919 .315 -.14088132 .13967032 -.41651558 .13475294
Nutritional Awareness &
Print Media Equal variances assumed .091 .763 1.889 218 .060 .25847097 .13682038 -.01118908 .52813103
Equal variances not assumed 1.892 187.541 .060 .25847097 .13661681 -.01103218 .52797413
Nutritional Labeling &
Government Equal variances assumed .060 .807 .246 218 .806 .03388472 .13791666 -.23793600 .30570543
Equal variances not assumed .248 192.548 .804 .03388472 .13661490 -.23556916 .30333859
Table 4
Test statistics (a,b)
types of food Compare Check sugar content Check fat content Check calories content Check protein content serving size Determine Get strorage instruction Get cooking instruction
Chi-Square 1.290 .961 .057 .312 .007 .194 7.674 22.342
df 1 1 1 1 1 1 1 1
Asymp. Sig. .256 .327 .811 .576 .931 .660 .006 .000
Source: Survey data a Kruskal Wallis Test b Grouping Variable: Sex
The results of Kruskal Wallis analysis indicated that there were significant differences in ‘looking
storage instructions’ (p<.05) and in ‘looking for cooking instructions’ (p<.05) only. Females were
more inclined in looking this information. From this analysis it is evident that variables like checking fat contents, calories contents, protein contents , sugar content etc. were insignificant (p>.05). These findings further supported that young consumers were least interested in nutritional labeling and it hardly influenced their purchase decisions.
6. Conclusion
The paper examined young consumers’ responses towards nutritional labeling, it’s information content and the importance of the functional characteristics of these labels as perceived by young consumers in making informed purchase decisions. The findings of the study revealed that nutritional labeling had less influence in purchase decisions as far as young consumers were considered. Results were in contradiction to the findings of (Prathiraja & Ariyawardana 2003; Kempen et al. 2011; Vyth et al., 2010) mentioning nutritional labeling having positive influence on purchase patterns.Out of the ten factors which initially converged after rotation in factor analysis, only three factors namely
‘Nutritional Belief’, ‘Storage instruction & Information overload’, and ‘Exercise & Nutrition’
emerged to be significant after t test and regression analysis results. These factors were mainly
inclined outside the purview of nutritional labeling and purchase influence. However, it was found that consumers’ were happy as Government was keeping watch on food product safety and labeling standards. These activities made them to believe that information on labels were accurate and adequate. However, these findings can be misleading from consumers’ point to view as a vast majority of the vendors hide unhealthy labeling practices inspite of any mandatory disclosures given by the Government.
7. Managerial implications
As nutritional labeling was found to have less impact on young consumers purchase patterns, the packed food processors, retailers and package designers has to rethink their positioning strategies for designing effective food labels to win the young consumers’ heart .They need to promote the ‘healthy eating fallacy’ and educate this target segment the importance of staying healthy .Further, Food Safety Standards (Packaging and Labeling) regulations, 2011, of the Government of India must foster strict monitoring of packed food products and nutritional labeling practices to ensure quality food products to the Indian citizens. The Ministry of Consumers Affairs, Food and Safety, Government of India has an important role to play in the education of the shopping consumers. The findings also demonstrated the need to educate consumers of packed food, so that they can take informed decisions in respect to food quality and safety.
8. Limitations and scope for future research
are consumed irrespective to age groups, the study could even be extended to diverse age groups. Such an extended study would throw more light in understanding the significant differences across several demographic variables. The study can even be narrowed down to specific product categories or brands. The study can also be raveled to understand the difference in nutritional labeling attitude of consumers (if any) of urban and rural areas and consumer behavior patterns can be interpreted with different methods of analysis such as discriminant analysis, conjoint analysis etc.
References
Ali, J., & Kapoor, S. (2009).Understanding consumers' perspectives on food labeling in India.
International Journal of Consumer Studies, 33(6), 724-734.
Bartlett, M. S. (1950). Periodogram analysis and continuous spectra. Biometrika,37(1),1-16.
Borgmeier, I., & Westenhoefer, J. (2009). Impact of different food label formats on healthiness
evaluation and food choice of consumers: a randomized-controlled study. BMC Public Health,
9(1), 184.
Cowburn, G., & Stockley, L. (2005). Consumer understanding and use of nutrition labeling: a
systematic review. Public Health Nutrition, 8(1), 21-28.
Drewnowski, A., Moskowitz, H., Reisner, M., & Krieger, B. (2010). Testing consumer perception of
nutrient content claims using conjoint analysis. Public Health nutrition, 13(5),688.
Drichoutis, A. C., Lazaridis, P., Nayga, R. M., Kapsokefalou, M., & Chryssochoidis, G. (2008). A
theoretical and empirical investigation of nutritional label use. The European Journal of Health
Economics, 9(3), 293-304.
Gaur, A. S., & Gaur, S. S. (2009). Statistical methods for practice and research: A guide to data
analysis using SPSS. New Delhi: Sage Publications India Pvt Ltd.
Golan, E., Kuchler, F., Mitchell, L., Greene, C., & Jessup, A. (2001). Economics of food labeling.
Journal of Consumer Policy, 24(2), 117-184.
Graham, D. J., & Jeffery, R. W. (2011).Predictors of nutrition label viewing during food purchase
decision making: an eye tracking investigation. Public Health Nutrition, 15(2), 189.
Grunert, K. G., & Wills, J. M. (2007).A review of European research on consumer response to
nutrition information on food labels. Journal of Public Health, 15(5), 385-399.
Jones, G., & Richardson, M. (2007). An objective examination of consumer perception of nutrition
information based on healthiness ratings and eye movements. Public Health Nutrition, 10(3),
238-244.
Kaiser, H. F. (1974).An index of factorial simplicity. Psychometrika, 39(1), 31-36.
Kempen, E., Bosman, M., Bouwer, C., Klein, R., & van der Merwe, D. (2011). An exploration of the
influence of food labels on South African consumers' purchasing behaviour. International Journal
of Consumer Studies, 35(1), 69-78.
Kiesel, K., McCluskey, J. J., & Villas-Boas, S. B. (2011). Nutritional labeling and consumer choices.
Annuls Review of Resources Economy, 3(1),141-158.
Lion, R., & Van den Kommer, M. (2008).Front-of-pack nutrition labelling: testing effectiveness of
different nutrition labeling formats front-of-pack in four European countries. Appetite, 50, 57-70.
Lynam, A. M., McKevitt, A., & Gibney, M. J. (2011). Irish consumers’ use and perception of
nutrition and health claims.Public Health Nutrition, 14(12),2213-2219.
Malhotra, N. K. (2008). Marketing Research: An Applied Orientation, 5/e. Pearson Education India.
Prathiraja, P. H. K., & Ariyawardana, A. (2003). Impact of nutritional labeling on consumer buying
behavior. Sri Lankan Journal of Agricultural Economics, 5, 35-46.
Roberto, C. A., Bragg, M. A., Livingston, K. A., Harris, J. L., Thompson, J. M., Seamans, M. J., & Brownell, K. D. (2011).Choosing front-of-package food labeling nutritional criteria: how smart
were ‘Smart Choices’?. Public Health Nutrition, 15(2), 262.
Satin, M. (2002). Food standards and labeling systems in Asia and the Pacific: Report of the APO
and the Pacific: Report of the APO Seminar held in Tokyo, Japan, 4-11 April 2001. Asian Productivity Organization (APO).
Stranieri, S., Baldi, L., & Banterle, A. (2010).Do nutrition claims matter to consumers? An empirical
analysis considering European requirements. Journal of Agricultural Economics, 61(1), 15-33.
Tao, Y., Li, J., Lo, Y. M., Tang, Q., & Wang, Y. (2010). Food nutrition labelling practice in China.
Public Health Nutrition, 14(3), 542.
Van der Merwe, D., Bosman, M., Ellis, S., de Beer, H., & Mielmann, A. (2012). Consumers’ knowledge of food label information: an exploratory investigation in Potchefstroom, South Africa.
Public Health Nutrition, 1(1), 1-6.
Van Kleef, E., Van Trijp, H., Paeps, F., & Fernández-Celemín, L. (2008). Consumer preferences for
front-of-pack calories labeling. Public Health Nutrition, 11(2),203.
Vyth, E. L., Steenhuis, I. H., Vlot, J. A., Wulp, A., Hogenes, M. G., Looije, D. H.,& Seidell, J. C. (2010).Actual use of a front-of-pack nutrition logo in the supermarket: consumers’ motives in food
choice. Public Health Nutrition, 13(11), 1882.
Wansink, B., Sonka, S. T., & Hasler, C. M. (2004).Front-label health claims: when less is more. Food