* Corresponding author. Tel: +234 8035050573 E-mail addresses: kunlemusa@yahoo.com (A. I. Musa) © 2012 Growing Science Ltd. All rights reserved. doi: 10.5267/j.msl.2012.06.035
Contents lists available at GrowingScience
Management Science Letters
homepage: www.GrowingScience.com/msl
Comparison of biomechanical and anthropometrical data of Nigeria tertiary institution students with some selected countries
A.I. Musaa*, S.O. Ismailab, S. B. Adejuyigbeb, O.D. Akinyemicand M.S. Abolarind
a
Mechanical Engineering Department, Moshood Abiola Polytechnic, P.M.B. 2210, Abeokuta, Nigeria b
Mechanical Engineering Department, Federal University of Agriculture, P.M.B. 2240, Abeokuta, Nigeria c
Physics Department, Federal University of Agriculture, P.M.B. 2240, Abeokuta, Nigeria d
Mechanical and Production Engineering Department, Federal University of Technology, Minna, Nigeria A R T I C L E I N F O A B S T R A C T
Article history: Received March 14, 2012 Received in Revised form June, 2, 2012
Accepted 22 June 2012 Available online June 23 2012
The anthropometric data of student in selected tertiary institutions in Abeokuta, Ogun State, Nigeria was investigated and this was compared with some selected foreign countries. The study was to determine whether design improvement and further study is required in order to improve the conditions in Nigeria tertiary institutions. The anthropometrics measurements data were collected from 720 students of selected institutions. The data indicate a substantial degree of variability between the Nigerian tertiary students’ body and the foreign counterparts. Since most of the furniture in use in our tertiary institutions in Abeokuta, Nigeria were designed and constructed using the anthropometric data of students in foreign countries, there is need for anthropometric data of Nigerian students in the tertiary institution for the design and construction of furniture to suit them. The result is of great concern which could affect students in other institutions throughout Nigeria and could also pose a great risk of having back problem among students in Nigeria.
Statement of Relevancy: The chair and table used in Nigeria were designed with reference to the measurement of other countries. The database of the Nigerian students will be very useful parameter in guiding principle for the designing of future equipment to be used in classrooms, laboratories and lecture theaters of the institutions.
© 2012 Growing Science Ltd. All rights reserved.
Keywords: Anthropometric Foreign countries Students Ergonomics
1. Introduction
identification, was translated to English and was introduced for use in the penal system in the United States shortly after it was written (Moenssens, 1971). It should be noted that there are records of anthropometric measures dating back to the early 1700s. These are largely records used by the military to classify and identify men in their units. In the United States, the slave trade also made use of anthropometry for identification purposes (Cuff, 2004). While anthropometry was originally used for identification, other applications were developed in the twentieth century. It became a valuable tool for describing relationships between populations and for individuals within a population.
Anthropologists use historical anthropometry to understand economic and social changes in a culture (Cuff, 2004). The medical community uses anthropometric data to assess the well-being of their patients – many people are familiar with the “growth charts” used to measure the physical development of children. More than any other sector, the defense industry has driven research in anthropometric methods and data. This began when World War I created the need for standardized uniforms for a large fighting force. The sample size of the population was unprecedented. Of course, this was a skewed sample, because of the age, gender and health of the soldiers (Krupa, 1994). The military continued to lead anthropometric research because of its access to subjects and because of the performance needs of military equipment. The automobile industry also became a driver in the field, as the sophistication and functional requirements in transportation design grew. This became true of the design of other commercial products.
Henry Dreyfuss, who is the best known advocate of anthropometry for design, began the development of guidelines for designers of commercial products around World War II (Krupa, 1994). The sample populations from which his data was generated was still largely from the military and therefore, skewed, but it was nevertheless, an improvement on the “rule of thumb” approach common in design practices. In 1955, he published the Measure of Man which provided data on anthropometric percentiles for the American adult male and female. It was comprised of diagrams of human figures with measurements for a specific gender, age group and percentile. It has been expanded and improved upon over the decades, often criticized, but it is still in use today.
Specific instruments have been developed to take anthropometric measures. The anthropometer, or beam caliper, the spreading caliper and the sliding caliper are the traditional instruments for measuring body size.
Fig. 1. An anthropometer
A. I. Musa et al. / Management Science Letters 2 (2012)
1887
Measurements between landmarks are taken in various positions, usually standing and sitting, but sometimes prone or supine. Heights from the floor, assorted circumferences, body breadths, and depths are recorded. These measurements provide the data necessary to create a numeric representation of the subject. In recent years, an effort has been made to standardize and codify measurement and landmark definitions. ("Anthropometric data analysis sets manual", 1994). Problems can arise in the data collection process. These include differences in the practices of data collectors, inaccurate use of instruments, incorrect posture of the subject, and the difficulty of measuring soft tissue due to displacement. Reliability, accuracy and validity are critical in measurement verification (Anthrotech, 2001).
The real value of anthropometry lies not in the raw data, but in its application. Statistics must be performed to make the data meaningful. General descriptive statistics such as the median, the standard deviation and the population size are adequate to calculate percentiles. Percentiles are the primary point of reference for designers (Musa, 2011). Traditionally, designers look at the dimensions of the 5th percentile female and the 95th percentile male for the measure they are considering in an effort to accommodate the largest percent of the population. Percentiles are only specific to the dimension that they describe – there is no such thing as an “average” person (Pheasant, 1986). When more than one dimension is used, larger percentages of the population may be excluded. Using the 5th to 95th percentile rule, 10% of the population is excluded. If you were to design with 13 dimensions under these guidelines, up to 52% of the population would have one or more "aspects" that fall outside of the design parameters.
Adejuyigbe et al. (2004) proposed specifications based on foreign anthropometric data which cannot be used for any construction of furniture for use in the institution under consideration. Since most of the furniture in use in our tertiary institutions were designed and constructed using the anthropometric data of other countries, there is need for anthropometric data of Nigerian students in the tertiary institution for the design and construction of furniture to suit them. Anthropometric data should be established for the user population and the anthropometric data for Nigerians is very scanty (Ismaila, 2009).
Therefore, this study is an attempt to collating local anthropometric data and compares it with the foreign anthropometric data which has been done in this work. This will definitely fill the gap of using foreign anthropometric data instead of the local suitable data yet untapped in Nigeria to develop an infrastructure such as furniture’s that can be used in Nigeria tertiary institutions (Musa, 2011). The purpose of this study is to obtain the anthropometric data of students of selected tertiary institutions in Abeokuta. The data obtained by this study will be compared with the foreign anthropometric data.
2. Materials and Method
Three higher institutions in Abeokuta metropolis were selected to participate in the research. The institutions are Federal University of Agriculture, Moshood Abiola Polytechnic, and Federal College of Education. A total of 720 students participated in the study with 240 students (120 boys and 120 girls) drawn from each participating institutions.
2.1 Measurements Procedure
The measuring instruments used for this study were as follows:
(i) Weighing machine floor type (Standio-meter), model-Health Scale ZT-160, Micro field, England, (ii) Venier Caliper – Range 0-68cm with error 0.1mm. (iii) Metal tape and Angle finder.
2.3 Data Analysis
The data was analyzed statistically by using SPSS 16.0 statistical package and Microsoft Excel (2007) programs. The anthropometric data was analyzed using average, minimum, maximum, standard deviation and 5%-ile, 50%-ile and 95%-ile according to gender, age and school.
3. Results and Discussion
The anthropometrical data was analyzed using average, minimum, maximum, standard deviation, 5%-ile, 50%-ile and 95%-ile according to gender, age and school. The anthropometric data of the students are presented in Tables 1 to 3. In table 1 the anthropometric data collected for the institutions were collated together. Table 2 shows the comparison between anthropometric dimensions of the three institutions while table 3 shows the comparison between the anthropometric dimensions of male and female students in all the three institutions (FCE, MAPOLY and FUNAAB respectively). It can be deduced from the tables that the data collected, means and median for the most measures were identical, indicating a highly symmetrical distribution. The anthropometric dimensions of the male in all the three institutions are higher than those of the female, except the hip breadth and the buttock popliteal-length that was higher (Table 2). Comparison of the anthropometric dimensions between the three institutions showed that there was not much difference in the dimension due to the fact that the schools are tertiary institutions requiring the same age limit for admission and the students were selected at random (Table 2).
Table 1
Summary of Anthropometric dimensions among Students of the selected schools (All measurements in cm except Body mass in kg) (n = 720)
Anthropometric Dimension Mean SD Min Max Median 5%ile 50%ile 95%ile
Age(Yrs.) 22.85 2.05 17.00 27.00 23.00 19.00 23.00 26.00
Sitting Height 78.74 5.30 69.00 92.00 77.50 72.00 77.50 89.00
Sitting Elbow Rest Height 19.18 2.11 15.00 23.50 19.00 15.50 19.00 22.50
Sitting Shoulder Height 49.66 4.89 52.00 60.00 50.00 42.00 50.00 55.00
Thigh Clearance 13.81 1.23 12.00 18.00 14.00 12.00 14.00 16.00
Knee Height 50.50 4.16 42.00 61.00 50.00 44.00 50.00 58.95
Popliteal Height 40.92 4.65 44.00 52.00 40.00 36.00 40.00 49.00
Stature 164.87 7.99 150.00 187.00 163.75 153.03 163.75 180.00
Body Mass 59.66 6.27 41.00 83.00 59.00 52.00 59.00 73.90
Buttock Popliteal Length 40.72 3.54 32.00 47.00 42.00 32.05 42.00 46.00
Hip Breadth 32.88 2.40 27.00 55.00 33.00 29.00 33.00 36.00
Eye Height 69.46 5.22 58.00 87.00 69.00 63.00 69.00 79.00
Buttock-Knee Length 55.74 2.94 50.00 63.00 56.00 51.05 56.00 61.00
Forearm- Hand Length 45.60 3.08 39.00 53.00 45.00 41.00 45.00 52.00
A. I. Musa et al. / Management Science Letters 2 (2012)
1889
Table 2
Comparison of Anthropometric dimensions between the Selected Schools (All Measurements in cm except Body Mass in Kg) (Mean ± Standard Deviation) Anthropometric
Dimension FCE (n=240) FUNAAB MAPOLY (n=240) COMBINE (n=240) (n=720) MALE FEMALE MALE FEMALE MALE FEMALE M. (n=360) F. ( n=360)
Age (yrs.) 23.33±1.7123.00 ± 1.97 23.93±1.85 22.00±1.96 21.90±2.42 22.93±1.53 22.94±2.25 22.76±1.82 Sitting Height 80.33±3.96 75.73±2.44 83.83±3.24 74.67±2.56 82.90±6.35 75.00±2.38 82.36±4.93 75.13±2.43 Sitting Elbow Rest
Height 19.43±1.7119.70±2.06 20.03±2.05 18.77±1.55 20.77±1.61 16.33±2.16 20.17±1.96 18.18±2.26 Sitting Shoulder
Height 49.43±3.52 49.20±1.33 54.13±2.37 48.13±7.63 46.27±5.26 50.77±1.85 49.94±5.06 49.37±4.71 Thigh Clearance
13.47±1.03 14.17±1.32 14.90±1.25 13.27±1.00 13.73±0.93 13.33±0.95 14.03±1.24 13.59±1.17 Knee Height 53.70±2.34 49.17±1.47 53.11±2.97 46.57±2.02 55.83±5.39 46.17±2.47 54.22±3.97 47.30±2.42 Popliteal Height
47.97±1.48 39.63±1.93 39.67±1.78 36.37±5.52 40.97±2.19 39.53±1.73 42.87±4.09 38.51±3.82 Stature 172.95±6.42 165.41±4.51 169.4±16.01 156.63±3.31 166.37±8.19 158.41±3.31 169.58±7.42 160.15±5.33 Body Mass
63.17±7.50 58.17±7.70 58.43±3.41 56.95±3.24 62.47±7.68 58.78±2.96 61.36±6.81 57.97±5.16 Bottom Popliteal
Length 36.50±3.39 42.30±1.40 38.67±2.06 43.83±1.22 38.87±2.17 44.13±1.39 38.01±2.81 43.42±1.56 Hip Breadth
32.17±1.35 32.83±1.25 32.77±1.36 32.40±2.00 32.03±1.97 35.07±3.94 32.32±1.61 33.43±2.89 Eye Height 70.60±3.70 67.03±2.47 74.33±3.72 65.30±2.35 73.93±5.96 65.57±2.44 72.96±4.87 65.97±2.53 Buttock Knee
Length 54.10±1.9356.83±3.83 58.20±2.19 54.90±1.58 56.07±3.34 54.37±1.69 57.03±3.30 54.45±1.77 Forearm Hand
Length 48.80±3.44 43.97±1.97 46.43±2.44 44.27±2.02 46.50±2.87 43.63±1.77 47.24±3.14 43.96±1.93 Sitting Elbow
Height 59.07±3.4067.43±3.52 59.77±2.84 56.67±3.19 62.67±3.42 55.93±2.69 63.29±4.55 57.19±3.39
Table 3
Anthropometric Measure for 720 Students of the Selected Schools (All measurements in cm except Body mass in kg) Anthropometric
Dimension Sex MeanN SD Min Max Median 5% 50% ile 95% ile ile
Age (yrs.) Male 360 22.94 2.25 17.00 27.00 23.00 19.00 23.00 26.00 Female 360 22.76 1.82 19.00 26.00 23.00 19.00 23.00 25.00
Sitting Height Male 360 82.36 4.93 70.00 92.00 83.00 73.00 83.00 90.00 Female 360 75.13 2.43 69.00 81.00 75.00 70.00 75.00 79.00 Sitting Elbow Rest
height Male 360 20.17 1.96 16.00 24.00 20.00 17.00 20.00 23.00 Female
360 18.18 2.26 14.00 23.00 18.00 14.00 18.00 22.00 Sitting Shoulder
height Male 360 49.49 5.06 36.00 60.00 51.00 39.00 51.00 58.00 Female
360 49.37 4.71 45.00 53.00 50.00 47.00 50.00 52.00
Thigh Clearance Male 360 14.03 1.24 12.00 18.00 14.00 12.00 14.00 17.00 Female 360 13.59 1.17 12.00 17.00 13.00 12.00 13.00 16.00 Knee Height Male 360 54.22 3.97 48.00 68.00 53.00 49.50 53.00 65.00 Female 360 47.30 2.42 42.00 52.00 47.00 43.00 47.00 51.00
Popliteal Height Male 360 42.87 4.09 36.00 52.00 42.00 37.00 42.00 49.00 Female 360 38.51 3.82 35.00 43.00 39.00 36.00 39.00 42.00
Stature Male 360 169.58 7.42 154.00 187.00 169.50 158.00 169.50 181.00 Female 360 160.15 5.33 150.00 172.00 160.00 152.00 160.00 169.00
Body Mass Male 360 61.36 6.81 50.00 83.00 59.75 52.00 59.75 76.00 Female
360 57.97 5.16 41.00 74.00 58.00 51.50 58.00 68.00 Buttock Popliteal
Length Male 360 38.01 2.81 32.00 46.00 38.00 33.00 38.00 42.00 Female 360 43.42 1.56 39.00 47.00 43.00 41.00 43.00 46.00
Hip Breadth Male 360 32.32 1.61 28.00 36.00 32.00 29.00 32.00 35.00 Female 360 33.43 2.89 27.00 55.00 33.00 30.00 33.00 36.00
Eye Height Male 360 72.96 4.87 62.00 87.00 73.00 64.00 73.00 81.00 Female 360 65.97 2.53 58.00 72.00 66.00 62.00 66.00 70.00
Buttock Knee Length Male 360 57.03 3.30 50.00 63.00 58.00 51.00 58.00 62.00 Female
360 54.46 1.77 51.00 57.00 55.00 52.00 55.00 57.00
Forearm Hand Length Male 360 47.24 3.14 41.00 53.00 47.00 42.00 47.00 53.00 Female 360 43.95 1.93 39.00 47.00 44.00 40.00 44.00 47.00
Sitting Elbow Height Male 360 63.29 4.55 55.00 72.00 63.00 56.00 63.00 71.00 Female
Mean Value For The Anthropometric Dimensions Obtained For Tertiary School Students Population From Several Nationals of The World With The Present Study. (Na = Data Not Reported)(All measurements in cm except Body mass in kg)
Anthropometric
Dimension Present Study Turkey China Iran Korea Portugal U.K
M. F. M. F. M. F. M. F. M. F. M. F. M. F. Sitting Height 82.36 75.13 91.20 83.50 90.80 85.50 91.20 86.10 92.10 86.60 92.00 86.50 91.00 85.00 Sitting Elbow
Rest Height 20.17 18.18 23.70 26.50 26.30 25.10 25.90 25.90 26.50 26.30 25.50 25.00 24.50 23.50 Sitting
Shoulder Height
49.94 49.37 61.20 59.30 NA NA 62.00 59.80 NA NA 63.00 59.50 59.50 55.50
Thigh
Clearance 14.03 13.59 NA NA NA NA NA NA NA NA NA NA NA NA
Knee Height 54.22 47.30 54.70 50.70 49.30 45.80 NA NA 50.80 47.00 52.50 48.00 54.50 50.00 Popliteal
Height 42.87 38.51 43.30 42.10 41.30 38.20 43.10 36.40 41.00 38.40 40.00 36.50 44.00 40.00
Stature 169.58 160.15 174.90 161.80 167.80 157.00 172.50 159.70 170.70 158.80 169.00 156.50 174.00 161.00
Body Mass 61.36 57.97 69.50 56.02 59.00 52.00 65.66 56.52 66.00 53.50 74.00 64.00 NA NA
Bottom Popliteal Length
38.01 43.42 48.80 48.10 45.70 43.30 NA NA 47.00 44.90 48.50 47.00 49.50 48.00
Hip Breadth 32.32 33.43 35.10 35.00 30.60 31.70 34.20 36.30 32.20 31.90 38.00 40.00 36.00 37.00 Eye Height 72.96 65.97 81.40 76.10 79.80 73.90 80.50 75.30 80.90 75.80 81.00 76.00 79.00 74.00 Buttock Knee
Length 57.03 54.46 60.90 57.30 55.40 52.90 53.00 48.70 55.30 52.80 59.00 57.00 59.50 57.00
Forearm Hand
Length 47.24 43.96 86.30 81.50 82.60 75.70 77.50 69.80 82.10 76.00 NA NA NA NA Sitting Elbow
Height 63.29 57.19 NA NA NA NA NA NA NA NA NA NA NA NA
Table 5
Anthropometric dimensions from different female and male student’s populations Female Anthropometric Dimensions
Male Anthropometric Dimensions
Present Study Turkey Portugal Iran Present Study Turkey Portugal Iran
5% ile 95% ile 5% ile 95% ile 5% ile 95% ile 5% ile 95% ile 5% ile 95% ile 5% ile 95% ile 5% ile 95% ile 5% ile 95% ile Kne e H eig ht
43.0 51.0 45.7 57.1 43.5 47.5 45.1 49.3 49.0 65.0 49.6 59.6 47.5 57.5 49.3 57.1
Popli teal H e ig ht 36.0
42.0 38.6 46.3 32.7 40.3 31.7 43.1 37.0 49.0 40.5 46.1 35.8 44.2 40.0 46.5
B o ttom P oplite a l Le n g
th 41.0 46.0 40.6 56.1 42.1 52.0 NA NA 33.0 42.0 42.4 55.1 43.2 53.8 NA NA
H ip B re adt h 30.0
36.0 30.9 39.0 35.5 44.5 31.8 41.1 29.0 35.0 31.4 39.1 34.0 42.0 31.1 37.7
A. I. Musa et al. / Management Science Letters 2 (2012)
1891
(Tunnay et al, 2008), United Kingdom (Pheasant, 1998), Iran (Mououdi, 1997), China (Lee, 2000), Portugal (Barroso et al., 2005), Korea (Lee, 2000). The anthropometric dimensions in the present study were also compared in Fig. 2 to Fig. 7.
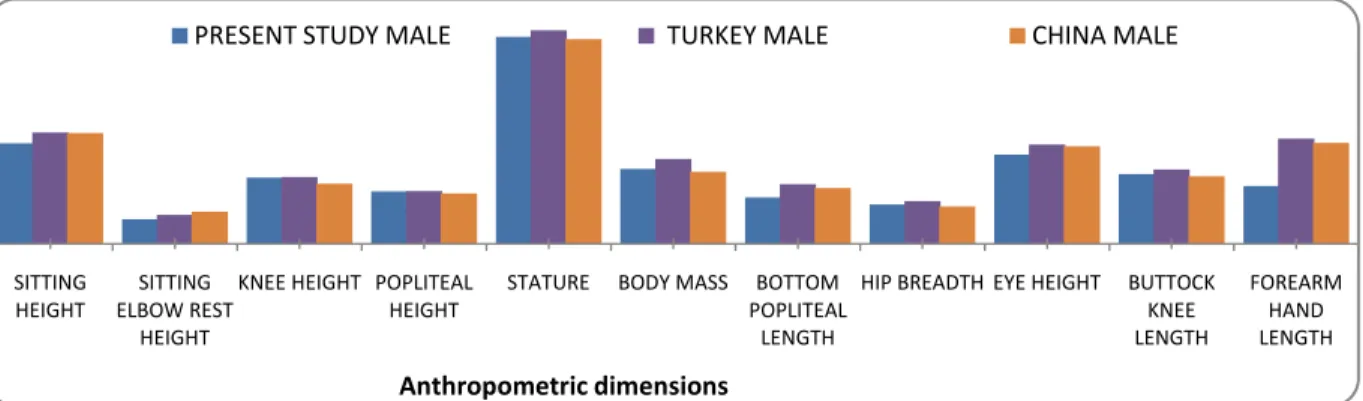
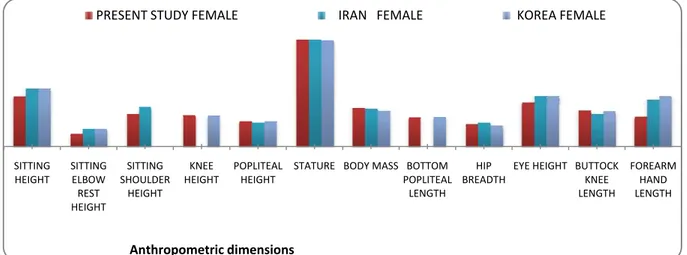
The males mean stature (height) in the present study (169.58cm) compared favourably with that of Portugal (169.00cm) and Korea (170.70cm) but was lower than that of United Kingdom (174.00cm), Iran (172.50cm) and Turkey (174.70cm) but higher than that of China (167.80cm). For the females, the mean stature (height) in the present study of 160.15cm compared favourably with that of Turkey (161.80cm), Iran (159.70cm), United Kingdom (161.00cm) but a bit higher than that of China (157.00cm), Korea (158.80cm), Portugal (156.50cm).The mean knee height for the males of 54.22cm was similar to those of the students in Turkey (54.70cm) and U.K (54.50cm) but higher than that of Portugal (52.50cm), Korea (50.80cm), China (49.30cm). In the case of the females, the mean knee height in the present study was 47.30cm, and 50.70cm (Turkey), 45.80cm (China), 47.00cm (Korea), 48.00cm (Portugal), 50.00cm (United Kingdom). For sexes, the present study values for sitting shoulder height, elbow rest height, sitting height and forearm hand length were lower than the corresponding values from other countries.
In the table, the most important dimensions of the students related to the ergonomic design of school tables and chairs are compared with the 5%-le values from the female measurements and the 95%-le values from the male measurements (Mououdi, 1997; Tunnay et al, 2008; Barroso et al, 2005). Five percentile (5%) values of the buttock popliteal length were 42.1cm in Portugal, 40.6cm in Turkish study, as against 41.0cm in the present study of female student’s. This mean that the seat designed for Portuguese females will be slightly fit for Nigerian female students. In addition, 5%-le values of female popliteal height were 32.7cm in Portugal and 31.7cm in Iran compared with 36.0cm in the present study. This shows that the seat designed for other countries will be too low or too shallow for Nigerian students. Ninety five percentile (95%) values for Hip breadth was 42.0cm in Portugal, 37.7cm in Iran, 39.1cm in Turkey as against 35.0cm in the present study of male students. This suggests that the seat spacing for males in these countries will be too wide or fit for Nigerian students. Also, the 95%-le value for knee height in a sitting position was 57.5cm in Portugal, 59.6% in Turkey, 57.1cm in Iran compared with 65.0cm in the present study.
Fig. 2. Comparison between Mean Values for the Anthropometric Dimensions obtained for tertiary institution Male Students Population of Turkey and China with the Present Study
This suggests that the table designed for other countries may not accommodate the greater knee height in the present study due to the fact that the table clearance is too low for Nigerian students. These data make it obvious that the results of the present study and five other countries differed, either too high or too low. However, designers should remember that anthropometric dimensions also varies overtime even within nations. Studies shows that stature (height) increases by an average of 1.0cm and body mass increases by an average of 2.0kg every 10years (Bridger, 1995; Kroemer et al., 2001; Helander,1995). In this respect, designers should use the science of anthropometry to
SITTING HEIGHT
SITTING ELBOW REST
HEIGHT
KNEE HEIGHT POPLITEAL HEIGHT
STATURE BODY MASS BOTTOM POPLITEAL
LENGTH
HIP BREADTH EYE HEIGHT BUTTOCK KNEE LENGTH
FOREARM HAND LENGTH
Anthropometric dimensions
individuals and groups that would lead to changes in product design (Helander, 1997; Kroemer, 1997).
Fig. 3. Comparison between Mean Values for the Anthropometric Dimensions obtained for tertiary institution Male Students Population of Iran and Korea with the Present Study
Fig. 4. Comparison between Mean Values for the Anthropometric Dimensions obtained for institution Male Students Population of U.K and Portugal with the Present Study
Fig. 5. Comparison between Mean Values for the Anthropometric Dimensions obtained for tertiary institution Female Students Population of Turkey and China with the Present Study
SITTING HEIGHT
SITTING ELBOW REST
HEIGHT
SITTING SHOULDER
HEIGHT
KNEE HEIGHT POPLITEAL HEIGHT
STATURE BOTTOM
POPLITEAL LENGTH
HIP BREADTH EYE HEIGHT BUTTOCK KNEE LENGTH
Anthropometric dimensions
PRESENT STUDY MALE PORTUGAL MALE U.K MALE
SITTING HEIGHT
SITTING ELBOW REST HEIGHT
SITTING SHOULDER
HEIGHT
KNEE HEIGHT
POPLITEAL HEIGHT
STATURE BODY
MASS
BOTTOM POPLITEAL
LENGTH HIP BREADTH
EYE HEIGHT BUTTOCK KNEE LENGTH
FOREARM HAND LENGTH
Anthropometric dimensions
PRESENT STUDY FEMALE TURKEY FEMALE CHINA FEMALE
SITTING HEIGHT
SITTING ELBOW REST HEIGHT
KNEE HEIGHT
POPLITEAL HEIGHT
STATURE BODY
MASS
BOTTOM POPLITEAL
LENGTH HIP BREADTH
EYE HEIGHT
BUTTOCK KNEE LENGTH
FOREARM HAND LENGTH
A. I. Musa et al. / Management Science Letters 2 (2012)
1893
Fig. 6. Comparison between Mean Values for the Anthropometric Dimensions obtained for tertiary institution Female Students Population of Iran and Korea with the Present Study
Fig. 7. Comparison between Mean Values for the Anthropometric Dimensions obtained for tertiary institution Female Students Population of Portugal and U.K with the Present Study
4. Conclusions
The study reveals that chairs and tables used in our Nigeria were designed according to measurements of students from other countries which differ greatly from the Nigerian students. This data also serve as the database on the anthropometric dimensions of Nigerian tertiary institution students, which will be a very useful parameter in guiding the principle of designing future equipment(s) used in the classrooms, laboratories and lecture theatres or conference halls of tertiary institutions.
References
Adejuyigbe, S.B., & Ali, D.M. (2004). Ergonomic evaluation of furniture in Higher Institution in Nigeria, A case study of FUTA. Nigerian Journal of Industrial and System Studies (NJISS), 3(1), 24-30, Ondo Nigeria.
Barroso, M.P., Arezes, P.M., Costa, L.G., & Miguel, A.S. (2005). Anthropometric study of Portuguese workers. International Journal of Industrial Ergonomics, 35, 401-410.
Bridger, R.S, (1995). Introduction to Ergonomics. McGraw-Hill Inc., St. Louis. SITTING
HEIGHT
SITTING ELBOW REST HEIGHT
SITTING SHOULDER
HEIGHT
KNEE HEIGHT
POPLITEAL HEIGHT
STATURE BODY MASS BOTTOM POPLITEAL
LENGTH HIP BREADTH
EYE HEIGHT BUTTOCK KNEE LENGTH
FOREARM HAND LENGTH
Anthropometric dimensions
PRESENT STUDY FEMALE IRAN FEMALE KOREA FEMALE
SITTING HEIGHT
SITTING ELBOW REST
HEIGHT
SITTING SHOULDER
HEIGHT
KNEE HEIGHT
POPLITEAL HEIGHT
STATURE BODY MASS BOTTOM POPLITEAL
LENGTH
HIP BREADTH
EYE HEIGHT BUTTOCK KNEE LENGTH
Anthropometric dimensions
Scooter. International Journal of Industrial Ergonomics, 35, 1047-1063. Cuff, T. (2004). Historical anthropometrics. EH.Net Encyclopaedia.
Helander, M.G. (1997). The Human Factors Profession. In: Salvendy G (ed.) Handbook of Human Factors and Ergonomics. 3-16, John Wiley and Sons, Chichester.
Ismaila, S.O. (2009). Anthropometric Data of hand, foot, ear of University students in Nigeria.
Leonard Journal of Sciences, 15, 15-20.
Jeong, B.Y, & Park K.S. (1990). Gender differences in anthropometry for school furniture Design.
Ergonomics, 33, 1511-1521.
Kayis, B., & Ozok A.F. (1991). The anthropometry of Turkish army men. Applied Ergonomics, 22, 49-54.
Kroemer, K.H.E (1997). Engineering Anthropometry. In: Salvendy, G. (ed.) Handbook of Human Factors and Ergonomics. John Wiley and Sons, New York, 219-232.
Lee, Y.S. (2000). Applied Korean anthropometric database for product design: clothing design.
Agency for Technology and Standards, MOCIE, Seoul, Korea.
Mououdi, M.A. (1997). Static Anthropometric Characteristics of Tehran University students age 20-30. Applied Ergonomics, 28, 149-150.
Musa A.I (2011), Ergo Analysis and design of tables and chairs for use in tertiary institution in Abeokuta, Nigeria, dissertation Submitted for the award of Master of Engineering (M. Eng) in Mechanical Engineering department, Federal University of Agriculture, Abeokuta, Nigeria.
Parcells, C., Stommel, M., & Hubbard, R.P. (1999). Mismatch of classroom furniture and students body dimensions: Empirical findings and health implications. Journal of Adolescent Health, 24, 265-273.
Pheasant, S. (1998). Body space: Anthropometry, Ergonomics and the Design of Work. 2nd ed., Taylor and Francis, London.
Tunnay, M., & Melemez, K. (2008). Analysis of Biomechanical and Anthropometric parameters on Classroom furniture design”. African Journal of Biotechnology, Vol.7 (8).