Genetic variation in growth traits and yield of rubber trees (
Hevea brasiliensis
)
growing in the Brazilian state of São Paulo
Paulo de Souza Gonçalves
1, Mário Luiz Teixeira de Moraes
2, Nelson Bortoletto
3,
Reginaldo Brito da Costa
4and Elaine Cristine Pifer Gonçalves
51
Instituto Agronômico de Campinas, Programa Seringueira, Campinas, São Paulo, Brazil.
2Universidade Estadual Paulsita ‘Júlio de Mesquita Filho’, Campus Ilha Solteira, São Paulo, Brazil.
3APTA Regional Noroeste Paulista, Votuporanga, São Paulo, Brazil.
4
UCDB Programa de Desenvolvimento Local, Campo Grande, Mato Grosso do Sul, Brazil.
5APTA Regional Alta Mogiana, Colina, São Paulo, Brazil.
Abstract
Analysis of variance and covariance was preformed on growth traits (stem girth, bark thickness, total height gain and rubber yield) of 22 open-pollinated progenies of the rubber treeHevea brasiliensisfrom an AsianHeveacollection in-troduced to Agronomic Institute (Instituto Agronômico, Campinas, São Paulo, Brazil; IAC) in 1952. This progeny trial was replicated at three sites in São Paulo state and it was found that at three years from sowing there was statistically significant variation for girth, bark thickness, height and rubber yield. An individual test sites, values of individual plant heritability for girth ranged fromh$i2= 0.36 toh$
i
2= 0.89 whereas values for heritability for progeny means ranged from
$
h i
2 = 0.77 to h$
i
2 = 0.87. These moderate and high heritabilities suggest that a combination of progeny and
within-progeny selection would be effective at increasing girth in this population at individual sites. Across sites, val-ues of individual-plant heritability for girth ranged fromh$
i
2= 0.36 toh$
i
2= 0.47, whereas values for heritability of
prog-eny means girth ranged fromh$ X
2= 0.77 toh$
X
2= 0.87. There were high positive genetic correlations between increased
girth and bark thickness suggesting that breeding aimed at increasing girth would also increase bark thickness and possibly height.
Key words: Hevea brasiliensis,rubber tree, heritability, genetic parameters.
Received: September 28, 2004; Accepted: April 12, 2005.
Introduction
Given the long breeding and selection cycle of the rubber tree Hevea brasiliensis (Willd. Adr. ex Juss.) Muell.-Arg. the possibility of testing and selection at an early stage of growth in order to improve traits in adult trees is an important consideration in most breeding programs. Early testing provides the opportunity to shorten the length of the breeding cycle and increase average genetic gains per year (i.e.single-stage early selection).
Several immature stage studies have been conducted to try to understand the variation in genetic and environ-mental variances in species such asHevea(Ho, 1972, 1976, 1979; Marques and Gonçalves, 1990; Gonçalves et al.
1996, 1998a, 1998b; Moretiet al.1994; Boocket al.1995;
Costaet al.2000a, 2000b), such studies having especially helped in the development of methods for predicting the levels in variability, heritability and genotype caused by en-vironmental interactions and genetic and phenotypic corre-lations.
The effectiveness of early selection depends largely on the early-mature correlation and the heritability of juve-nile traits. In addition, genotype by environment interaction in the field tests will reduce the effectiveness of early selec-tion and also early-mature genetic correlaselec-tions. It is well know that performance of genotypes relative to each other may vary with testing environments. Genotype by environ-ment interaction is important in many aspects of a breeding program (Bridgwater and Stonecypher, 1978). Interaction in the field trials affects mature selection and also early se-lection, so when evaluating the effectiveness of early selec-tion it is imperative to determine whether or not the genotype by environment interaction among sites has a meaningful impact on early mature genetic correlation.
www.sbg.org.br
Research Article
The aim of this study was to provide further estimates of heritability of girth, total height gain, bark thickness and rubber yield in youngH. brasiliensistrees and to determine the genetic and phenotypic associations between these traits. In this study emphasis was placed on the level of ge-netic variability, heritability and genotype by environment interactions as well as genetic and phenotypic correlations and their implications on the selection and breeding of
Hevea.
Material and Methods
Plant material, field-testing and assessment
The study involved 22 open-pollinated Hevea brasiliensis (Willd. Adr. ex Juss.) Muell.-Arg. progenies that were randomly sampled from a base population of more than 100 Asian clones held at the Agronomic Institute (Instituto Agronômico, Campinas, São Paulo, Brazil; IAC) since 1952 (Gonçalves, 2002).
TheH. brasiliensisseeds were sown in the autumn in polyethylene bags (12 x 18 x 18 cm) filled with a mixture of 70% humus and 30% sand, the seedlings remaining in these pots during the first six months of the growing season be-fore being planted in the field at three sites (Votuporanga, site A; Pindorama, site B; and Jaú, site C) in the Brazilian state of São Paulo (Table 1). Throughout this paper, each experimental site is represented by a letter (A, B, C) and combinations of sites by a combination of letters. At each site a randomized complete block experimental design was used with three replications and ten-tree row plots with a spacing of 1.5 x 1.5 m between trees at sites A and C and 2 x 2 m at site B (to facilitate mechanical weeding), although for the analysis we assumed that the spacing between trees was the same at all three sites because the spacing
differ-ences were small and the trees were not competing with each other for space since the trials only considered trees with a maximum age of three years.
Field assessments of traits (height, stem girth, bark thickness and rubber yield) were first made in the autumn (April in the Southern Hemisphere) of 1995 when the seed-lings were one year old (five leaf whorl stage) with subse-quent assessments when the trees were two and three years old.
Girth (G; centimetres) was measured 10 cm from ground level when the trees were one (G1), two (G2) and three (G3) years old.
Rubber yield (Yr; grams) was determined by the Hamker-Morris-Mann test (HMM) according to the method of Tan and Subramanian (1976). Briefly, 30 half-spiral tapping were made on alternate days (1/2S d/2) 15 cm from the ground and yield recorded by cup coagulation with the ‘coagula’ being air-dried for two-months until constant weight, the performance of each tree being ex-pressed in grams per tapping.
Virgin bark plugs were removed from the trunk 20 cm above ground level on the opposite side of the tapping panel for latex vessel determination and the thickness of the bark (Bt; millimetres) was measured using microscopy.
The final height of each tree was measured when the trees were three years old and expressed as total height gain (Hg; centimetres).
Data analysis
At individual sites, the following random-effects model was used:
Yijl=m+ri+gj+grij+wijl
where:Yijl= observation on thelth plant in thejth progeny planted in theith replication;m= general mean;ri= effect due toith replication, IND (0,s$r2;gj= effect due to thejth progeny, IND (0, s$g2); grij = effect due to replication by progeny interaction, IND (0,s$gr2 );wijl= within progeny ef-fect an error associated with an observation on thelth plant injth progeny planted in theith replication, IND (0,s$w2).
Except for the general mean, all effects on the right-hand side of the model were considered random, addi-tive, independent, and normally distributed with a mean of zero and their respective variances (in parentheses). The analysis of variance (ANOVA) for this model is shown in Table 2.
For combined site analysis, the following ran-dom-effects model was used:
Yijl=m+sl+ri(l)+gi+gsjl+eij(l)+wk(l)ij,
where:Yijl= observation on thekth plant in thejth progeny planted in theith replication within thelth test site;m= gen-eral mean;sl= effect due to thelth test site, IND (0,s$s
2
);ri(l) effect due to theith replication within thelth test site, IND
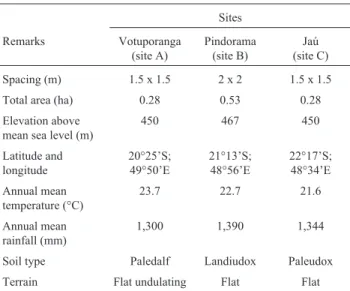
Table 1- Planting of 22 open-pollinatedHeveaprogenies at three sites in
the Brazilian state of São Paulo. The Hevea seedlings were planted at all sites in 1994 using a randomized block design, a planting density of 1 row x 10 plants (10 plants/plot) and six replicates.
Sites
Remarks Votuporanga (site A)
Pindorama (site B)
Jaú (site C)
Spacing (m) 1.5 x 1.5 2 x 2 1.5 x 1.5
Total area (ha) 0.28 0.53 0.28
Elevation above mean sea level (m)
450 467 450
Latitude and longitude
20°25’S; 49°50’E
21°13’S; 48°56’E
22°17’S; 48°34’E
Annual mean temperature (°C)
23.7 22.7 21.6
Annual mean rainfall (mm)
1,300 1,390 1,344
Soil type Paledalf Landiudox Paleudox
(0, s$r2);gi= effect due to the ith progeny, IND (0, s$g
2
);
gsjl= effect due to site by progeny interaction, IND (0,s$gs
2
);
eij(l)= residual, an effect due to replication-within-site inter-action, IND (0,s$e2);wk(l)ij= within-progeny, an error associ-ated with an observation on kth plant in thejth progeny planted in theith replication within thelth test site.
The assumptions made for the single-site model hold for the combined-sites model. The ANOVA for the com-bined-sites model is shown in Table 2.
Differences in spacing between site B and the other two sites were ignored because at the time of measurement the plants were still far apart. Because the data were unbal-anced the variances and covariances were analyzed using the ‘Genes’ computer program (Cruz, 2001).
Single-site heritabilities were estimated according to Falconer and Mackay (1996) using the following formulas:
$ $ $ $ $ $ $ $ h h kr i g
w gr g
X
g
2
2
2 2 2
2 2 4 1 = + + = s
s s s
s
s
and
w gr g
r
2 1 2 2
+ s$ +s$
where h$i
2
is the individual plant heritability, h$X2 the heritability for the progeny means,rthe number of replica-tions and k the harmonic mean of the number of plants within plots. Heritabilities for combined sites were simi-larly estimated using the following formulas:
$ $
$ $ $ $
hi p
w e gs g
2
2
2 2 2 2
4
=
+ + +
s
s s s s and
$ $
$ $ $ $
h
krs rs s
X
g
w e gs g
2
2
2 2 2 2
1 1 1
=
+ + +
s
s s s s
Standard errors of individual tree heritabilities were calculated as described by Becker (1975) and standard er-rors of the heritabilities for progeny means according to Wright (1976).
Genetic and phenotypic correlation coefficients be-tween traits were estimated from covariance and variance of respective traits as expressed in the following formulas:
rAxy r
Gxy Gx Gy Pxy Pxy Px Py = $ = $ .$ $ $ .$ s s s s s s and ,
where,rAxyis the genetic andrPxythe phenotypic correlation coefficients between any two traits, s$Gxy the genetic and
$
sPxy the phenotypic covariances between any two traits,
ands$Gx,s$Gy,s$Px ands$Py are the genetic and phenotypic
standard deviations of individual traits. Standard errors of correlation coefficients were estimated according to Rob-ertson (1959).
Results
Girth increase
At three years old (G3) the mean girth of the trees were as follows: site A mean tree girth was 25.9 cm, with the largest girthed tree being 13% above and the smallest girthed tree 31% below the mean; site B mean tree girth was 22 cm, with the largest girthed tree being 21% above and the smallest girthed tree 18% below the mean; site C mean
Table 2- Analysis of variance (ANOVA) degrees of freedom (df) and expected mean square (E.M.S.) equations for the single site and combined site
models for estimating the variance due to differences among plants within plots in a rubber tree progeny trial at three sites in the Brazilian state of São Paulo.
Source of variation d.f. M.S. E.M.S. F
Single site analysis
Replications r - 1 MS1 ( / )1 k s$2w+s$2gr+gs$r2 MS1/MS3
Progenies g - 1 MS2 ( / )1 $ $ $
2 2 2
k sw+sgr+rsg MS2/MS3
Progenies x replications (r - 1)(g - 1) MS3 ( / )1 k s$2w+s$2gr MS2/MS3
Within plot N - rg MS4 sw$2
Combined site analysis
Replication/location (r - 1)s MS1 ( / )1 k s$2w+s$2e+gs$r2 MS1/MS5
Progenies g - 1 MS2 ( / )1 $ $ $ $
2 2 2 2
k sw+se+rsgs+rssg MS2/MS4
Sites s - 1 MS3 ( / )1 $ $ $ $ $
2 2 2 2 2
k sw+se+rsgs+gsr+grss (MS3+MS5)/(MS1+MS4)
Progenies x sites (g - 1) (s - 1) MS4 ( / )1 k s$2w+s$2e+rs$gs2 MS4/MS5
Residual (mean) SN1 MS5 ( / )1 $ $
2 2
k sw+se
Within plot SN2 sw$2
$
sg2
= variance due to differences among progeny variances;sw$2
= variance due to differences among plants within progenies;ss$2
= variance due to differ-ences among sites;s$e
2
= environmental variance among plots;s$r
2
= variance due to replication within sites;s$gs
2
tree girth was 17.8 cm, with the largest girthed tree being 17% above and the smallest girthed tree 23% below the mean (percentages rounded).
The girth progeny variances were statistically signifi-cant for all the years (i.e.G1 to G3) at all test sites (Table 3). As a percentage of the total variance, progeny variance at site A increased from 14% for G1 to 15% for G3 and at site B it varied from 13% for G1 to 17% for G3 but showed no clear trend at site C (20% for G1, 22% for G2 and17% for G3). Across sites, progeny variance decreased from about 9% of the total variance for G1 to 4% for G2 and 1% for G3.
Heritability estimates for girth (Table 3) showed trends similar to those for progeny variance, decreasing at site A between G1 and G2 but increasing between G2 and G3, while at site B heritability increased with plant age and declined with plant age at site C. Across sites, heritability for individual plant girth increased between the same ages. On the other hand, heritability for progeny means girth re-mained constant between G1 and G2 and then increased be-tween ages G2 and G3. Generally, except for G2 at site A (
$
hi
2
= 0.44), the heritability for individual plant girth was greater thanh$i
2
= 0.50 whereas the heritability for progeny means was greater thanh$i2
= 0.75. At all sites and across sites, the standard errors of individual plant heritability esti-mates for girth were less than or equal to 50% of the heritability estimates. Standard errors of heritability esti-mates for progeny means were less than 25% of heritability estimates.
Rubber yield, bark thickness and height growth
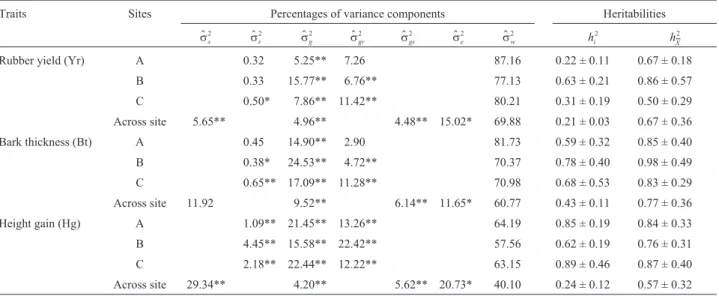
The average rubber yield (Yr) was 0.62g at site A, 0.99g at site B and 0.94g at site C. The Yr progeny variance was statistically significant at the three sites, being about 5% at site A, 16% at site B and 8% at site C (Table 4). The Yr progeny variance by replication interaction for site A was low compared to sites B and C and the standard error of individual plant heritability at the site A was 50% of the heritability value
Mean bark thickness (Bt) was 3.75 mm at site A, 3.85 mm at site B and 3.76 mm at site C. As a percentage of the total Bt variance the Bt progeny variance was statisti-cally significant at the three sites, being about 15% at site A, 25% at site B and 17% at site C. Generally, heritability estimates for individual plant Bt were higher than
$
hi
2
= 0.50, and those of progeny means exceededh$i
2
= 0.70 (Table 4). Standard errors of heritabilities for individual tree Bt were slightly greater than 50% of heritability esti-mates. On the other hand, the standard error was almost equal to the heritability estimate at site C.
Height growth (Hg) averaged 311 cm at site A, 261 cm at site B and 208 cm at site C. The Hg progeny variance was statistically significant both at all sites and across sites (Table 4), progeny variance being about 21% of the total variance at site A, 16% at site B and 22% at site C. Individ-ual Hg plant heritability estimates were betweenh$i
2
= 0.62 andh$i2
= 0.89 whereas those of the progeny means were be-tween 0.76 and 0.87 (Table 4).
Table 3- Site-related percentages of the variance components and heritabilities for increased girth in 22 open pollinatedHeveaprogenies growing at
three sites (Votuporanga (A), Pindorama (B) and Jaú (C)) in the Brazilian state of São Paulo. Girth measured when the trees were one (G1), two (G2) and three (G3) years old.
Girth Sites Percentages of variance components Heritabilities
$
ss
2 $
sr
2 $
sg
2 $
sgr
2 $
sgs
2 $
se
2 $
sw
2
hi
2
hX2
G1 A 3.18** 13.88** 11.66** 71.28 0.67 ± 0.11 0.77 ± 0.13
B 5.11** 12.51** 10.53** 71.84 0.50 ± 0.06 0.80 ± 0.07
C 0.98** 19.84** 15.03** 64.15 0.79 ± 0.08 0.83 ± 0.09
Across 13.70 2.57 8.70** 3.71* 18.68* 52.62 0.41 ± 0.03 0.77 ± 0.06
G2 A 3.58** 11.04** 6.58** 78.79 0.44 ± 0.08 0.77 ± 0.10
B 2.60** 15.45** 24.00** 57.94 0.61 ± 0.08 0.75 ± 0.09
C 2.87** 22.37** 13.77** 60.98 0.89 ± 0.09 0.86 ± 0.09
Across 10.10 3.00 4.36** 3.63* 13.02* 65.90 0.36 ± 0.03 0.80 ± 0.06
G3 A 1.06** 14.94** 1.56 83.29 0.56 ± 0.11 0.86 ± 0.13
B 0.31* 16.70** 6.32** 76.66 0.67 ± 0.09 0.86 ± 0.11
C 0.52** 16.75** 7.73** 75.00 0.67 ± 0.09 0.85 ± 0.10
Across 13.10 3.19* 1.08 3.14* 11.70 67.73 0.4 ± 0.06 0.87 ± 0.12
* (p < 0.05); ** (p < 0.01); variance components are as follows:ss$2= variance due to differences among plants within progenies;$
sr2= variance due to rep-lication within sites;sg$2
= variance due to differences among progeny;sgr$2
= variance due to interaction of progeny and replication;sgs$2
= variance due to interaction of progeny and site;se$2= environmental variance among plots;sw$2= variance due to differences among plants within progenies;hi
2
= individ-ual plant heritability;hX
2
Genotype by environment interaction
Analysis of variance showed that the genotype by en-vironment (GE) interaction was statistically significant for G1, G2, G3, Yr, Bt and Hg (Table 3 and 4). Generally, the GE interaction variance slightly decreased from G1 to G2 and G2 to G3. Genetic correlations between sites were high. Very low Pearson’s correlation coefficients for prog-eny means (Table 5) also indicate the existence of high GE interaction between pairs of test sites.
Genetic and phenotypic correlations
Age to age genetic and phenotypic correlations for girth were betweenr$= 0.79 andr$= 0.97 at individual sites andr$= 0.96 tor$= 0.99 across sites. At all three sites and
across sites, genetic correlations were slightly greater than the corresponding phenotypic correlations (Table 6). At in-dividual sites and across sites, genetic and phenotypic cor-relations between increased girth and rubber yield were betweenr$= 0.15 andr$= 0.92 with few exceptions, genetic correlations between girth and rubber yield being greater than the corresponding phenotypic correlations (Table 6). At site A, bark thickness was positively genetically corre-lated with girth (r$Axy = 0.60 to$rAxy= 0.71) and rubber yield
($rAxy =0 20 . The phenotypic correlations for bark thickness. ) with girth and rubber yield at this site were also positive but weak. Across sites, rubber yield did not correlate geneti-cally or phenotypigeneti-cally with girth, bark thickness or height gain.
Table 4- Site-related percentages of variance components and heritabilities for rubber yield, bark thickness and height gain in 22 open-pollinatedHevea
progenies growing at three sites (Votuporanga (A), Pindorama (B) and Jaú (C)) in the Brazilian state of São Paulo.
Traits Sites Percentages of variance components Heritabilities
$
ss2 $
sr2 $
sg2 $
sgr2 $
sgs2 $
se2 $
sw2
hi
2
hX
2
Rubber yield (Yr) A 0.32 5.25** 7.26 87.16 0.22 ± 0.11 0.67 ± 0.18
B 0.33 15.77** 6.76** 77.13 0.63 ± 0.21 0.86 ± 0.57
C 0.50* 7.86** 11.42** 80.21 0.31 ± 0.19 0.50 ± 0.29
Across site 5.65** 4.96** 4.48** 15.02* 69.88 0.21 ± 0.03 0.67 ± 0.36
Bark thickness (Bt) A 0.45 14.90** 2.90 81.73 0.59 ± 0.32 0.85 ± 0.40
B 0.38* 24.53** 4.72** 70.37 0.78 ± 0.40 0.98 ± 0.49
C 0.65** 17.09** 11.28** 70.98 0.68 ± 0.53 0.83 ± 0.29
Across site 11.92 9.52** 6.14** 11.65* 60.77 0.43 ± 0.11 0.77 ± 0.36
Height gain (Hg) A 1.09** 21.45** 13.26** 64.19 0.85 ± 0.19 0.84 ± 0.33
B 4.45** 15.58** 22.42** 57.56 0.62 ± 0.19 0.76 ± 0.31
C 2.18** 22.44** 12.22** 63.15 0.89 ± 0.46 0.87 ± 0.40
Across site 29.34** 4.20** 5.62** 20.73* 40.10 0.24 ± 0.12 0.57 ± 0.32
* (p < 0.05); ** (p < 0.01); variance components are as follows:ss$2
= variance due to differences among plants within progenies;sr$2
= variance due to replication within sites;sg$2= variance due to differences among progeny;sgr$2 = variance due to interaction of progeny and replication;sgs$2 = variance due to interaction of progeny and site;se$2 = environmental variance among plots; $
sw2 = variance due to differences among plants within progenies;
hi
2
= individual plant heritability;hX2
= heritability for progeny means.
Table 5- Genetic and Pearson’s correlation coefficients between sites for sixHeveatraits in 22 open-pollinated progenies ofHeveagrowing at three sites
(Votuporanga (A), Pindorama (B) and Jaú (C)) in the Brazilian state of São Paulo. Girth measured when the trees were one (G1), two (G2) and three (G3) years old.
Site A and B Site A and C Site B and C
Traits r$g r$f r$g r$f r$g $rf
Girth
G1 0.5401** 0.1770 0.7826** 0.3341 0.8616** 0.2803
G2 0.7062** 0.1842 0.8547** 0.2860 NA 0.1323
G3 0.7692** 0.4721* 0.8953** 0.4828* 0.9928** 0.4706*
Other traits
Rubber yield (Ry) 0.6563** 0.3422 0.9445** 0.2454 0.7728** 0.0667
Bark thickness (Bt) 0.8901** 0.5907** 0.3920 0.2679 0.5254* 0.2320
Height gain (Hg) 0.1056 0.0881 0.8311** 0.3829 0.2223 0.1785
Discussion
Performance at individual sites and across sites
At all sites, there was a significantly large progeny by replication for G1, G2 and height. High progeny by replica-tion interacreplica-tion was also reflected in significantly large re-sidual variances across sites. This high progeny by replication interaction could have been the result of within site heterogeneity in soil and moisture, and their influence on the microclimate of the rubber trees (Bataglia et al.,
1998).
In this study, all traits at individual sites and G2, G3, Yr and Bt showed high within-progeny variability as re-flected by the high percentages of within progeny variance. This high variability among trees in open pollinated proge-nies might be an indicator of many effective pollen parents (Gonçalveset al.,1999)
Heritabilities and their implications
With three exceptions individual plant heritabilities estimated in this study were less thanh$i
2
= 0.3 and herita-bilities for progeny means were equal to or greater than 0.5 for all traits. Therefore, heritability values especially for in-dividual trees were on the lower side. Nevertheless, heritabilities estimated in this study were within the range of those estimated in other studies ofHevea. For example, except for two cases where heritabilities ofh$i
2
= 0.14 and $
hi
2
= 0.48 were estimated, Costaet al.(2000c) found that heritabilities for individual plant girth exceedh$i
2
= 0.30.
Other reported heritability values for girth inHeveainclude $
hi
2
= 0.32 (Moretiet al., 1994) andh$i
2
= 0.47 (Boocket al., 1995; Gonçalveset al., 1999). The low values for individ-ual plant heritability in our study could be attributable to large progeny by replication interaction and within progeny variances compared with the progeny variances. Likewise, large values of progeny by site interaction, residual- and withprogeny variances (especially for girth) reduced in-dividual plant heritabilities across sites.
Implications of the genetic correlations
High age-to-age genetic correlations between girths at age one and three suggest that selection for fast growing rubber trees can be done early in the life of the tree. How-ever, two years is too short a time to make significant changes in progeny ranks with plant age for the tested prog-enies, and caution should be exercised when interpreting such genetic correlations because they might be lower when longer intervals are involved. Gonçalves et al.
(1998b), for example, found that forHeveathe genetic cor-relation for girth at 12 and 96 months wasr$g = 0.37 while the value for girth at 48 and 96 months wasr$g = 0.86, indi-cating that the ranking of genotypes at 12 months was dif-ferent from the ranking of the same genotypes at 96 months of age. In one case, however, Tan (1987) observed a corre-lation ofr$g = 0.77 between rubber yield (Yr) at a nursery stage and rubber yield at five years of age. Ato-age ge-netic correlation is important in early selection and should therefore, be monitored in future assessments of these prog-eny tests.
Table 6- Site-related genetic (r$
a) and phenotypic (r$p) correlations between traits (rubber yield (Yr), bark thickness (Bt) and height gain (Hg)) in 22
open-pollinated progenies ofHeveagrowing at three sites (Votuporanga (A), Pindorama (B) and Jaú (C)) in the Brazilian state of São Paulo. Girth measured when the trees were one (G1), two (G2) and three (G3) years old.
Traits Site A Site B Site C Across sites
$
ra r$p r$a r$p r$a $rp r$a r$p
G1 & G2 0.8838 ± 0.01 0.8174 0.9792 ± 0.04 0.4253 0.9552 ± 0.01 0.7089 0.9897 ± 0.01 0.7623
G1 & G3 0.7863 ± 0.04 0.7465 NA 0.4455 0.90 ± 0.03 0.7197 0.9940 ± 0.18 0.7140
G2 & G3 0.8689 ± 0.02 0.7560 0.8908 ± 0.02 0.6891 NA 0.7272 0.9694 ± 0.05 0.8088
G1 & Yr 0.1950 ± 0.15 0.1148 0.7908 ± 0.32 0.3533 0.7561 ± 0.16 0.3891 0.5271 ± 0.20 0.3565
G2 & Yr 0.1535 ± 0.11 0.1087 0.3650 ± 0.01 0.4700 0.9282 ± 0.13 0.4635 0.4524 ± 0.25 0.4176
G3 & Yr 0.4107 ± 0.07 0.3030 0.4444 ± 0.17 0.4422 0.7925 ± 0.15 0.3690 0.5239 ± 0.11 0.4655
G1 & Bt 0.7060 ± 0.15 0.5618 0.8138 ± 0.21 0.3761 0.9162 ± 0.21 0.5950 0.8097 ± 0.16 0.6468
G2 & Bt 0.7096 ± 0.11 0.5836 0.8024 ± 0.31 0.5941 NA 0.5432 0.8483 ± 0.11 0.7252
G3 & Bt 0.6184 ± 0.10 0.6345 0.7126 ± 0.20 0.5981 0.9209 ± 0.12 0.7361 0.7788 ± 0.88 0.7145
G1 & Hg 0.7514 ± 0.09 0.5843 0.7135 ± 0.02 0.8216 0.9163 ± 0.16 0.6888 0.7990 ± 0.29 0.5255
G2 & Hg 0.9121 ± 0.01 0.7920 0.8215 ± 0.16 0.7110 NA 0.7039 0.8259 ± 0.17 0.5788
G3 & Hg 0.7700 ± 0.05 0.5673 0.6203 ± 0.12 0.5841 0.9208 ± 0.11 0.6865 0.8491 ± 0.16 0.5074
Yr & Bt 0.2045 ± 0.29 0.2319 0.4010 ± 0.09 0.4149 0.3112 ± 0.20 0.1792 0.4367 ± 0.17 0.3752
Yr & Hg 0.1081 ± 0.23 -0.0218 0.0108 ± 0.33 -0.0991 0.8545 ± 0.22 0.3014 0.4010 ± 0.14 0.2045
Bt & Hg 0.5385 ± 0.53 0.4952 -0.4021 ± 0.35- -0.1544 0.6833 ± 0.12 0.5047 0.4420 ± 0.42 0.3370
The high positive genetic correlations between in-creased girth and bark thickness (Bt) suggests that selection for increased girth would result in plants with thick virgin bark, which might be favorable forHeveabecause thicker virgin bark would minimize the incidence of wounding known to affect the yield productivity of later panels. The strong association between increased girth and bark thick-ness means that breeders can select for thick bark to im-prove girth growth without suppressing height gain,i.e.one way of improving bark thickness would be to select for in-creased girth rather than height gain.
In our study, height gain (Hg) was positively geneti-cally correlated with rubber yield and bark thickness at site C. Considering the size of the standard errors, the positive (site A) and negative (site B) genetic correlations between height gain and rubber yield and bark thickness at sites B, C and across sites were negligible (Table 5). On the other hand the phenotypic correlations show a universal picture of the relationship between height gain and bark thickness. All the three sites and across sites phenotypic correlations show that height gain had low positive correlations with bark thickness. This supports the argument of Marques and Gonçalves (1990) that inHeveaheight gain has no causal relationship with rubber yield related traits.
In summary, our major findings were as follows: a) Heritability values for girth growth were moderately high on individual sites and low across sites, so to achieve suffi-cient genetic gain in increased girth a combination of prog-eny and within-progprog-eny selection would be require; b) Girth exhibited a genotype by environment GE interaction which was almost entirely due to the different ranking of progenies across sites, which means that in São Paulo state breeding Asian Hevea populations for increased girth would require the development of site specific genotypes as opposed to regionally adapted ones; and c) There were high positive genetic correlations between increased girth and bark thickness, suggesting that breeding to increase girth would increase bark thickness and possibly height gain. For
Hevea,a high positive correlation between increased girth and bark thickness is favorable, since a thick bark is needed to minimize the incidence of wounding in the stem panel. However, if vigor became an option for theseHevea popu-lations, increased girth would lead to a reduction in rubber yield due to the absence of correlation between girth and rubber yield.
Acknowledgements
The authors would like to thank the Brazilian agen-cies FAPESP for financial support and CNPq for the fel-lowship granted to PSG
References
Bataglia OC, Santos WR dos, Igue T and Gonçalves PS (1998) Resposta da seringueira clone RRIM 600 a adubação NPK
em solo podzólico vermelho-amarelo. Bragantia 57:367-377.
Becker WA (1975) Manual of Quantitative Genetics. Washington State University Press, Washignton, 220 pp.
Boock MV, Gonçalves PS, Bortoletto N and Martins ALM (1995) Herdabilidade, variabilidade genética e ganhos genéticos para produção e caracteres morfológicos em progênies jo-vens de seringueira. Pesq Agrop Bras 30:673-681. Bridgwater FE and Stonecypher RW (1978) Genotype x
environ-ment interaction: Implications in tree breeding programs. Proc. Fifth North American Forest Biology Workshop Uni-versity of Florida, Gainsville, pp 150-165.
Costa RB da, Resende MDV de, Araujo AJ de, Gonçalves PS and Silva M de A (2000a) Maximization of genetic gain in rub-ber tree (Hevea) breeding with effective size restriction. Genet Mol Biol 23:457-462.
Costa RB da, Resende MDV de, Araujo AJ de, Gonçalves PS and Higa AR (2000b) Selection and genetic gain in rubber
(Hevea) populations using a mixed mating system. Genet
Mol Biol 23:671-679.
Costa RB, Resende MDV de, Araujo AJ de, Gonçalves PS and Martins ALM (2000c) Genotype-environment interaction and the number of test sites for the genetic improvement of rubber trees (Hevea) in São Paulo State, Brazil. Genet Mol Biol 23:179-187.
Cruz CD (2001) Programa Genes: Versão Windows Aplicativo Computational em Genética e Estatística. Editora UFV, Vi-çosa, 648 pp and CD-ROM.
Falconer DS and Mackay TFC (1996) Introduction to Quantita-tive Genetics. Longman, New York, 320 pp.
Gonçalves PS, Bortoletto N, Fonseca F da S, Bataglia OC and Ortolani AA (1998a) Early selection for growth vigor in rub-ber tree genotypes in northwestern São Paulo State (Brazil). Genet Mol Biol 21:515-521.
Gonçalves PS, Bortoletto N, Santos WR dos, Ortolani AA, Got-tardi MVC and Martins ALM (1998b) Avaliação genética de progênies em meios-irmãos de seringueira em diferentes regiões do Estado de São Paulo. Pesq Agrop Bras 33:1085-1095.
Gonçalves PS, Furtado EL, Bataglia OC, Ortolani AA, May A and Belletti GO (1999) Genetics of anthracnose panel canker disease resistance and its relationship with yield growth characters in half-sib progenies of rubber tree (Hevea
brasiliensis). Genet Mol Biol 22:583-589.
Gonçalves PS, Martins ALM, Bortoletto N and Tanzini MR (1996) Estimates of genetic parameters and correlations of juvenile characters based on open pollinated progenies of
Hevea. Braz J Genet 19:105-111.
Gonçalves PS (2002) Uma história de sucesso: A seringueira no Estado de São Paulo. O Agronômico, Boletim Técnico 54:6-10.
Ho CY (1976) Clonal characters determining the yield ofHevea
brasiliensis. Proc of the Inter Rub Conf, Kuala Lumpur,
Ma-laysia, 1975, pp 17-18.
Ho CY (1972) Investigations on shortening the generative cycle for yield improvement inHevea brasiliensis.Master of Sci-ence Dissertation, Cornell University, New York, 132 pp. Marques JRB and Gonçalves PS (1990) Testes precoces de
Moreti D, Gonçalves PS, Gorgulho EP, Martins ALM and Borto-letto N (1994) Estimativas de parâmetros genéticos e ganhos esperados com a seleção de caracteres juvenis em progênies de seringueira. Pesq Agrop Bras 29:1099-1109.
Robertson A (1959) The sampling variance of the genetic correla-tion coefficient. Biometrics 15:469-485.
Tan H (1987) Strategies in rubber tree breeding. In: Abbott AJ and Atkin RK (eds) Improving Vegetatively Propagated Crops. Academic Press Limited, New York, pp 27-62.
Tan H and Subramanian S (1976) A five-parent dialell cross anal-ysis for certain characters of youngHeveaseedling. Proc of International Rubber Conference, 1975, RRIM Kuala Lum-pur, pp 13-16.
Wright JW (1976) Introduction to Forest Genetics. Academic Press, New York, 463 pp.