UNIVERSIDADE FEDERAL DO CEARÁ CENTRO DE CIÊNCIAS
DEPARTAMENTO DE QUÍMICA ANALÍTICA E FÍSICO-QUÍMICA PROGRAMA DE PÓS-GRADUAÇÃO EM QUÍMICA
RAFAEL MELO FREIRE
MAGNETIC NANOPARTICLES AND CARBON QUANTUM DOTS:
INTERDISCIPLINARY NANOPARTICLES FOR SENSING AND/OR EDUCATION
RAFAEL MELO FREIRE
MAGNETIC NANOPARTICLES AND CARBON QUANTUM DOTS:
INTERDISCIPLINARY NANOPARTICLES FOR SENSING AND/OR EDUCATION
Doctoral thesis submitted to the Programa de Pós-graduação em Química of the Universidade Federal do Ceará as a requirement for the degree of doctor of chemistry. Area: Inorganic Chemistry
Advisor: Prof. Dr. Pierre Basílio Almeida Fechine
Dedication
Firstly, I would like to thank God for all opportunities in my personal and professional ways. I am very thankful for each one I have passed through, which also includes the unsuccessful ones. Since I was able to learn and become a better man and professional. Secondly, my family was really important. The constant support, as well as the unconditional love were the most important features to make me move forward. My wife, Maria Socorro Gonçalves da Costa, and my daughter, Ana Maria Gonçalves Freire, are the fuel to make me get up in the morning, the fuel that makes me want to be a better person and researcher. My father, Jonivaldo Freire de Souza, the person who always is there to provide the support I need. My brother, Tiago Melo Freire, for the support as well, but the valorous friendship too. I cannot forget his fiancé, Jessica Miranda Abreu, who also support me when I need.
From the Universidade Federal do Ceará, I would like to express my sincerest gratitude to my advisor and one of my best friends, Pierre Basílio Almeida Fechine. No doubt, his patient to guide me in the way to obtain the master and doctor degree was essential to make me the researcher I am today. Furthermore, I should say be the one of the Pierre’s students for 6 years was extremely pleasant. All our conversation, as well as his advices to me when I needed were so valuables. I am quite sure I would be a different person today if I was not one of the Pierre’s students. Other professors of the chemistry course were also important. In special, I would like to thank the Professors Antoninho Valentini and Elisane Longhinotti for their support and advices. I could not forget my advisor from University of Massachusetts – Amherst, MA, United States, Vince M. Rotello, who changed my vision about the research. Upon my period in his laboratory, I am a better researcher for sure.
Maybe, having so many good people around me be the key to make the life less stressful, the key to make the life much more enjoyable.
I would like to thank the Universidade Federal do Ceará itself. I am very grateful for the opportunity to learn chemistry. Furthermore, the Universidade Federal do Ceará was the place I met my wife for the first time. For this, I have no words to express my feelings given the huge impact in my life. I could not forget to be thankful for the structural and financial support to keep my research always on. In this sense, I also thank Coordenação de Aperfeiçoamento de Pessoal de Nível Superior (CAPES) and Conselho Nacional de Desenvolvimento Científico e Tecnológico (CNPq) for the fellowships provided during 6 years, which makes possible the dream to be a doctor.
Finally, once again I thank my family for all unconditional support and love, but I would like to make a special acknowledgement to my mother, Maria do Rosario Melo. She is not with me anymore in Earth since 2013. However, I am quite sure she is very proud of me for what I have been done in my life, but I must be grateful to have her example in my life. All her life work was valuable for my professional career.
Neste trabalho, uma estratégia para detecção e identificação de proteínas incluindo nanopartículas magnéticas (MNPs) e pontos quânticos de carbono (CQDs) foi desenvolvida. Assim, ferritas mistas de fórmula M0.5Zn0.5Fe2O4 (M=Mn or Ni) foram inicialmente investigadas. Neste sentido, suas sínteses foram feitas utilizando diferentes condições (solvente, tempo reacional e concentração de base). Logo, baseado nas propriedades magnéticas das MNPs sintetizadas, escolheu-se a Mn0.5Zn0.5Fe2O4 (MnZn) sintetizada em água por mostrar grande potencial, uma vez que essa amostra apresentou alto valor de magnetização de saturação (MS 50 emu/g) em comparação com outras ferritas de composição semelhante, baixo tamanho de cristalito por volta de 12 nm e comportamento superparamagnético. Com a primeira parte do trabalho concluída, a próxima etapa foi encontrar uma sonda fluorescente. Assim, realizou-se a síntese dos CQDs funcionalizados com grupamentos amina (CQDs.BPEI). Quando testada contra 8 diferentes proteínas (4 metálicas e 4 não-metálicas), apresentou variação da emissão para concentrações na faixa de 5 – 40 nM. Titulações fluorescentes também foram realizadas e observou-se que a supressão da fluorescência ocorre via mecanismo colisional a partir de resíduos aminoácidos na superfície da proteína. Para adicionalmente checar o potencial dos CQDs.BPEI, foi desenvolvida abordagem para identificar proteínas utilizando materiais Cu2+ e o ácido etilenodiamino tetra-acético. No total, a estratégia desenvolvida foi capaz de identificar corretamente 6 diferentes proteínas a 40 nM. A precisão da identificação encontrada foi 90% para as amostras desconhecidas. Contudo, vale ressaltar que os 10% de engano foram apenas entre BSA e HSA, duas proteínas albumínicas muito similares. Os resultados obtidos nessa parte do trabalho evidenciam o alto potencial de CQDs.BPEI para detecção e identificação de proteínas. Observando os resultados do trabalho como um todo, pode-se afirmar que MnZn e CQDs.BPEI são capazes de compor excelente abordagem para detecção e identificação de proteínas. Adicionalmente, foi explorada a utilidade dos CQDs para o campo educacional. Dessa forma, foi também desenvolvido e aplicado (mais de 70 estudantes de graduação oriundos dos cursos de biotecnologia, farmácia, engenharias e geologia) um experimento de laboratório para demonstrar fenômenos quânticos relacionados com a luz.
In this work, a sensing strategy for detection and identification of proteins with magnetic nanoparticles (MNPs) and carbon quantum dots (CQDs) was developed. In this sense, mixed ferrites of general formula M0.5Zn0.5Fe2O4 (M=Mn or Ni) were first investigated. Therefore, the hydro/solvothermal synthesis of these magnetic nanoparticles was performed under different conditions (solvent, reaction time and base concentration). Based on the magnetic properties of the two MNPs investigated, the mixed ferrite of formula Mn0.5Zn0.5Fe2O4 (MnZn) synthesized using water showed the greatest potential for sensing. Since among all synthesized MNPs, this sample displayed the highest saturation magnetization value (MS 50 emu/g), lower crystallite size around 12 nm and superparamagnetic behavior. Once the first part of the doctoral thesis was concluded, the next step was to find a fluorescence probe. In this regard, it was performed the synthesis, as well as the application of branched poliethylenimine-functionalized carbon quantum dots (CQDs.BPEI). These new carbon-based nanoparticles were found to be protein-responsive. Since CQDs.BPEI were able to detect eight different proteins (four metallic and four non-metallic) even using concentrations in the range of 5 – 40 nM. Fluorescence titrations performed at 298 and 310 K displayed the fluorescence quenching through collisional mechanism. Therefore, it was also possible to conclude that the fluorescence quench comes from the amino acid residues on the surface of the proteins. To further check the potential of the CQDs.BPEI, it was developed a “nose” based methodology to identify proteins. Using materials as cheap as Cu2+ and ethylenediaminetetraacetic acid, the chemical “nose” approach was able to discriminate six different proteins at 40 nM concentration in phosphate buffered saline (PBS, pH 7.4). The identification accuracy of the random unknown set was 90% with all misclassification occurring for albumin proteins (e.g., Bovine Serum Albumin and Human Serum Albumin). The displayed results evidence the great potential of CQDs.BPEI as a protein-responsive probe to detect and identify proteins. Taken together, MnZn and CQDs.BPEI were capable to build up a powerful protein sensing approach. In addition, realizing the great potential of CQDs in the educational field, it was also developed and successfully applied (for more than 70 students from from biotechnology, pharmacy, engineers and geology courses) a lab experiment to demonstrate light-related quantum phenomena.
Figure 1.1. Applications of MNPs in different technological fields ……….……… 17 Figure 1.2. Schematic illustration of luminescence modulation via Förster resonance energy transfer (FRET) within the context of pattern recognition based on competitive binding between indicator and anionic analyte on the surface of the lanthanide (Ln3+
)-doped NPs ……….... 21
Figure 1.3. Illustration presenting CQDs properties, as well as potential research fields 22 Figure 2.1. XRD for samples of the system (H2O)1-x:(EG)x, where x denotes the amount of the EG used to compose the solvent. The corresponding x values are reported in each diffractogram. The black dots reveal the experimental data, while the red line denotes the calculated data. The green line displays the difference between experimental and
calculated data……….………. 37
Figure 2.2. Particle size describe in function of the x values, which denotes the amount of the EG used to compose the solvent………...……... 38 Figure 2.3. Results of the stabilization test for different precursors metallic used in the synthesis. On the left side of each series of tests the relative metalis reported. The x values for the system (H2O)1-x:(EG)x are presented only in the case of Zn series, but can be straightforwardly expanded for Mn and Fe ………..………... 40 Figure 2.4. IR spectra of the tests realized with different x in the system
((H2O)1-x:(EG)x) for metallic precursors ………... 41 Figure 2.5. FTIR for samples of the system (H2O)1-x:(EG)x, where x denotes the amount of the EG used to compose the solvent. The corresponding x values are reported in each
spectrum……… 42
Figure 2.6. K values for tetrahedral (KT) and octahedral (KO) site plotted as a function
of x……….. 44
Figure 2.7. Mössbauer spectra (left) and quadrupole (Δ) distribution (right) for samples of the system (H2O)1-x:(EG)x, where x denotes the amount of the EG used to compose the solvent. The corresponding x values are reported beside
reports plotted as a function of the ………. 48
Figure 2.9. Zero field cooled-field cooled curves of samples with x = 0, 0.4 and 1.0 … 49 Figure 2.10. TEM micrographs for samples of the system (H2O)1-x:(EG)x, where x denotes the amount of the EG used to compose the solvent. The corresponding x values are reported in the image.……….. 51
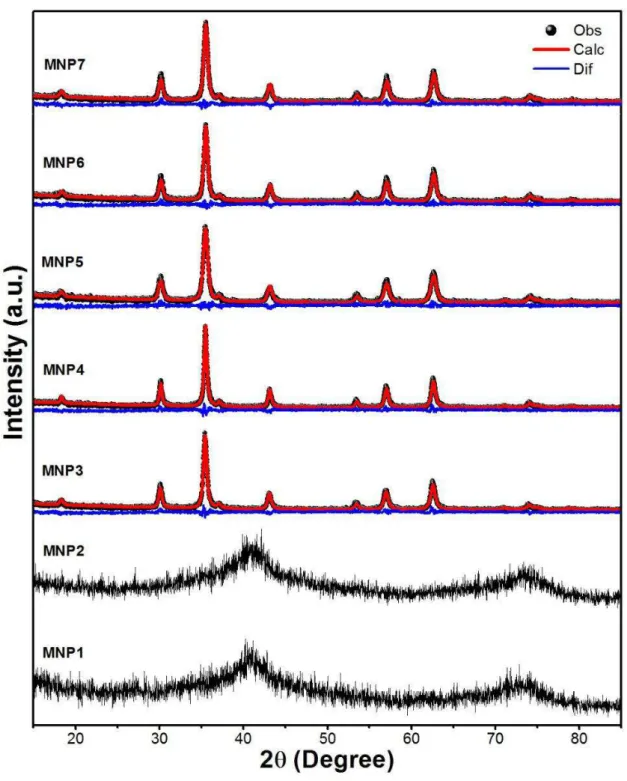
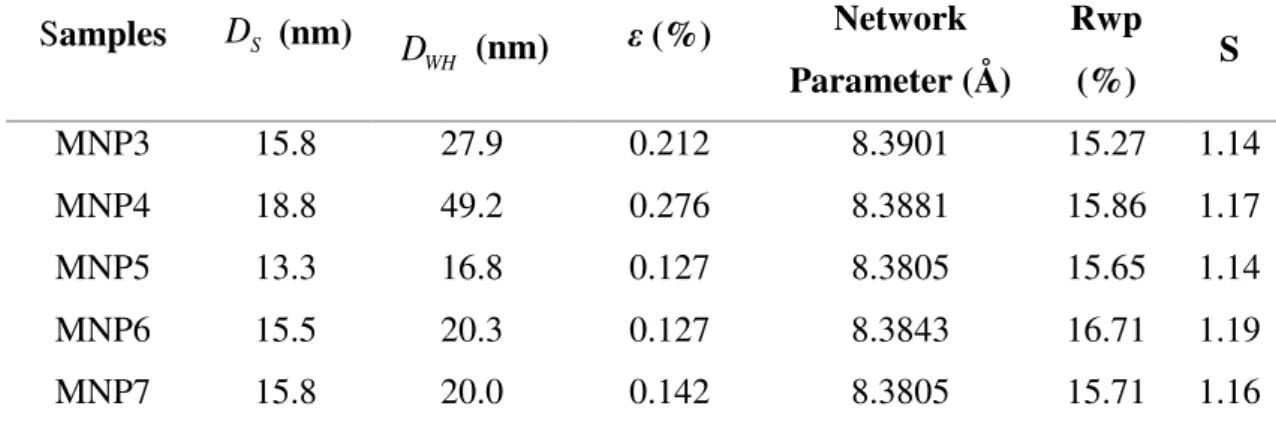
Figure 3.1. PXRD patterns for samples MNP1 – 7 as well as the fit made using the Rietveld Method ………...……… 65
Figure 3.2. FT-IR for samples MNP1 – 7 ……… 69
Figure 3.3. Mössbauer spectrum for MNP3 – 7 ……….. 71
Figure 3.4. Size distribution graph for MNP3 – 7. The black solid line denotes the distribution curve made using a normal distribution to fit the data ………. 74
Figure 3.5. High magnification TEM images for samples MNP3 – 7………. 76
Figure 3.6. Magnetization curves at 300 and 5K for MNP3 – 7 ………. 78
Figure 3.7. ZFC/FC measurements for MNP3 – 7 ……….. 82
Figure 4.1. TEM image of CQDs.BPEI. Inset: distribution size graph based on the measurements of 150 particles randomly chosen ………. 95
Figure 4.2. Surface properties of CQDs.BPEI. (a) FT-IR spectrum of CQDs.BPEI. XPS analysis (c) Survey scan, (d) C1s analysis and (e) N1s analysis ……….. 96
Figure 4.3. Optical properties of CQDs.BPEI. (a) UV/Vis absorption spectra of CQDs.BPEI. (b) The excitation-wavelength independent fluorescence spectra of CQDs.BPEI. (c) Fluorescence intensity as function of pH values and (d) Photobleaching experiment: fluorescence intensity recorded during 60 min at room temperature ……… 97
Figure 4.4. Fluorescence response of the CQDs.BPEI upon addition of protein at 40 nM (concentration in the well) ………..………... 99
Figure 4.5. Fluorescence titration performed at 298 and 310K for non-metallic (a) and metallic (b) proteins ………..………... 101
Figure 5.1. Normalized fluorescence intensity of the CQDs.BPEI (2 µg.mL-1) against 250 µM of several metal ions in PB 5 mM (pH 7.4) ……….. 123
Figure 5.2. Fluorescence titration performed at 298 K for Cu2+ ………. 124 S
developed in this work. I and II denote two different 96-well plates. As it can be seen, the plate I was used to obtain the first discrimination event. The second and third
interactional events were obtained in the plate II ………. 125 Figure 5.4. Detection of metallic proteins in PB 5 mM (pH 7.4). (left) Fluorescence
response pattern of the proteins evaluated. Each value of average as well as standard deviation was calculated based on 6 replicates. (right) Canonical score plot for the
fluorescence patterns as obtained from LDA clustering process ……….. 127 Figure 5.5. Detection of non-metallic proteins in PB 5 mM (pH 7.4). (left) Fluorescence
response pattern of the proteins evaluated. Each value of average as well as standard deviation was calculated based on 6 replicates. (right) Canonical score plot for the
fluorescence patterns as obtained from LDA clustering process ………. 129 Figure 5.6. LDA plots for metallic proteins using the concentration as a parameter to
be classified ……….. 130
Figure 5.7. Canonical score plots for non-metallic proteins using the concentration as
a parameter to be classified ………. 131
Figure 5.8. Canonical score plots classifying eight proteins at different concentrations
(10, 20 and 40 nM) ……….. 133
Figure 5.9. Schematic picture illustrating the one-plate “nose”-based strategy
developed in this work ………. 134
Figure 5.10. Detection of eight different proteins in PB 5 mM (pH 7.4). (a) Fluorescence response pattern of the proteins evaluated. Each value of average as well as standard deviation was calculated based on 6 replicates. (b) Canonical score plot for the fluorescence patterns as obtained from LDA utilizing the two most significant
factors ………... 135
Figure 5.11. Detection of eight different proteins in PBS. (a) Fluorescence response pattern of the proteins evaluated. Each value of average as well as standard deviation was calculated based on 6 replicates. (b) Canonical score plot for the fluorescence
concentrations. Fluorescence response pattern obtained spiking the proteins tested in 0.1 (b), 0.5 (c) and 1% (V/V) (d) human serum concentrations. Each value of average
as well as standard deviation was calculated based on 6 replicates ………. 138 Figure 5.13. Optimization of the conditions for the one-plate methodology in 1% (V/V)
human serum. (a) Improvement of the amount of CQDs.BPEI and (b) Cu2+ fluorescence
titration performed at 298 K ………. 139
Figure 5.14. Detection of eight different proteins spiked in human serum 1% (V/V) using the optimized conditions. (a) Fluorescence response pattern acquired for the proteins tested. Each value of average as well as standard deviation was calculated based on 6 replicates. (b) Canonical score plot for the fluorescence patterns as obtained
from LDA utilizing the two most significant factors ……… 140 Figure 6.1. Course of time for the lab experiment proposed in this work. The
experiment was divided into three blocks. The first block takes 40 min, while the second and third 25 min each. This is also represented by orange, green and blue colors,
respectively. The words inside the circles are the point what was done in each block … 153 Figure 6.2. Schematic illustration of the thermal decomposition process to obtain
CQDs. The pictures (a) and (b) displays citric acid inside 10 mL glass vial before and after the thermal process, respectively. The gray, blue and white balls denote the
elements carbon, oxygen and hydrogen, respectively ………. 155 Figure 6.3. Demonstration of quantum phenomenon related to the emission and
scattering of the light. (a) Front side view of the light scattering result of the red Laser going through the dispersion colloidal containing the CQDs synthesized. (b) Spontaneous blue emission of the dispersion colloidal while is illuminated from down side using the 3 in 1 Laser light pointer. (c) Both spontaneous emission and light scattering of the red Laser. In this case, the 3 in 1 pointer was positioned at the left side
of the recipient ………. 156
Figure 6.4. UV-Vis absorption spectrum recorded at room temperature. The illustration inside the graph denotes the irradiation of CQDs presenting –OH and –COOH groups
built using over 90 NPs randomly selected ……….. 160 Figure 6.6. Schematic illustration representing the basic mechanism to describe
photoluminescence. Once the absorption process (a) does not present spontaneous emission, the excitation of the electron (e-) is colorless. By contrast, blue light can be
seen as a result of the de-excitation process, i.e. emission process (b) ……… 161 Figure 6.7. Normalized fluorescence intensity of the as-synthesized CQDs recorded at
room temperature from 350 to 600 nm using different excitations wavelengths (315 –
Table 2.1. x values and label of the samples obtained in this work ……… 34 Table 2.2. Values of x, T,O, Ko and KT for all samples synthesized …………... 44 Table 2.3. Hyperfine parameter for samples synthesized in this work ……….. 47 Table 3.1. Label for all the samples as well as the used conditions (NaOH concentration
and time) ……….……… 63
Table 3.2. Values of average crystallite size (D), microstrain (ε), network parameter, Rwp and S for the samples that showed spinel phase ………. 67 Table 3.3. Mössbauer parameters for MNP3 – 7 samples ……… 72 Table 4.1. Values of KQ, n, G, H and S found for non-metallic proteins ……… 104 Table 4.2. Values of KQ, n, G, H and S found for metallic proteins ………… 107 Table 4.3. Values of MW of the analyte proteins targeted ……… 109
1 INTRODUCTION AND OBJECTIVES .... 16
1.1 Introduction ……… 16
1.1.1 Magnetic Nanoparticles ……….. 16
1.1.2 Carbon Quantum Dots ……… 18
1.2 Objectives.……….. 23
1.2.1 General ……… 23
1.2.2 Specifics ……….. 23
1.2.2.1 Magnetic Nanoparticles ………... 23
1.2.2.2 Carbon Quantum Dots ………. 23
References …..……….. 24
2 EFFECT OF SOLVENT COMPOSITION ON THE STRUCTURAL AND MAGNETIC PROPERTIES OF MnZn FERRITE NANOPARTICLES OBTAINED BY HYDROTHERMAL SYNTHESIS ………... 31
Abstract ……… 31
2.1 Introduction ……… 32
2.2 Experimental ……….. 33
2.2.1 Materials and Methods ………. 33
2.2.2 Synthesis of MnZnFe2O4 nanoparticles ………... 33
2.2.3 Stabilization of the metallic precursors from EG ……… 34
2.2.4 Characterization of the MNPs ………. 35
2.3 Results and discussion ……… 35
2.3.1 X-ray powder diffraction (PXRD) ………... 35
2.3.2 Stability of metallic chlorides with EG ……… 38
2.3.3 Infrared Spectroscopy ……….. 41
2.3.4 57Fe Mössbauer Spectroscopy ……….. 45
2.3.5 Magnetic Measurements ……….. 47
2.3.6 Transmission Electron Microscopy (TEM) ………. 49
2.4 Conclusion ……….. 52
SUPERPARAMAGNETIC NiZn FERRITES OBTAINED BY
HYDROTHERMAL ROUTE ………... 60
Abstract ……… 60
3.1 Introduction ……… 61
3.2 Experimental ……….. 62
3.2.1 Material and methods ………... 62
3.2.2 Synthesis of NiZnFe2O4 MNPs ……… 62
3.2.3 Characterization of nanoparticles ……… 63
3.3 Results and discussion ……… 64
3.3.1 PXRD ……….. 64
3.3.2 FTIR measurements ………. 67
3.3.3 57Fe Mӧssbauer Spectroscopy ……….. 70
3.3.4 TEM ………. 73
3.3.5 Magnetic measurements ……….. 76
3.4 Conclusion ……….. 84
References ……..……….. 84
4. NH2-RICH CARBON QUANTUM DOTS: A POWERFUL PROTEIN-RESPONSIVE PROBE ……….. 90
Abstract ……… 90
4.1 Introduction ……… 91
4.2 Materials and Methods ……… 92
4.2.1 Materials ……….. 92
4.2.2 Synthesis of CQDs.BPEI ………. 92
4.2.3 Characterization of CQDs.BPEI……….. 93
4.2.4 Detection Experiments ………. 93
4.3 Results and Discussion ………... 94
4.3.1 CQDs Characterization ……… 94
4.3.2 Detection of proteins using CQDs.BPEI ……….. 98
4.4 Conclusions ……… 110
PROTEINS USING NH2-RICH CQDs ………. 117
Abstract ……… 117
5.1 Introduction ……… 118
5.2 Materials and Methods ……… 119
5.2.1 Materials ……….. 119
5.2.2 Sensing Experiments ………... 120
5.3 Results and Discussion ………... 122
5.3.1 Chemical nose/tongue approach ……….. 122
5.4 Conclusion ……….. 140
References ………..……….. 141
6. CARBON QUANTUM DOTS: A SAFE TOOL TO LEARN ABOUT QUANTUM PHENOMENON IN NANOMATERIALS ……… 146
Abstract ……… 146
6.1 Background ……… 147
6.2 Overview ……… 148
6.3 Experimental Design ……….. 149
6.3.1 Chemical and Materials required ………. 149
6.3.2 Procedure ………. 149
6.3.3 Safety ………... 150
6.4 Results ……… 151
6.4.1 Synthesis of CQDs ………... 151
6.4.2 Tyndall Effect and Emission ……… 152
6.4.3 Absorption Spectra ……….. 154
6.5 Discussion ……….. 157
6.6 Conclusion ……….. 160
6.7 Supporting data ………... 161
6.7.1 Student Version ………... 161
6.7.2 Instructor Version ……… 165
References …..……….. 170
CHAPTER 1
1 INTRODUCTION AND OBJECTIVES
1.1 Introduction
According to the U.S. The National Nanotechnology Initiative, nanotechnology can be understood as the ability to manipulate matter in the range of approximately 1 – 100 nm in order to create materials, devices, as well as systems having essentially new properties and functions because of their small structure (Roco, 2011). In the last years, the integration between nanotechnology and different areas of knowledge such as chemistry, physics, and biology have generated new research fields. For instance, it can be mentioned the nanomedicine area, which offers opportunities to discover new materials, processes and phenomena aiming biomedical field (Gao et al., 2009). The same is also true for every research field. In this sense, the development of materials in the nanoscale range (1 – 100 nm) is essential. However, the manipulation of the matter at this level is not an easy task, i.e. precise control of the atom in order to create a desired nanostructure is extremely difficult. Given the exposed, researchers worldwide have developed several approaches to synthesize mostly inorganic nanoparticles (NPs) having different magnetic, optical and structural properties (Rao et al., 2012). Therefore, it can be produced inorganic NPs such magnetic nanoparticles (MNPs), silica, gold or silver NPs, quantum dots, among others. Although, MNPs have gained much attention in recent years. The possibility to control the transport of the studied system by using a magnetic external field is a great advantage over other NPs
1.1.1 Magnetic Nanoparticles
delivery (Barreto, A. et al., 2013), hyperthermia (Jeun et al., 2014), (bio)sensor (Min and Wenzhong, 2013) and others. Fig. 1.1 displays the general applications of the MNPs.
Figure 1.1. Applications of MNPs in different technological fields. Reproduced from Jun and co-authors with permission of The Royal Chemistry Society.
Source: (Jun et al., 2007)
shorter time of analysis when compared to strategies based on just NPs (Justino et al., 2013). However, it is important to highlight these improvements can only be achieved by tuning the characteristics of the MNPs. For instance, in order to obtain the best performance, the MNPs must present the superparamagnetic behavior because this makes the response faster even applying low magnetic fields (Netto et al., 2013). Therefore, this additionally support the demand for new protocols to synthesize desired MNPs having adequate morphology and size.
In sensing field, MNPs are usually found integrated with transducer materials (Rocha-Santos, 2014). Thus, the target analyte can be detected through different mechanism involving electrochemical (Li et al., 2010; Yang et al., 2014; Yola et al., 2014), optical (Zamfir et al., 2011; Wang, J. et al., 2013; Agrawal et al., 2014) and piezoelectric (Wan et al., 2010; Zhou et al., 2013). Nevertheless, it is important to highlight there is also a possibility to use the MNPs itself as a probe as well-demonstrated in the literature (Perez et al., 2004; Hao et al., 2010; Mcnally, 2013). When integrated with a transducer, MNPs can be in the aqueous phase playing the carrier to lead the analyte onto the transducing surface by application of an external magnetic field. Once the surface properties of the MNPs can be easily tuned in order to provide selective interaction with the analyte, this approach is vastly used. Furthermore, magnetite (Fe3O4) is, by far, the most used nanostructure as well. This can be explained based on high values found for saturation magnetization (around 60 emu/g (Barreto, A. et al., 2013)) of the magnetically ordered crystalline phase. In addition, the superparamagnetism, an essential requirement for high-performance MNPs in sensing field, is also achieved (Demir et al., 2013). However, it is well-known that Fe3O4 is easily oxidized under air, which causes changes in the crystalline phase and consequent loss of the magnetic properties. Since is thermodynamically unstable with respect to hematite (α-Fe2O3) in the presence of oxygen (Tang et al., 2003). Therefore, oxidation resistance MNPs having great saturation magnetization (~60 emu/g) needs to be investigated. In this sense, it is important to highlight the MNPs of general formula M0.5Zn0.5Fe2O4, where M can be manganese (Mn) or nickel (Ni) due their excellent magnetic properties (Freire et al., 2013), which demonstrates the potential of these kind of nanomaterials in sensing field.
1.1.2 Carbon Quantum Dots
approach. In this regard, it is worth to mention the probes based on optical properties. Since the optical methods are simple, fast, sensitive, cost-effective and easily implemented into a high-throughput screening (You et al., 2015). For example, fluorescence spectroscopy, interferometry, reflectance, light scattering and refractive index are some examples of optical devices to be used as a sensor. Among them, fluorescence measurements have to be emphasized given the context of this work, and because the analytical signal related to the fluorescence intensity can be enhanced using a capture probe like MNPs (Rocha-Santos, 2014).
The literature reports several fluorescence probes including inorganic and organic NPs. For inorganic NPs, the semiconductor quantum dots (QDs) have been extensively investigated for optical sensing (Freeman and Willner, 2012). This can be explained based on their unique photophysical properties, versatile surface chemistry and ligand binding ability (Lou et al., 2014). Furthermore, this kind of NPs presents large versatility once the literature reports the possibility of integration in different materials keeping their native luminescence property (Zhao et al., 2014; Yang et al., 2015; Deng et al., 2016). Taken together, QDs seems to be a perfect optical probe, but their composition containing heavy metals such cadmium (Cd) and selenium (Se), for example, is an important drawback. Heavy metals, even at low levels, are well-known to cause some severe problems to the human health. Cardiovascular diseases, cancer mortality, damage to liver, kidneys, and central nervous system, neurological, reproductive are some of them (Hussein et al., 2005; Vázquez-González and Carrillo-Carrion, 2014). Therefore, there is still a growing interest in developing a safe and cheap fluorescent probe for optical sensing. In this context, organic NPs named carbon quantum dots (CQDs) deserve to be highlighted.
in the human body are related to the various diseases such as cancer (Madu and Lu, 2010), this is an excellent fact. Although, the number of publications is still low and the real potential of the CQDs as a fluorescent probe targeting protein is still unknown. Therefore, new researches need to be conducted in order to fill this gap of the knowledge.
Figure 1.2. Schematic illustration of luminescence modulation via Förster resonance energy transfer (FRET) within the context of pattern recognition based on competitive binding between indicator and anionic analyte on the surface of the lanthanide (Ln3+)-doped NPs. Reprinted with permission from Wang and co-authors. Copyright 2016 American Chemical Society
As it can be seen in the Fig. 1.2, the Ln3+-doped NPs were first bound with the indicator. Subsequently, the binding equilibrium is perturbed by adding the analytes represented by triangle (anion 1), circle (anion 2) and square (anion 3). This would lead for a displacement of the indicator. Once the interaction involving each one of the analytes and the system Ln3+-doped NPs is unique, the fluorescence intensity should be found to generate a characteristic signal. Using this concept and by changing the indicator, different signals can be generated for each analyte and their combination would give rise a pattern recognition. Therefore, fluorescent fingerprints related to the analyte could be created, which makes possible to perform the identification utilizing chemometrics tools (Anzenbacher et al., 2010). From the top of our knowledge, a few papers involving CQDs for differential sensing can be found in the literature (Tao et al., 2014). Therefore, this is a gap in the sensing field ready to be explored.
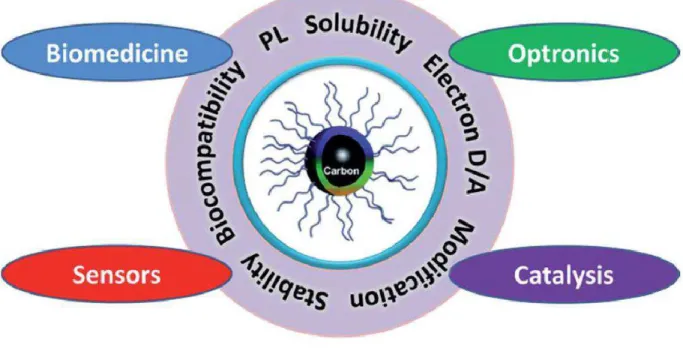
Figure 1.3. Illustration presenting CQDs properties, as well as potential research fields. Reproduced from Wang and Hu with permission of The Royal Chemistry Society.
Source: (Wang and Hu, 2014)
catalysis according to the reviews published by Wang et al. (Wang and Hu, 2014). In another review published in the famous journal named Chemical Society Reviews (Impact factor equal to 34.09/2016) by Lim et al. (Lim et al., 2015), the cited research fields were chemical sensing, biosensing, bioimaging, nanomedicine, photocatalysis and electrocatalysis. As expected, CQDs can be applied in many fields. However, the utilization of the CQDs in the educational field must also be considered. For instance, QDs were already used to demonstrate quantum phenomena (light absorption and emission) for undergraduate students (Landry et al., 2014). Therefore, the educational field is an open door to explore it.
1.2 Objectives 1.2.1 General
To explore the properties of the mixed ferrites of general formula M0.5Zn0.5Fe2O4 (M=Mn or Ni) and/or carbon quantum dots in order to develop a chemical “nose/tongue” approach for detection and identification of proteins, as well as to develop a safe laboratory experiment to demonstrate quantum phenomena for undergraduate students
1.2.2 Specifics
1.2.2.1 Magnetic Nanoparticles
o To synthesize MNPs of general formula M0.5Zn0.5Fe2O4 (M=Mn or Ni) under different experimental conditions
o To investigate the structural and magnetic properties of the synthesized MNPs by using powder X-ray diffraction (PXRD), Fourier transform infrared spectroscopy (FT-IR), Mössbauer spectroscopy, vibrating sample magnetometer (VSM) and transmission electron microscopy (TEM)
o To evaluate the effect of experimental conditions on the MNPs characteristics
o To choose the MNPs with highest potential based on structural and magnetic properties. o To find the optimal condition to synthesize the MNPs in order to obtain a high potential
nanomaterial to compound a chemical “nose” approach to detect and identify proteins.
1.2.2.2 Carbon Quantum Dots
o To investigate the structural, morphological, surface and optical properties of the synthesized CQDs through X-ray photoelectron spectroscopy (XPS), Fourier transform infrared spectroscopy (FTIR), Transmission electron microscopy (TEM) and absorbance/ fluorescence measurements
o To check the potential of the synthesized CQDs as a protein-responsive platform o To develop a “nose”-based approach to identify the analyte proteins
o To evaluate the potential of the developed “nose”-based approach by testing unknown and serum samples
References
AGRAWAL, S.; PAKNIKAR, K.; BODAS, D. Development of immunosensor using magnetic nanoparticles and circular microchannels in PDMS. Microelectronic Engineering, Place Published, v. 115, p. 66-69, 2014. ISSN 0167-9317. Disponível em: <
http://www.sciencedirect.com/science/article/pii/S0167931713006503 >.
ALI, R. et al. Impacts of Ni–Co substitution on the structural, magnetic and dielectric properties of magnesium nano-ferrites fabricated by micro-emulsion method. Journal of Alloys and Compounds, Place Published, v. 584, p. 363-368, 2014. ISSN 0925-8388. Disponível em: < http://www.sciencedirect.com/science/article/pii/S0925838813019907 >.
AMJADI, M.; ABOLGHASEMI-FAKHRI, Z.; HALLAJ, T. Carbon dots-silver nanoparticles fluorescence resonance energy transfer system as a novel turn-on fluorescent probe for selective determination of cysteine. Journal of Photochemistry and Photobiology A: Chemistry, Place Published, v. 309, p. 8-14, 2015. ISSN 1010-6030. Disponível em: <
http://www.sciencedirect.com/science/article/pii/S1010603015001434 >.
ANZENBACHER, J. P. et al. A practical approach to optical cross-reactive sensor arrays. Chemical Society Reviews, Place Published, v. 39, n. 10, p. 3954-3979, 2010. ISSN 0306-0012. Disponível em: < http://dx.doi.org/10.1039/B926220M >.
BAJAJ, A. et al. Array-Based Sensing of Normal, Cancerous, and Metastatic Cells Using Conjugated Fluorescent Polymers. Journal of the American Chemical Society, Place Published, v. 132, n. 3, p. 1018-1022, 2010/01/27 2010. ISSN 0002-7863. Disponível em: < http://dx.doi.org/10.1021/ja9061272 >.
BAJAJ, A. et al. Cell surface-based differentiation of cell types and cancer states using a gold nanoparticle-GFP based sensing array. Chemical Science, Place Published, v. 1, n. 1, p. 134-138, 2010. ISSN 2041-6520. Disponível em: < http://dx.doi.org/10.1039/C0SC00165A >. BARATI, A.; SHAMSIPUR, M.; ABDOLLAHI, H. Hemoglobin detection using carbon dots as a fluorescence probe. Biosensors and Bioelectronics, Place Published, v. 71, p. 470-475, 2015. ISSN 0956-5663. Disponível em: <
http://www.sciencedirect.com/science/article/pii/S0956566315300749 >.
BARRETO, A. et al. Magnetic Nanosystem for Cancer Therapy Using Oncocalyxone A, an Antitomour Secondary Metabolite Isolated from a Brazilian Plant. International Journal of Molecular Sciences, Place Published, v. 14, n. 9, p. 18269-18283, 2013. ISSN 1422-0067. Disponível em: < http://www.mdpi.com/1422-0067/14/9/18269 >.
CAI, Q.-Y. et al. A rapid fluorescence “switch-on” assay for glutathione detection by using carbon dots–MnO2 nanocomposites. Biosensors and Bioelectronics, Place Published, v. 72, p. 31-36, 2015. ISSN 0956-5663. Disponível em: <
http://www.sciencedirect.com/science/article/pii/S0956566315300774 >.
CUI, X. et al. A fluorescent biosensor based on carbon dots-labeled oligodeoxyribonucleotide and graphene oxide for mercury (II) detection. Biosensors and Bioelectronics, Place Published, v. 63, p. 506-512, 2015. ISSN 0956-5663. Disponível em: <
http://www.sciencedirect.com/science/article/pii/S0956566314005880 >.
DE, M. et al. Sensing of proteins in human serum using conjugates of nanoparticles and green fluorescent protein. Nat Chem, Place Published, v. 1, n. 6, p. 461-465, 2009. ISSN 1755-4330. Disponível em: < http://dx.doi.org/10.1038/nchem.334 >.
DEMIR, A.; TOPKAYA, R.; BAYKAL, A. Green synthesis of superparamagnetic Fe3O4 nanoparticles with maltose: Its magnetic investigation. Polyhedron, Place Published, v. 65, p. 282-287, 2013. ISSN 0277-5387. Disponível em: <
http://www.sciencedirect.com/science/article/pii/S0277538713006049 >.
DENG, J. et al. Enhanced H2S gas sensing properties of undoped ZnO nanocrystalline films from QDs by low-temperature processing. Sensors and Actuators B: Chemical, Place Published, v. 224, p. 153-158, 2016. ISSN 0925-4005. Disponível em: <
http://www.sciencedirect.com/science/article/pii/S0925400515304883 >.
FREEMAN, R.; WILLNER, I. Optical molecular sensing with semiconductor quantum dots (QDs). Chemical Society Reviews, Place Published, v. 41, n. 10, p. 4067-4085, 2012. ISSN 0306-0012. Disponível em: < http://dx.doi.org/10.1039/C2CS15357B >.
FREIRE, R. M. et al. MZnFe2O4 (M = Ni, Mn) cubic superparamagnetic nanoparticles obtained by hydrothermal synthesis. Journal of Nanoparticle Research C7 - 1616, Place Published, v. 15, n. 5, p. 1-12, 2013. Disponível em: < http://dx.doi.org/10.1007/s11051-013-1616-3 >. GALVÃO, W. S. et al. Cubic superparamagnetic nanoparticles of NiFe2O4 via fast microwave heating. Journal of Nanoparticle Research, Place Published, v. 16, n. 12, p. 1-10, 2014// 2014. ISSN 1572-896X. Disponível em: < http://dx.doi.org/10.1007/s11051-014-2803-6 >.
GAO, J.; GU, H.; XU, B. Multifunctional Magnetic Nanoparticles: Design, Synthesis, and Biomedical Applications. Accounts of Chemical Research, Place Published, v. 42, n. 8, p. 1097-1107, 2009/08/18 2009. ISSN 0001-4842. Disponível em: <
http://dx.doi.org/10.1021/ar9000026 >.
HAO, L. et al. Magnetic nanoparticle detection using nano-SQUID sensors. Journal of Physics D: Applied Physics, Place Published, v. 43, n. 47, p. 474004, 2010. ISSN 0022-3727.
Disponível em: < http://stacks.iop.org/0022-3727/43/i=47/a=474004 >.
HERRERA, A. P. et al. Influence of aging time of oleate precursor on the magnetic relaxation of cobalt ferrite nanoparticles synthesized by the thermal decomposition method. Journal of
Magnetism and Magnetic Materials, Place Published, v. 328, p. 41-52, 2013. ISSN 0304-8853. Disponível em: < http://www.sciencedirect.com/science/article/pii/S0304885312008207 >. HUANG, S. et al. A carbon dots based fluorescent probe for selective and sensitive detection of hemoglobin. Sensors and Actuators B: Chemical, Place Published, v. 221, p. 1215-1222, 2015. ISSN 0925-4005. Disponível em: <
http://www.sciencedirect.com/science/article/pii/S0925400515301568 >.
HUSSEIN, H. et al. Tolerance and uptake of heavy metals by Pseudomonads. Process
Biochemistry, Place Published, v. 40, n. 2, p. 955-961, 2005. ISSN 1359-5113. Disponível em: < http://www.sciencedirect.com/science/article/pii/S0032959204001517 >.
JEUN, M. et al. Tailoring MgxMn1–xFe2O4 Superparamagnetic Nanoferrites for Magnetic Fluid Hyperthermia Applications. ACS Applied Materials & Interfaces, Place Published, v. 6, n. 19, p. 16487-16492, 2014/10/08 2014. ISSN 1944-8244. Disponível em: <
http://dx.doi.org/10.1021/am5057163 >.
JUN, Y.-W.; CHOI, J.-S.; CHEON, J. Heterostructured magnetic nanoparticles: their versatility and high performance capabilities. Chemical Communications, Place Published, n. 12, p. 1203-1214, 2007. ISSN 1359-7345. Disponível em: < http://dx.doi.org/10.1039/B614735F >.
JUSTINO, C. I. L. et al. Strategies for enhancing the analytical performance of nanomaterial-based sensors. TRAC Trends in Analytical Chemistry, Place Published, v. 47, p. 27-36, 2013. ISSN 0165-9936. Disponível em: <
http://www.sciencedirect.com/science/article/pii/S0165993613000678 >.
LANDRY, M. L. et al. Simple Syntheses of CdSe Quantum Dots. Journal of Chemical Education, Place Published, v. 91, n. 2, p. 274-279, 2014/02/11 2014. ISSN 0021-9584. Disponível em: < http://dx.doi.org/10.1021/ed300568e >.
LATHAM, A. H.; WILLIAMS, M. E. Controlling Transport and Chemical Functionality of Magnetic Nanoparticles. Accounts of Chemical Research, Place Published, v. 41, n. 3, p. 411-420, 2008/03/01 2008. ISSN 0001-4842. Disponível em: < http://dx.doi.org/10.1021/ar700183b >.
LEMINE, O. M. et al. γ-Fe2O3 by sol–gel with large nanoparticles size for magnetic
hyperthermia application. Journal of Alloys and Compounds, Place Published, v. 607, p. 125-131, 2014. ISSN 0925-8388. Disponível em: <
http://www.sciencedirect.com/science/article/pii/S0925838814007944 >.
LI, H. et al. Nucleic acid detection using carbon nanoparticles as a fluorescent sensing platform. Chemical Communications, Place Published, v. 47, n. 3, p. 961-963, 2011. ISSN 1359-7345. Disponível em: < http://dx.doi.org/10.1039/C0CC04326E >.
LI, J. et al. An electrochemical immunosensor for carcinoembryonic antigen enhanced by self-assembled nanogold coatings on magnetic particles. Analytica Chimica Acta, Place Published, v. 665, n. 1, p. 98-104, 2010. ISSN 0003-2670. Disponível em: <
http://www.sciencedirect.com/science/article/pii/S000326701000303X >.
LIM, S. Y.; SHEN, W.; GAO, Z. Carbon quantum dots and their applications. Chemical Society Reviews, Place Published, v. 44, n. 1, p. 362-381, 2015. ISSN 0306-0012. Disponível em: < http://dx.doi.org/10.1039/C4CS00269E >.
LOU, Y. et al. Metal ions optical sensing by semiconductor quantum dots. Journal of Materials Chemistry C, Place Published, v. 2, n. 4, p. 595-613, 2014. ISSN 2050-7526. Disponível em: < http://dx.doi.org/10.1039/C3TC31937G >.
MADU, C. O.; LU, Y. Novel diagnostic biomarkers for prostate cancer. Journal of Cancer, Place Published, v. 1, p. 150-177, 2010. ISSN 1837-9664. Disponível em: <
http://www.ncbi.nlm.nih.gov/pmc/articles/PMC2962426/ >.
MCNALLY, A. Magnetic sensors: Nanoparticles detect infection. Nat Nano, Place Published, v. 8, n. 5, p. 315-316, 2013. ISSN 1748-3387. Disponível em: <
http://dx.doi.org/10.1038/nnano.2013.76 >.
MIN, B. U.; WENZHONG, M. Study on core–shell–shell structured nanoparticles with magnetic and luminescent features: Construction, characterization and oxygen-sensing behavior. Journal of Luminescence, Place Published, v. 141, n. 0, p. 80-86, 2013. ISSN 0022-2313. Disponível em: < http://www.sciencedirect.com/science/article/pii/S0022231313001610 >.
MIRANDA, O. R. et al. Array-Based Sensing of Proteins Using Conjugated Polymers. Journal of the American Chemical Society, Place Published, v. 129, n. 32, p. 9856-9857, 2007/08/01 2007. ISSN 0002-7863. Disponível em: < http://dx.doi.org/10.1021/ja0737927 >.
NGUYEN, B. T.; ANSLYN, E. V. Indicator–displacement assays. Coordination Chemistry Reviews, Place Published, v. 250, n. 23–24, p. 3118-3127, 2006. ISSN 0010-8545. Disponível em: < http://www.sciencedirect.com/science/article/pii/S0010854506001147 >.
PEREZ, J. M.; JOSEPHSON, L.; WEISSLEDER, R. Use of Magnetic Nanoparticles as
Nanosensors to Probe for Molecular Interactions. ChemBioChem, Place Published, v. 5, n. 3, p. 261-264, 2004. ISSN 1439-7633. Disponível em: < http://dx.doi.org/10.1002/cbic.200300730 >. RAO, C. N. R. et al. Recent progress in the synthesis of inorganic nanoparticles. Dalton
Transactions, Place Published, v. 41, n. 17, p. 5089-5120, 2012. ISSN 1477-9226. Disponível em: < http://dx.doi.org/10.1039/C2DT12266A >.
REDDY, L. H. et al. Magnetic Nanoparticles: Design and Characterization, Toxicity and Biocompatibility, Pharmaceutical and Biomedical Applications. Chemical Reviews, Place Published, v. 112, n. 11, p. 5818-5878, 2012/11/14 2012. ISSN 0009-2665. Disponível em: < http://dx.doi.org/10.1021/cr300068p >.
ROCHA-SANTOS, T. A. P. Sensors and biosensors based on magnetic nanoparticles. TrAC Trends in Analytical Chemistry, Place Published, v. 62, n. 0, p. 28-36, 2014. ISSN 0165-9936. Disponível em: < http://www.sciencedirect.com/science/article/pii/S0165993614001617 >. ROCO, M. C. The long view of nanotechnology development: the National Nanotechnology Initiative at 10 years. Journal of Nanoparticle Research, Place Published, v. 13, n. 2, p. 427-445, 2011// 2011. ISSN 1572-896X. Disponível em: < http://dx.doi.org/10.1007/s11051-010-0192-z >.
SINGH RANA, P. J.; SINGH, P.; KAR, P. Fluorescence alarming ON-OFF-ON switch derived from biocompatible carbon nanoparticle-hemoglobin-H2O2 interaction. RSC Advances, Place Published, v. 6, n. 74, p. 70660-70668, 2016. Disponível em: <
http://dx.doi.org/10.1039/C6RA14308C >.
TANG, J. et al. Magnetite Fe3O4 Nanocrystals: Spectroscopic Observation of Aqueous Oxidation Kinetics. The Journal of Physical Chemistry B, Place Published, v. 107, n. 30, p. 7501-7506, 2003/07/01 2003. ISSN 1520-6106. Disponível em: <
http://dx.doi.org/10.1021/jp027048e >.
TAO, Y. et al. Array-Based Sensing of Proteins and Bacteria By Using Multiple Luminescent Nanodots as Fluorescent Probes. Small, Place Published, v. 10, n. 18, p. 3667-3671, 2014. ISSN 1613-6829. Disponível em: < http://dx.doi.org/10.1002/smll.201400661 >.
VÁZQUEZ-GONZÁLEZ, M.; CARRILLO-CARRION, C. Analytical strategies based on
quantum dots for heavy metal ions detection. Journal of Biomedical Optics, Place Published, v. 19, n. 10, p. 101503-101503, 2014. ISSN 1083-3668. Disponível em: <
WAN, Y.; ZHANG, D.; HOU, B. Determination of sulphate-reducing bacteria based on vancomycin-functionalised magnetic nanoparticles using a modification-free quartz crystal microbalance. Biosensors and Bioelectronics, Place Published, v. 25, n. 7, p. 1847-1850, 2010. ISSN 0956-5663. Disponível em: <
http://www.sciencedirect.com/science/article/pii/S0956566309007064 >.
WANG, F. et al. Graphene quantum dots as a fluorescent sensing platform for highly efficient detection of copper(II) ions. Sensors and Actuators B: Chemical, Place Published, v. 190, p. 516-522, 2014. ISSN 0925-4005. Disponível em: <
http://www.sciencedirect.com/science/article/pii/S0925400513010496 >.
WANG, J. et al. Studies of Fe3O4/Ag/Au composites for immunoassay based on surface
plasmon resonance biosensor. Colloids and Surfaces B: Biointerfaces, Place Published, v. 102, p. 165-170, 2013. ISSN 0927-7765. Disponível em: <
http://www.sciencedirect.com/science/article/pii/S0927776512004882 >.
WANG, M. et al. A Supramolecular Sensor Array Using Lanthanide-Doped Nanoparticles for Sensitive Detection of Glyphosate and Proteins. ACS Applied Materials & Interfaces, Place Published, v. 8, n. 1, p. 574-581, 2016/01/13 2016. ISSN 1944-8244. Disponível em: <
http://dx.doi.org/10.1021/acsami.5b09607 >.
WANG, Y.; HU, A. Carbon quantum dots: synthesis, properties and applications. Journal of Materials Chemistry C, Place Published, v. 2, n. 34, p. 6921-6939, 2014. ISSN 2050-7526. Disponível em: < http://dx.doi.org/10.1039/C4TC00988F >.
WANG, Y. et al. Using Graphene Quantum Dots as Photoluminescent Probes for Protein Kinase Sensing. Analytical Chemistry, Place Published, v. 85, n. 19, p. 9148-9155, 2013/10/01 2013. ISSN 0003-2700. Disponível em: < http://dx.doi.org/10.1021/ac401807b >.
XU, X. et al. Electrophoretic Analysis and Purification of Fluorescent Single-Walled Carbon Nanotube Fragments. Journal of the American Chemical Society, Place Published, v. 126, n. 40, p. 12736-12737, 2004/10/01 2004. ISSN 0002-7863. Disponível em: <
http://dx.doi.org/10.1021/ja040082h >.
YANG, C. et al. rGO quantum dots/ZnO hybrid nanofibers fabricated using electrospun polymer templates and applications in drug screening involving an intracellular H2O2 sensor. Journal of Materials Chemistry B, Place Published, v. 3, n. 13, p. 2651-2659, 2015. ISSN 2050-750X. Disponível em: < http://dx.doi.org/10.1039/C4TB02134G >.
YANG, Z. et al. Potentiometric glucose biosensor based on core–shell Fe3O4–enzyme–
polypyrrole nanoparticles. Biosensors and Bioelectronics, Place Published, v. 51, p. 268-273, 2014. ISSN 0956-5663. Disponível em: <
http://www.sciencedirect.com/science/article/pii/S0956566313005265 >.
Published, v. 125, p. 38-47, 2014. ISSN 0013-4686. Disponível em: < http://www.sciencedirect.com/science/article/pii/S001346861400142X >.
YOU, C.-C. et al. Detection and identification of proteins using nanoparticle-fluorescent polymer /`chemical nose/' sensors. Nat Nano, Place Published, v. 2, n. 5, p. 318-323, 2007. ISSN 1748-3387. Disponível em: < http://dx.doi.org/10.1038/nnano.2007.99 >.
YOU, L.; ZHA, D.; ANSLYN, E. V. Recent Advances in Supramolecular Analytical Chemistry Using Optical Sensing. Chemical Reviews, Place Published, v. 115, n. 15, p. 7840-7892, 2015/08/12 2015. ISSN 0009-2665. Disponível em: < http://dx.doi.org/10.1021/cr5005524 >. ZAMFIR, L.-G. et al. Highly sensitive label-free immunosensor for ochratoxin A based on functionalized magnetic nanoparticles and EIS/SPR detection. Sensors and Actuators B: Chemical, Place Published, v. 159, n. 1, p. 178-184, 2011. ISSN 0925-4005. Disponível em: < http://www.sciencedirect.com/science/article/pii/S092540051100606X >.
ZHANG, R.; CHEN, W. Nitrogen-doped carbon quantum dots: Facile synthesis and application as a “turn-off” fluorescent probe for detection of Hg2+ ions. Biosensors and Bioelectronics, Place Published, v. 55, p. 83-90, 2014. ISSN 0956-5663. Disponível em: <
http://www.sciencedirect.com/science/article/pii/S0956566313008646 >.
ZHAO, D. et al. Metal–organic frameworks (MOFs) combined with ZnO quantum dots as a fluorescent sensing platform for phosphate. Sensors and Actuators B: Chemical, Place Published, v. 197, p. 50-57, 2014. ISSN 0925-4005. Disponível em: <
http://www.sciencedirect.com/science/article/pii/S0925400514002184 >.
ZHOU, J. et al. Ultratrace detection of C-reactive protein by a piezoelectric immunosensor based on Fe3O4@SiO2 magnetic capture nanoprobes and HRP-antibody co-immobilized nano gold as signal tags. Sensors and Actuators B: Chemical, Place Published, v. 178, p. 494-500, 2013. ISSN 0925-4005. Disponível em: <
CHAPTER 2
2 EFFECT OF SOLVENT COMPOSITION ON THE STRUCTURAL AND
MAGNETIC PROPERTIES OF MNZN FERRITE NANOPARTICLES
OBTAINED BY HYDROTHERMAL SYNTHESIS
Abstract
Samples of MnZn ferrites were successfully prepared by hydrothermal syntheses using different compositions of the reactive system (H2O)1-x:(EG)x (x0, 0.2, 0.4, 0.6, 0.8 and 1.0), where EG= ethylene glycol. The samples were fully investigated by powder X-ray diffraction (PXRD), Fourier transform infrared spectroscopy (FT-IR) for both liquid and solid specimens, Mössbauer spectroscopy, vibrating sample magnetometer (VSM) and transmission electron microscopy (TEM). All the MnZn ferrites presented spinel phase and average particle diameters between 3.1 and 12.1 nm. The increase of the x values results in a decrease in the particle sizes. The FTIR spectra performed in liquid phase showed significant interaction between EG and metallic precursors used in the synthesis.
Magnetic features as for instance saturation magnetization (MS) also decreases upon increasing the x values. In addition, all synthesized samples exhibited a superparamagnetic character at room temperature. The experimental methodology presented in this work is determining to obtain superparamagnetic nanoparticles with controlled size (smaller than 13 nm) and morphology.
2.1 Introduction
In the last decades, magnetic materials have been the subject of intensive investigations due to their inherent magnetic properties and applications in electronic devices, such as inductors, AC/DC converters, transformers, noise filters, recording heads and others (Poddar et al., 2005; Zhang et al., 2009). This kind of material also have generated a lot of interest in biomedical applications (Arruebo et al., 2007; Boyer et al., 2010; Barreto, A. N. et al., 2013) for magnetic contrast resonance imaging (MRI), magnetic separation, targeted drug delivery, tissue engineering, cell tracking, bioseparation and magnetic hyperthermia. Thus, the advancement of nanotechnology has brought new strategies and perspectives mainly for medicine (Botelho et al., 2009; Botelho et al., 2010; Gonzaga et al., 2012; Botelho et al., 2013). In this way, Manganese–Zinc ferrites (MnZn) assume special importance due to their chemical composition and crystal structure, with the metal ions distributed among eight tetrahedral (A) and 16 octahedral (B) coordinated sites per unit cell, in which oxygen atoms form a face-centered cubic (FCC) lattice. These characteristics lead to a material with high initial permeabilityand saturation magnetization, as well as lower eddy current loss compared with alloy cores (Shokrollahi and Janghorban, 2007). Apart from being interesting for electronic devices, MnZn ferrites have been also used for biomedical applications and also potentially promising for MRI, drug delivery and magnetic fluid hyperthermia (Latorre-Esteves et al., 2009).
(Riman et al., 2002). This improves the size and morphology control of crystallites and significantly reduces the extent of NP aggregation. Then, the choice of the reaction environment (solvent or mixtures) in which the NP will be produced is extremely important. Nevertheless, literature (Yáñez-Vilar et al., 2009; Pérez-Mirabet et al., 2013) reports few studies evaluating the role of different solvents in the synthesis of MNP under solvo/hydrothermal conditions. The majority of papers evaluate how the experimental conditions as temperature (Mozaffari et al., 2010), stirring velocity (Valenzuela et al., 2009) and precipitating agent (Aquino et al., 2002) may affect the particle size and morphology. However, another strategy largely employed by researchers is the use of stabilizing agents such as oleic acid (Zhang et al., 2006) and sodium acetate (Wang et al., 2009), oleylamine (Pérez-Mirabet et al., 2013) and polysaccharides (carboxymethyl cellulose sodium) (Chang et al., 2011).
In the present work, MnZnFe2O4 nanoparticles were prepared under hydro/solvothermal conditions in different solvent compositions of water and/or EG. We show a dependency of the magnetic and structural properties on changes of solvent compositions. Structural, optical and magnetic features of the produced nanoparticles were studied by PXRD, TEM, FTIR, Raman and Mössbauer spectroscopies, and vibrating sample magnetometry.
2.2Experimental
2.2.1 Materials and Methods
All reagents were commercially available, with analytical grade and employed without further purification. The chemical reagents for this work are ferric chloride hexahydrate (FeCl36H2O, Dinâmica, 97%) manganese chloride tetrahydrate (MnCl24H2O, Vetec, 99%), zinc chloride (ZnCl2, Dinâmica, 97%), sodium hydroxide (NaOH, Cinética Química, 97%) and EG (C2H6O2, Reagen, P.A.).
2.2.2 Synthesis of MnZnFe2O4 nanoparticles
of 1.85 mmol of MnCl24H2O, 1.85 mmol of ZnCl2 and 7.4 mmol of FeCl36H2O. NaOH (~37.5 mmol) was added into the mixture in order to precipitate the desired hydroxides. The as obtained slurry was sealed in a teflon-lined stainless-steel autoclave and the crystallization was carried out under autogenously pressure at temperature of 250°C for 0.5 h. The reaction occurring during this process can be summarized as follows:
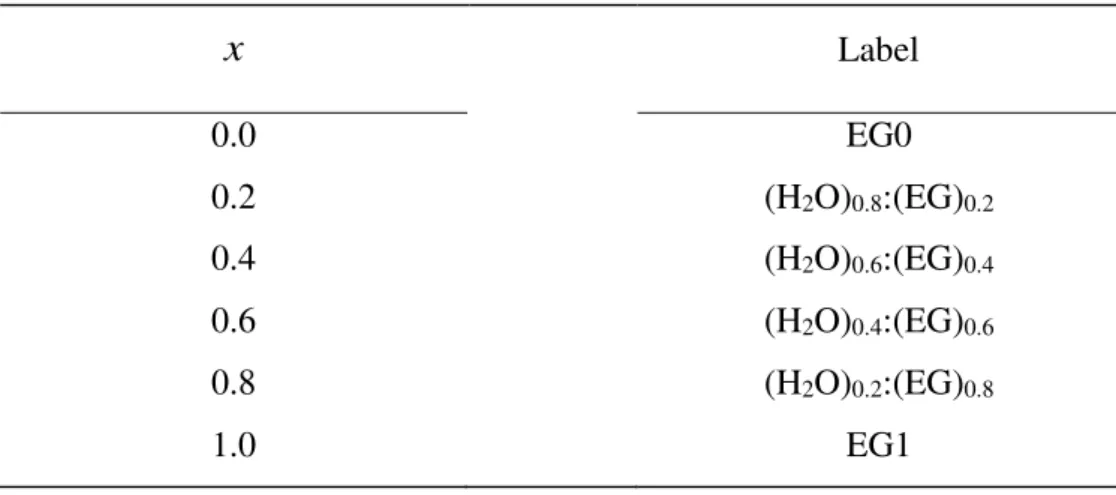
0.5Mn2+ + 0.5Zn2+ + 2Fe3+ + 8OH- Zn0.5M0.5Fe2O4 + 4H2O (1) After this procedure, the autoclave was cooled down to room temperature and the precipitate washed several times with water and methanol. The materials were then dried in air at 100°C for 3h. The resultant MNP was labeled according to the x values, which indicate the amount of EG contained in the solvent.
Table 2.1. x values and label of the samples obtained in this work.
x Label
0.0 EG0
0.2 (H2O)0.8:(EG)0.2
0.4 (H2O)0.6:(EG)0.4
0.6 (H2O)0.4:(EG)0.6
0.8 (H2O)0.2:(EG)0.8
1.0 EG1
Source: Author
2.2.3 Stabilization of the metallic precursors from EG
2.2.4 Characterization of the MNPs
The structural analysis was made by X-ray powder diffraction (PXRD) patterns of the obtained samples using CuKα (1.54056 Å) radiation from a Rigaku diffractometer with a Bragg-Brentano geometry in the range of 20-70º angle degrees. The phase identification was made by comparing powder diffractograms with standard patterns from International Centre for Diffraction Data (ICDD). Rietveld refinement procedures (Rietveld, 1967; Maia et al., 2006) were applied to all diffraction patterns using the DBWS 2.25 (Bleicher et al., 2000). The infrared spectra (FTIR) of the samples were carried out on a Perkin-Elmer Fourier transform infrared spectrometer in the range 4000 – 400 cm-1. In recording FTIR spectra, each sample was mixed with potassium bromide (KBr) powder and pressed into pellets. The Mössbauer spectrum was recorded at room temperature (300K) from FAST (ConTec) Mössbauer System spectrometer using transmission geometry. A 57Co radioactive source was used. The data analysis was performed using NORMOS program written by R.A. Brand (distributed by Wissenschaftliche Elektronik GmbH, Germany). Isomer shifts (δ) are referred to α-Fe at room temperature. Magnetic properties were investigated by a vibrating sample magnetometer (VSM) Mini 5 Tesla from Cryogenic Ltd. The VSM has been previously calibrated using a YIG sphere, and after measuring the mass of each sample the magnetization was given in emu/g. Microstructural studies including evaluation of particle size and morphology were performed on a Jeol JEM-1011 electron microscope operating at 100 kV, equipped with a CCD camera ORIUS 831 from Gatan. Transmission Electron Microscope (TEM) images of the samples were prepared by drop-casting dilute nanocrystal solutions onto carbon coated copper grids. Afterwards, the deposited samples were allowed to complete dry at 60°C for one night before examination.
2.3 Results and discussion
2.3.1 X-ray powder diffraction (PXRD)
Figure 2.1. XRD for samples of the system (H2O)1-x:(EG)x, where x denotes the amount of the EG used to compose the solvent. The corresponding x values are reported in each diffractogram. The black dots reveal the experimental data, while the red line denotes the calculated data. The green line displays the difference between experimental and calculated data.
The average crystallite size was calculated using the Debye-Scherrer equation after accounting for instrumental broadening (Rietveld method) (Velmurugan et al., 2010). These values are plotted as a function of EG fraction (Fig. 2.2). It was possible to observe a decrease in average crystallite sizes when the EG fraction in the reactive domain raises. Interestingly, the size reduction sharply decreases (approximately 30%) as the EG fraction exceeds 0.2. Then after a x value of 0.5, it levels out again due to a less pronounced crystallite size reduction. This trend suggests the existence of a minimum threshold concentration in which EG can stabilize a maximum number of nanoparticles in solution, thus contributing to decrease the average sizes of the samples.
Figure 2.2. Particle size describe in function of the x values, which denotes the amount of the EG used to compose the solvent.
Source: Author
2.3.2 Stability of metallic chlorides with EG
performed. These experiments were carried out in order to investigate the influence of EG on the stability of Mn2+, Zn2+, and Fe3+ chlorides in phase solution. Each metallic chloride was solubilized in 5 mL of solvent with different amounts of EG (x 0, 0.2, 0.4, 0.6, 0.8, 1.0). The same solubilizing procedure was applied to anhydrous NaOH which works as precipitating agent of formed nanoparticles in the synthesis. Upon mixing both solutions, possible precipitation can be observed depending on the x values. Fig. 2.3 summarizes the final outcomes. Relatively to Mn and Fe, a solid precipitate was noted in the case of solutions containing 0 or 0.2 of EG fraction. When this concentration was exceeding, it was observed only color changes without any solid precipitation. Differently Zn-based salt did not show any changes of color or precipitate formation as a function of EG fraction. This result confirmed the improved dispersibility of particles in solution due to the increase of EG fraction. Literature reports that EG can behave as a mono or bidentate ligand (Knetsch and L. Groeneveld, 1973). Therefore, to evaluate the interaction of metallic precursors with EG, it was performed FTIR spectra of solutions resultant after adding of the NaOH. Fig. 2.4 shows the spectrum for each test realized with different x values and metallic precursors. It is possible to observe a similarity for all spectra with bands around 3350 and 1640 cm-1 for sample with 0
x , characteristic
of the stretch and bending O-H of water molecules, respectively. However, for the tests performed with x0 the same band clearly shows shift to lower frequencies (~3300 cm -1). This indicates coordination of EG with metallic precursors by oxygen atoms. The
Figure 2.3. Results of the stabilization test for different precursors metallic used in the synthesis. On the left side of each series of tests the relative metalis reported. The x values for the system (H2O)1-x:(EG)x are presented only in the case of Zn series, but can be straightforwardly expanded for Mn and Fe.
Figure 2.4. IR spectra of the tests realized with different x in the system ((H2O)1-x:(EG)x) for metallic precursors.
Source: Author
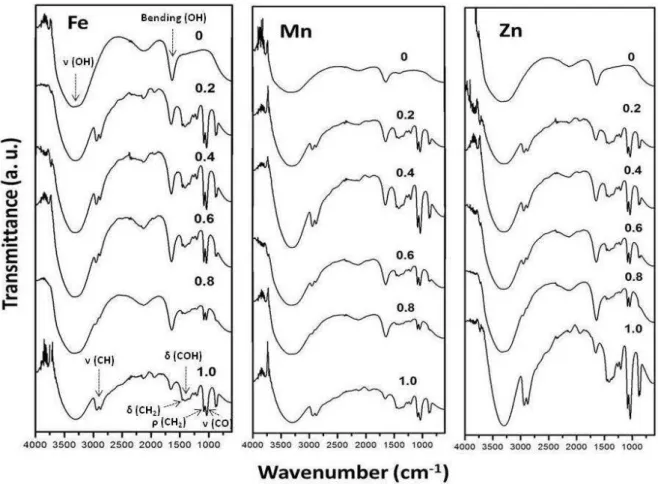
2.3.3 Infrared Spectroscopy
As reported before, it was possible to confirm the presence of spinel phase in all samples from the results of PXRD. According to literature (Shebanova and Lazor, 2003), this phase contains two distinct cationic lattice positions namely tetrahedral and octahedral sites coordinated by oxygen anions. Both sites contributes to the active modes in IR and a theoretical analysis based on the nuclear site group approach (Porto, 1981) predicts four IR-active bands T1u (Gupta et al., 2002). Fig. 2.5 shows the FTIR spectra in the range 4000 – 400 cm-¹ for all samples. It can be observed two bands in the range 650 – 400 cm -1 widely observed for ordered spinel ferrites (Ravinder, 1999; Bezerra, 2007). The
Figure 2.5. FTIR for samples of the system (H2O)1-x:(EG)x, where x denotes the amount of the EG used to compose the solvent. The corresponding x values are reported in each spectrum.
Source: Author
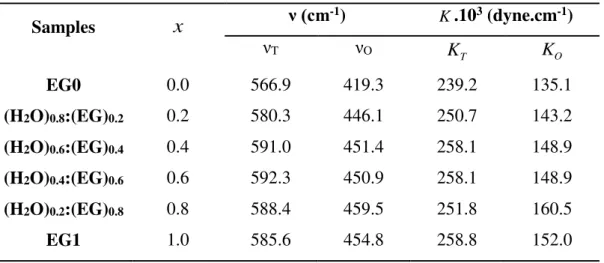
wavelength values observed in Fig. 2.5. According to literature (Amer et al., 2011), bands’s frequency are proportional to the force constant (K), which can be calculated using the relation:
ν =
K
2
1 (3)
where ȝ is the reduced mass and Ȟ the frequency. The values of O, T, Ko and KT for all samples are listed in the Table 2.2, where subscripts O and T means octahedral and tetrahedral, respectively. Fig. 2.6 shows the K values plotted as a function of EG fraction. As a general trend, it was clear that the force constants values increase with EG fraction in the system, which was accompanied by the decrease of the particle size. Literature (Choi et al., 2005) reports that a volume contraction occurs within the nanoparticles due to decrease particle size. This leads to increase in the force constants as a result of the decreases in the interatomic distances. Then, the behavior observed can be assigned to the decrease in metal–oxygen bond lengths at the octahedral and tetrahedral sites. Moreover, K values can be too influenced by method of preparation and porosity
(Waldron, 1955; Josyulu and Sobhanadri, 1981; Reddy and Salagram, 1987). The same relation between K values and EG fraction was observed for both sites. This indicates
that increase of the EG fraction did not cause the mobility of cations into spinel network. However, the same conclusion cannot be inferred for sample synthesized with
(H2O)0.2:(EG)0.8. It was seen a decrease in KT values and increase for Ko. These changes can be attributed to the weakening in metal-oxygen bond at the tetrahedral site due to mobility of cations into network spinel. Migrations of cations with small ionic radius from
Table 2.2. Values of x, T,O, Ko and KT for all samples synthesized.
Samples x ν (cm
-1) K.103 (dyne.cm-1)
νT νO KT KO
EG0 0.0 566.9 419.3 239.2 135.1
(H2O)0.8:(EG)0.2 0.2 580.3 446.1 250.7 143.2
(H2O)0.6:(EG)0.4 0.4 591.0 451.4 258.1 148.9
(H2O)0.4:(EG)0.6 0.6 592.3 450.9 258.1 148.9
(H2O)0.2:(EG)0.8 0.8 588.4 459.5 251.8 160.5
EG1 1.0 585.6 454.8 258.8 152.0
Source: Author
Figure 2.6. K values for tetrahedral (KT) and octahedral (KO) site plotted as a function of
x.
2.3.4 Mössbauer Spectroscopy
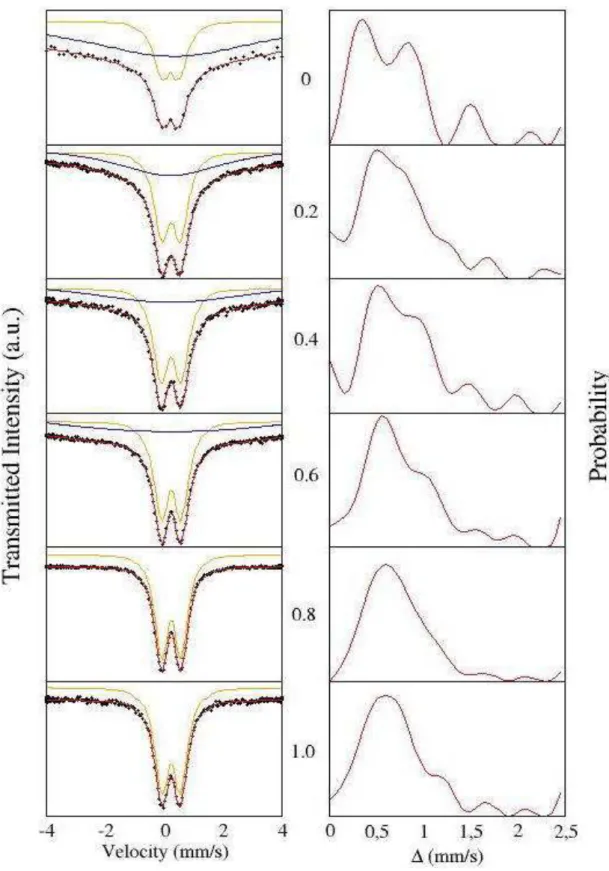
Fig. 2.7 shows Mössbauer spectrum at room-temperature of the samples of the (H2O)1-x:(EG)x system. The dots represent the experimental data, while solids lines illustrate least-squares fitting. All synthesized samples presented strong superparamagnetic characteristics due to their particle size (Knobel et al., 2008) which was evidenced by a doublet at the centre of spectra (Wang and Li, 2001; Siddique and Butt, 2010). When the sizes decrease, the thermal energy strongly contributes to the collapse of the magnetic ordering and the superparamagnetic relaxation phenomenon is observed. Furthermore, it is interesting to note that for samples with fraction (x) between 0 and 0.6 it was needed to add sub-spectrum (continuous lines in different colors inside each spectrum) for a better fit to the baseline. This corresponds to different environments at the iron nucleus. As reported above, the doublet (orange line) corresponds to Fe atoms into small particles with superparamagnetic character. It was also found a V-shaped sub-spectrum (blue line). This can be explained by substitution of manganese ions with those of zinc, weakening the magnetic interactions, thus reducing A–B sites coupling pairs (Upadhyay et al., 2003). The said sub-spectrum V-shaped was gradually disappearing with increase EG fraction.
Figure 2.7. Mössbauer spectra (left) and quadrupole (Δ) distribution (right) for samples of the system (H2O)1-x:(EG)x, where x denotes the amount of the EG used to compose the solvent. The corresponding x values are reported beside spectrum.