may-aug. 2016, Vol. 26, No. 64, 171-180. doi:10.1590/1982-43272664201603
Psychometric Analysis of Disordered Eating in Sports Scale (DES)
1Article
Leonardo de Sousa Fortes2 Universidade Federal de Pernambuco,
Vitória de Santo Antão-PE, Brazil
Sebastião de Sousa Almeida Universidade de São Paulo,
Ribeirão Preto-SP, Brazil
Maria Elisa Caputo Ferreira Universidade Federal de Juiz de Fora,
Juiz de Fora-MG, Brazil
Abstract: There is no specific psychometric scale that addresses disordered eating among Brazilian athletes. This study’s aim was to analyze the psychometric properties of the Disordered Eating in Sports Scale (DES) among Brazilian athletes. A total of 1,338 athletes, both sexes, from various sports participated in the study; 141 were excluded. The DES and the Eating Attitudes Test (EAT-26) were used to assess disordered eating among the study participants. Exploratory factor analysis revealed a factor structure that explains more than 40% of the scale’s variance. The final version’s items presented factors loadings greater than .3. The Pearson correlation showed a statistically significant relationship between the DES and EAT-26 subscales. No differences were found in the mean scores of DES in an interval of two weeks. The findings indicate differences in DES scores due to body adiposity. The conclusion is that DES showed satisfactory concurrent and discriminant validity and reproducibility.
Keywords: eating behavior, athletes, psychometrics
Análise Psicométrica da Escala de Atitudes Alimentares no Esporte (EAAE)
Resumo: Não existe escala psicométrica específica que avalie atitudes de risco para os transtornos alimentares em atletas brasileiros. O objetivo do estudo foi analisar as propriedades psicométricas da Escala de Atitudes Alimentares no Esporte (EAAE). Participaram 1.338 atletas de ambos os sexos de diversas modalidades esportivas, no entanto, 141 foram excluídos. Utilizaram-se a EAAE e o Eating Attitudes Test (EAT-26) para avaliar atitudes de risco para os transtornos alimentares nos participantes da pesquisa. A análise fatorial exploratória demonstrou estrutura fatorial que explicou mais de 40% da variância da EAAE. Os itens da versão final da EAAE demonstraram cargas fatoriais superiores a 0,3. A correlação de Pearson indicou relação estatisticamente significante entre a EAAE e as subescalas do EAT-26. Não se identificou diferença das médias dos escores da EAAE no intervalo de duas semanas. Os achados revelaram diferença dos escores da EAAE em função da adiposidade corporal. Concluiu-se que a EAAE demonstrou validade concorrente, discriminante e reprodutibilidade satisfatórias.
Palavras-chave: comportamento alimentar, atletas, psicometria
Análisis Psicométrico de la Escala de Actitudes Alimentarias en el Deporte (EAAD)
Resumen: No existe una escala psicométrica específica para evaluar las actitudes de riesgo de trastornos alimentarios en atletas brasileños. El objetivo del estudio fue analizar las propiedades psicométricas de Escala de Actitudes Alimentarias en el Deporte (EAAD). Participaron 1.338 atletas hombres y mujeres de diferentes deportes, aunque 141 fueron excluidos. Fueron utilizadas EAAD y la Eating Attitudes Test (EAT-26) para evaluar las actitudes de riesgo de trastornos alimentarios en los participantes de la encuesta. El análisis factorial mostró estructura que explica más del 40% de la varianza. Los ítems de la EAAD mostraron un factor de carga superior a 0,3. La correlación de Pearson mostró una relación estadísticamente significativa entre la EAAD y las sub-escalas de la EAT-26. No se encontraron diferencias en las puntuaciones medias de la EAAD. Los resultados indicaron diferencia de las puntuaciones de EAAD como una función de la grasa corporal. Se concluyó que la EAAD demostró validez concurrente, discriminante y reproducibilidad satisfactoria.
Palabras clave: conducta alimentaria, atletas, psicometría
1 This paper derived from a doctoral dissertation defended by the primary author under the supervision of the third author in 2015 in the Graduate Program in Psychology at the Universidade Federal de Juiz de Fora. 2 Correspondence address:
Leonardo de Sousa Fortes. Rua Clóvis Beviláqua, 163/1003, Madalena. CEP 50710-330. Recife-PE, Brazil. E-mail: [email protected]
Anorexia and bulimia nervosa are the most commonly known eating disorders (Ekeroth & Birgegård, 2014). From 1% to 4% of the population in general is affected by anorexia and bulimia nervosa, respectively (Ekeroth & Birgegård, 2014). More specifically, studies indicate that the prevalence of these psychiatric syndromes is even greater among athletes (Fortes, Ferreira, Oliveira, Cyrino, & Almeida, 2015; Francisco, Narciso, & Alarcão, 2013; Plateau, McDermott, Arcelus, & Meyer, 2014).
In fact, many athletes adopt behavior that is typical of patients diagnosed with eating disorders, namely: restricting the intake of food for long periods, self-inducing vomiting, using laxatives/ diuretic drugs to lose body weight, and strenuous physical exercises (Fortes, Kakeshita, Almeida, Gomes, & Ferreira, 2014), behaviors known as “disordered eating behaviors” (El Ghoch, Soave, Cafugi, & Dalle Grave, 2013).
that emphasizes the body (e.g., acrobatic diving or artistic gymnastics; Fortes et al., 2015) or those sports in which body weight is key to maximize performance (e.g., boxing, judo, or taekwondo; Rouveix, Bouget, Pannafieux, Champely, & Filaire, 2007). Nonetheless, existing psychometric tools used to assess disordered eating behaviors are not specific for the athletic population.
Various instruments written in English have been developed in the last 30 years to assess disordered eating behaviors in the population in general, including the Eating Attitudes Test - EAT-26 (Garner, Olmsted, Bohr, & Garfinkel, 1982), Eating Disorders Inventory - EDI (Garner, Olmsted, & Polivy, 1983), Bulimic Investigatory Test - BITE (Henderson & Freeman, 1987), and the Eating Disorder Examination - EDE (Fairburn & Cooper, 1993). These scales address general information concerning symptomology or identify eating disorders. In Brazil, only the EAT-26 (Bighetti, C.B. Santos, J.E. Santos, & Ribeiro, 2004) and BITE (Ximenes, Colares, Bertulino, Couto, & Sougey, 2011) were translated and validated while the EAT-26 was validated only for women and, even though the BITE was validated for both sexes, its items are more directed to the female sex, indicating that there is a need for instruments directed to the male population. Moreover, all these scales were created to identify eating disorders in the population in general.
It is not advisable to identify athletes at risk of experiencing disordered eating behaviors using psychometric tools not sensitive to their peculiarities. Note that the environment of sports presents characteristics (e.g. pressure from coaches to improve performance and apparel that highlights the body shape) that, according to Fortes et al. (2015), render athletes vulnerable to eating disorders. Hence, it is extremely important to devise instruments with specific items addressing the environment of sports to more reliably analyze the frequency of disordered eating behaviors among athletes (Galli et al., 2013; Petrie et al., 2013). In this sense, we intended to create and validate the Disordered Eating in Sports Scale (DES) to be used in the context of sports. Its items are classified on a five-point Likert scale (0 = never to 4 = always) and are intended to analyze the frequency of disordered eating behaviors among athletes. The items of the DES male version are more related to increased muscle mass, while those from the female version focus on decreased body weight. It is worth noting, however, that both versions present items addressing weight loss and increased muscle mass. Finally, this study’s objective was to analyze this scale’s psychometric properties (validity, concurrent, discriminant and reproducibility).
Method
Development of DES Items
The deductive method (DeVellis, 2003) was used to develop the DES. Hence, the items were initially based on the findings of two qualitative studies (De Bruin, Oudejans, Bakker, & Woertman, 2011; Plateau et al., 2014) and reports of two systematic reviews (Bratland-Sanda & Sundgot-Borgen, 2013; El Ghoch et al., 2013).
The DES initial version was composed of 31 items (female and male versions). Six professionals with a PhD degree (two nutritionists, two psychologists, and two physical educators),
experts in the field of disordered eating, were invited to compose the group of experts. The experts were asked to carefully analyze the items of the instrument’s initial version, using standardized forms in order to determine whether the items assessed disordered eating behaviors.
The instrument’s second version containing 36 items was developed based on reformulations and additions suggested to the initial version. The experts were asked to analyze the clarity and level of understanding of each of the instrument’s items. The experts were asked to carefully read each item and answered a verbally adapted scale according to the following question: “Did you understand the question?” on a Likert scale: 0 = I did not understand, 1 = I understood a little, 2 = I understood somewhat, 3 = I understood almost everything but still have doubts, 4 = I understood almost everything, 5 = I understood perfectly well and have no doubts. Answers zero, one, two and three refer to insufficient understanding. We also asked the experts to suggest changes and justify their suggestions whenever they did not understand a question or when the language did not seem appropriate.
All the scale’s items reached a mean equal to or greater than 4 (I understood almost everything), as recommended by DeVellis (2003), so that the DES second version was applied in a diversified sample of athletes and coaches. The athletes and coaches were asked to fill out a scale concerning the items’ verbal comprehension (0 = I did not understand anything, 1 = I understood just a little, 2 = I somewhat understood, 3 = I understood almost everything but still have doubts, 4 = I understood almost everything, 5 = I understood perfectly well and have no doubts). The entire process of the scale’s development took five months.
Participants
The population was composed of professional and amateur Brazilian athletes aged 12 years old or older. The sample size was calculated based on the report of a psychometrics expert (DeVellis, 2003) and considering that the scale has 36 items. A minimum sample size of 360 athletes of each sex was established for the psychometric validation. Considering sample losses reported by other studies addressing Brazilian athletes (Fortes, Almeida, et al., 2014; Fortes, Kakeshita, et al., 2014), we decided to add a percentage of 20%. Hence, a number of 432 athletes of each sex was established as this study’s sample size.
The following inclusion criteria were adopted: (a) signing a free and informed consent form (or having it signed by a legal guardian in case of minors) and an agreement form; (b) systematically training the sport for at least six hours per week (e.g. at least three days per week for two hours per session or at least six days per week for one hour per session); (c) having participated at least of one regional competition in 2014; (d) be willing to answer the questionnaires and take part in the anthropometric assessment. Exclusion criteria were: (a) having some physical or intellectual disability (reported by the coach); or (b) having used psychoactive medications in the last six months (self-reported).
included, but 141 male athletes and 72 female athletes were excluded for not having completed the entire questionnaire and/or for not having participated of the anthropometric measurement, so that a final sample of 713 male athletes were included [Track and Field (n = 19), Basketball (n = 68), Boxing (n = 12), Canoeing (n = 9), Cycling (n = 16), Soccer (n = 83), Handball (n = 29), Equestrianism (n = 5), Jiu-Jitsu (n = 39), Judo (n = 38), Olympic weightlifting (n = 6), Swimming (n = 136), Water Polo (n = 24), Rowing (n = 23), Rugby (n = 17), Acrobatic diving (n = 6), Surf (n = 69), Taekwondo (n = 12), Tennis (n = 5), Triathlon (n = 15), Sailing (n = 9), Volleyball (n = 52), and Beach volleyball (n = 21)]. The male athletes’ mean age was 17.38 years old (SD = 1.34), 6% presented incomplete middle school and 6% had completed middle school, 19% reported incomplete high school and 24% reported complete high school, 31% had attended some college and the remaining 24% had a bachelor’s degree. The other 484 athletes were women [Track and Field (n = 8), Basketball (n = 34), Boxing (n = 6), Cycling (n = 11), Soccer (n = 36), Artistic Gymnastics (n = 28), Rhythmic Gymnastics (n = 11), Handball (n = 33), Jiu-Jitsu (n = 26), Judo (n = 30), Synchronized Swimming (n = 38), Swimming (n = 84), Figure Skating (n = 17), Water Polo (n = 15), Remo (n = 6), Acrobatic Diving (n = 4), Surf (n = 10), Taekwondo (n = 7), Tennis (n = 8), Triathlon (n = 4), Vela (n = 3), Volleyball (n = 57) and Beach Volleyball (n = 8)], with a mean age of 17.11 (±1.55) years old, 3% of which presented incomplete middle school, 14% had attended complete middle school, 10% reported incomplete high school, 21% reported complete high school, 36% attended some college and the remaining 16% had a bachelor’s degree. All the athletes were associated to the athletic clubs of eight Brazilian states: Ceará (n = 83), Minas Gerais (n = 256), Paraíba (n = 109), Pernambuco (n = 287), Paraná (n = 42), Rio de Janeiro (n = 161), Rio Grande do Sul (n = 58), and São Paulo (n = 201).
Instruments
Disordered Eating in Sports Scale – DES. It was used to assess disordered eating behaviors among athletes. It is a self-reporting scale composed of 36 items, classified in a five-point Likert scale (0 = never, 1 = rarely, 2 = sometimes, 3 = almost always, 4 = always), intended to assess behavior, attitudes and disordered eating behaviors in the field of sports. The higher the score, the greater one’s vulnerability to disordered eating.
Eating Attitudes Test - EAT-26 (Garner et al., 1982). This instrument was applied to assess disordered eating behaviors. The EAT-26 final score results from the sum of its 26 items. There are six options of responses that range from 0 to 3 (always = 3, many times = 2, frequently = 1, a few times = 0, almost never = 0, and never = 0). The version used was validated for the Brazilian population (Bighetti et al., 2004) presenting an internal consistency equal to .82. The Cronbach’s alpha for this study was equal to .88 for men and .89 for women.
A (caliper) scientific compass LANGE® (Cambridge Scientific Industries Inc.) was used to measure the thickness of skin folds and calculate percentage of body fat (%BF). Measurement of skin folds was performed according to standard procedures recommended by the International Society for Advancement for
Kinanthropometry (http://www.isakonline.com).
%BF was estimated according to the protocols proposed by Slaughter et al. (1988) – taking into account ethnicity and maturational stage based on chronological age (pubescent - 12 to 14 years old; post-pubescent - 15 to 17 years old) –, and by Jackson and Pollock (1978) and Jackson, Pollock and Ward (1980) for male and female adolescents and adults, respectively.
Note that body adiposity was classified according to cut off points established by Lohman (1987) (male sex: < 6% = very low; > 7% and < 12% = low; > 13% and < 18% = normal; >19% and < 25% = moderately high; > 26% and < 32% = high; > 32% = very high; female sex: < 11% = very low; > 12% and < 15% = low; > 16% and < 25% = normal; > 26% and <30% = moderately high; > 31% and < 35% = high; > 35% = very high). The classifications very low and low were grouped together in the category low body adiposity, normal and moderately high were grouped in normal body adiposity, and high and very high were grouped in high body adiposity.
Body mass was measured using a portable digital scale Tanita® with accuracy of 0.1 kg and maximum capacity of 220 kg. A portable stadiometer with accuracy of 0.1 cm and maximum height of 2.20 m Tonelli® was used to measure the height of athletes. Body Mass Index (BMI) was obtained using the formula: BMI = body mass (kg)/height (m2).
Procedure
Data collection. The researchers identified coaches of
various teams from various sports to explain the procedures and the study’s objectives. After the coaches’ agreement was obtained, a meeting was scheduled with each team to talk with the athletes and explain the study’s ethical procedures.
The study was divided into two stages. The first comprised the application of DES and EAT-26. Note that only one researcher was responsible for the application of these questionnaires, so that the procedure was standardized and participants were not influenced by differences in the explanations of other researchers.
The athletes received verbal orientation and written orientation was also provided in the questionnaires. The researcher responsible for applying the instruments clarified doubts and no communication among the study’s participants was allowed. The questionnaires were distributed when the athletes entered the room and participation was voluntary. No time limit was established for the completion of the questionnaires.
The second stage initiated immediately after the application of the questionnaires and included anthropometric measures (body mass, height, and skin folds). The athletic clubs included in the study provided appropriate rooms for the assessments. The measurements were performed individually to avoid interferences from other members of the teams.
These procedures were performed in the clubs and/or competitive events of 11 cities in eight Brazilian states during ten months until the desired sample was achieved. Each team was visited only once.
Data analysis. Exploratory factor analysis with principal-axis factoring and Varimax orthogonal rotation was used to extract the DES factors, as suggested in the scientific literature (DeVellis, 2003). The factor solution that explained a variance greater than 40% of the scale was used, replicating the method used by another study addressing athletes (Galli et al., 2013). Additionally, the factors were only considered if composed of three or more items with loading greater than .3, according to other studies validating psychometric scales to identify disordered eating (Fairburn & Cooper, 1993; Henderson & Freeman, 1987). Also, the DES items that presented factor loadings greater than .3 in more than one factor were excluded from the analysis. Cronbach’s alpha was used to analyze the instrument’s and its subscales’ internal consistency. The Kolmogorov-Smirnov test was used to verify distribution of data. Parametric techniques were chosen due to the distribution of the DES scores and Pearson’s correlation was used to verify concurrent validity (relationship between the DES subscales with those of EAT-26). To assess the DES reproducibility, dependent Student’s t-test was performed to compare the DES scores in the test-retest (interval of two weeks). Intra-class correlation (rintra-class) was performed to relate the scores obtained in the DES items in the test-retest. Discriminant validity was verified with the univariate analysis of covariance (ANCOVA), controlling for age to compare the DES scores of classifications regarding fat percentage (low, normal and high). We chose to control age because other studies indicate there is a relationship between
age and disordered eating behaviors among athletes (Fortes, Almeida, et al., 2014; Fortes et al., 2015). The Bonferroni post hoc test was used to identify the groups that differed. Additionally, the Cohen size effect, represented by d, was calculated to indicate the importance of the findings from a practical point of view. Data analysis was performed using SPSS 21.0 and 5% was the level of significance adopted.
Ethical Considerations
The project was approved by the Institutional Review Board at the Faculdade de Filosofia, Ciências e Letras de Ribeirão Preto of the Universidade de São Paulo (CAAE n. 05166712.8.0000.5407). The legal guardians of athletes younger than 18 years old signed free informed consent forms that contained the study’s objectives and procedures. All the athletes (adults and minors) signed a consent form agreeing with voluntary participation. Confidentiality of the participants’ identities and data was ensured.
Results
The demographic characteristics of the athletes addressed in this study are presented in Table 1.
The factor analysis conducted with the 36 items in the DES male version indicated problems with 15 items, namely: 2 (“My diet is so well-balanced that I do not
Table 1
Demographic Characteristics of Athletes Participating in the Study
Variable
Sex
Female (N = 484) Male (N = 713)
M (SD) Min - Max M (SD) Min - Max
Age (years) 17.11 (1.55) 12.00 - 36.00 17.88 (1.34) 12.00 - 41.00
Duration of sports practice (years) 8.76 (2.33) 3.00 - 24.00 9.60 (1.95) 2.00 - 28.00
Weekly training regimen (hours) 12.71 (2.89) 6.00 - 36.00 13.51 (2.24) 6.00 - 42.00
Percentage of fat 21.60 (4.48) 9.23 - 32.45 17.73 (5.01) 4.31 - 29.70
Body Mass Index (kg/m²) 22.97 (1.32) 15.29 - 30.10 23.56 (1.22) 16.39 - 30.85
N % N %
Age
12 – 18 years old 262 54 359 50
18 – 25 years old 145 30 230 32
> 25 years old 77 16 124 18
Competitive level
Regional 93 19 46 7
State 160 33 250 35
National 104 22 231 32
International 127 26 187 26
Ethnicity
Caucasian 288 60 306 43
Afro-descendant 81 16 214 30
Asian 44 9 61 9
need to take medications and/or supplements to improve my performance”), 3 (“I do not usually eat much before training sessions”), 5 (I think my coach is satisfied with my diet”), 6 (“I eat a lot before training sessions”), 10 (“I guess my coach wish I were stronger”), 13 (“My teammates push me to become more muscular”), 14 (“I do not believe that dietary supplements, for instance Whey Protein, Creatine, BCAA, or L-Carnitine would improve my performance”), 16 (“I keep exercising when I am hurt”), 17 (“I think that my diet is appropriate to improve my performance in competitions”), 21 (“I think that my teammates find my eating habits healthy”), 23 (“I use laxatives and/or diuretics before competitions to loose weight”), 27 (“I feel guilty when I eat in excess after competitions”), 28 (“I use steroids
to improve my athletic performance”), 29 (“I think my opponents would like to have a diet like mine”), and 33 (“I think my opponents find me weak”).
Factor analysis with 21 items was performed afterwards, which showed a solution of five factors that explained 51.15% of the variance in the DES male version. KMO was equal to .89 and Bartlett’s sphericity test indicated a value of 2,871.90 (p = .001). The commonalities of all items were greater than .25. The factor loadings of all items were greater than .3. Additionally, the findings of all the items show factor loadings in a single factor, as indicated in Table 2.
The factor analysis performed with the 36 items of the DES female version revealed problems with 17 items, namely: 2 (“My diet is so well-balanced that I do
Table 2
Analysis of Factors of the DES Male Version
Items Questions Factor 1 Factor 2 Factor 3 Factor 4 Factor 5
1 I do not usually eat before training. .46
4 I eat any type of food before training .59
7 I practice beyond the necessary to burn calories .64
8 I like to feel my stomach empty after training sessions .59
9 After training I eat until I feel satiated .67
11 I wear warm/plastic clothes during training to lose weight .66
12 I eat more than necessary after training sessions .67
15 I avoid eating in the weeks that precede competitions .65
18 I always feel hungry after training .73
19 I refuse using steroids when my peers offer .49
20 I eat in excess on days that precede competitions .79
22 I eat food I like after competitions .67
24 I think I should change my eating habits due to the demands of my sport .62
25 I eat foods that favor weight gaining on the eve of competitions .73 26 I think that using substances to lose weight, laxatives and diuretics for
instance, would compromise my sports performance .60
30 I usually eat nothing after competition .51
31 I would like to use food supplements that can improve my performance
during training. .67
32 I eat an amount of food that is considered to be normal for athletes that
practice my sport .67
34 I exercise beyond the recommended by my coach to gain muscles .64
35 I do not eat beyond what my stomach can take before competitions .75
36 I train on days when I am supposed to rest to increase my muscle mass .59
% of the variance explained 16.95 15.97 7.32 6.26 5.33
Cronbach’s α .78 .66 .75 .73 .66
Kaiser-Meyer-Olkin (KMO) .89 p < .001
Bartlett’s test 2,871.90 p < .001
Note. Name of the subscales: Factor 1 = Binge eating in the field of sports, Factor 2 = Food restriction and weight reduction, Factor 3 = Healthy eating behavior in the sports context [all the items present an inverted score (4 = never, 3 = rarely, 2 = sometimes, 2 = almost always, 1 = always)], Factor 4 = The use of substances/drugs and satiety in sports [all the items present inverted scores (4 = never, 3 = rarely, 2 =
not need medications and/or supplements to improve my performance”), 4 (“I eat any type of food before training”), 5 (I think my coach is satisfied with my diet”), 6 (“I eat a lot before training sessions”), 7 (“I practice beyond the necessary intending to burn calories”), 8 (“I like to feel my stomach empty after training sessions”), 12 (“After training sessions I eat more than the necessary”), 13 (“My teammates push me to become more muscular”), 14 (“I do not believe supplements would improve my performance”), 15 (“I avoid eating in the weeks that precede competitions”), 16 (“I keep exercising when I am hurt”), 20 (“I eat compulsively on days that precede competitions”), 22 (“I eat food I like after competitions”), 24 (“I realize I should change my eating habits due to the demands of my sport”), 25 (“I eat food that favor weight gaining on the eve of competitions”),
35 (“Before competitions I do not eat more than what my stomach tolerates”), and 36 (“I train on days I am supposed to rest to decrease my body fat”).
Afterwards, factor analysis was conducted with 19 items, forcing a solution of 4 factors, which explained 45.24% of the variance in the DES female version. KMO was equal to .76 and the Bartlett’s sphericity test indicated a value of 1,980.78 (p = .001). The communalities of all items were greater than .24. The factor loadings of all items were greater than .3. Additionally, the findings of all the items showed factor loading in a single factor, as indicated in Table 3.
With regard to the internal consistency, Cronbach’s alpha obtained by the DES male version was .74 and the Cronbach’s alphas obtained by factors 1, 2, 3, 4 and 5 were .78, .66, .75,
Table 3
Analysis of Factors of the DES Female Version
Items Questions Factor 1 Factor 2 Factor 3 Factor 4
1 I do not usually eat before training. .76
3 I do not usually eat much before training .62
9 After training I eat an amount of food that satiates me .52
10 I think my coach would like I were skinner .74
11 I wear warm/plastic clothes during training to lose weight .60
17 I think my diet is appropriate to improve my performance in competitions .68
18 I always feel hungry after training .38
19 I refuse using steroids when my peers offer .46
21 I guess my teammates think my eating habits are healthy .82
23 I use laxatives and/or diuretics before competitions to lose weight .71
26 I think that using substances to lose weight, laxatives and diuretics for instance,
would compromise my sports performance .51
27 I feel guilty when I eat in excess after competitions .68
28 I use laxative and/or diuretics to improve my athletic performance .86
29 I think my opponents would like to have a diet like mine .63
30 I do not usually eat after competing .43
31 I would like to use food supplements to improve my performance during trainings. .34 32 I eat an amount of food that is considered to be normal for athletes that practice my
sport .69
33 I think my opponents think that I am fatty .73
34 I exercise harder to stay skinny .66
% of the variance explained 16.25 12.24 9.03 7.72
Cronbach’s α .60 .71 .82 .78
Kaiser-Meyer-Olkin (KMO) .76 p < .001
Bartlett’s test 1,980.78 p < .001
.73 and .66, respectively (Table 2). The DES female version obtained an internal consistency of .75, while factors 1, 2, 3 and 4 obtained .60, .71, .82 and .78, respectively (Table 3).
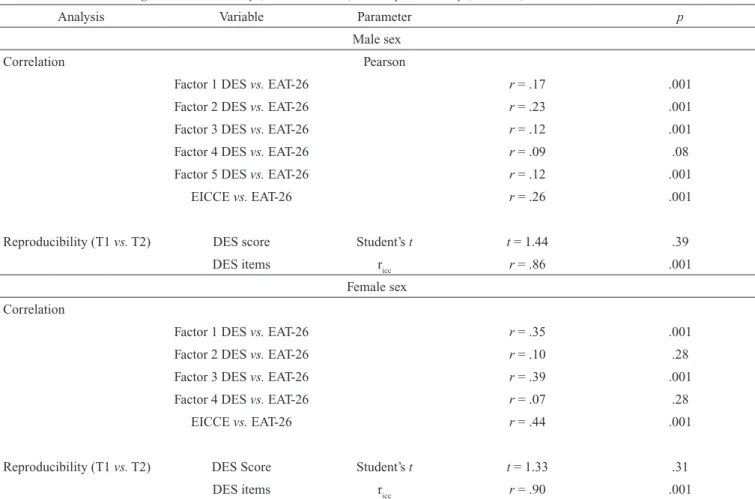
Table 4 presents the results concerning the scale’s concurrent validity. Pearson’s correlation showed a
statistically significant relationship between DES and EAT-26 (p ≤ .001).
With regard to the scale’s reproducibility, no differences were identified between the means of scores obtained in the male (F(2, 710) = 3.14, t = 1.44, p = .39, d = .1) and female versions
Table 4
Statistical Data Concerning Concurrent Validity (DES vs. EAT-26) and Reproducibility (T1 vs. T2)
Analysis Variable Parameter p
Male sex
Correlation Pearson
Factor 1 DES vs. EAT-26 r = .17 .001
Factor 2 DES vs. EAT-26 r = .23 .001
Factor 3 DES vs. EAT-26 r = .12 .001
Factor 4 DES vs. EAT-26 r = .09 .08
Factor 5 DES vs. EAT-26 r = .12 .001
EICCE vs. EAT-26 r = .26 .001
Reproducibility (T1 vs. T2) DES score Student’s t t = 1.44 .39
DES items ricc r = .86 .001
Female sex Correlation
Factor 1 DES vs. EAT-26 r = .35 .001
Factor 2 DES vs. EAT-26 r = .10 .28
Factor 3 DES vs. EAT-26 r = .39 .001
Factor 4 DES vs. EAT-26 r = .07 .28
EICCE vs. EAT-26 r = .44 .001
Reproducibility (T1 vs. T2) DES Score Student’s t t = 1.33 .31
DES items ricc r = .90 .001
Note. DES = Disordered Eating in Sports Scale; EAT-26 = Eating Attitudes Test.
(F(2, 482) = 2.13, t = 1.33, p = .31, d = .1), applied at a two-week interval. The effect size was low for both sexes, indicating that it is likely that no differences will be found in the scores obtained in the DES when applied in samples similar to the one addressed in this study within a period of two weeks. Additionally, the intra-class correlation coefficient was statistically significant for the male (r = .86, p = .001) and female (r = .90, p = .001) versions, indicating good reproducibility.
Despite discriminant validity, ANCOVA indicated statistically significant difference in the scores obtained in the male (F(3, 710) = 56.91, p = .001, d = .6) and female versions (F(3, 481) = 37.24, p = .01, d = .5) due to the classifications of body adiposity. High body adiposity in the male group scored higher than normal body adiposity (F(2, 711) = 37.05, p = .01, d = .5), and low body adiposity (F(2, 711) = 76.50, p = .001, d = .6). Likewise, the category normal body adiposity scored higher than low body adiposity (F(2, 710) = 42.17, p = .01, d = .5). High body adiposity in the female sex scored higher than the normal body adiposity (F(2, 344) = 31.57, p = .01, d = .5) and low body adiposity (F(2, 290) = 53.01, p = .001, d = .6).
Similarly, normal body adiposity scored higher than the low body adiposity category (F(2, 360) = 31.87, p = .01, d = .5). Note that age revealed collinearity with DES scores for the male sex (F(1, 712) = 12.35, p = .01), which did not occur with the female sex (F(1, 483) = 2.09, p = .28).
Discussion
The study’s primary goal was to analyze the DES’ psychometric validity among Brazilian athletes. The findings present a factor structure that explains more than 40% of the scale’s variance and internal consistency, with values greater than .60 in all the subscales. Additionally, the DES findings indicated concurrent validity as well as appropriate reproducibility, assessed in an interval of two weeks. Finally, the results show discriminant validity based on the classifications of body adiposity.
scale because they did not present a minimum factor loading of .30, or factor loading was equal to or higher than 0.30 in more than one factor. The DES female version showed a structure distributed into four factors that explained approximately 46% of its variance. A total of 17 items were excluded, as they presented factor loading equal to or higher than .30 in more than one factor. Note that another study addressing the development of a psychometric scale for athletes also reports the exclusion of items to achieve the scale’s final version (Martinsen, Holme, Pensgaard, Torstveit, & Sundgot-Borgen, 2014). Additionally, the cut off point of .30 for the factor loading was also adopted by another study validating a psychometric scale directed to athletes (Scoffier, Paquet, Corrion, & d’Arripe-Longueville, 2010), corroborating this study’s findings. Nonetheless, other studies addressing the validation of psychometric tools intended to identify eating disorders in the Brazilian population did not perform factor analysis (Bighetti et al., 2004; Ximenes et al., 2011) hindering further comparisons.
The internal consistency presented by the DES male version was greater than .65 for the total scale and subscales. Thus, it is in agreement with the recommendations of experts in psychometrics (DeVellis, 2003). The internal consistency of the DES female version was also equal to or greater than .65 for all the factors except for Factor 1, the internal consistency of which was .60. Authors emphasize that the number of items influences the internal consistency of a subscale (Galli et al., 2013; McNamara & McCabe, 2013), thus, a subscale with few items can reach internal consistency below .70. This was identified for Factors 2 and 5 of the male version and Factor 1 of the female version, that is, a small number of items were presented in these factors. Another study addressing a psychometric validation for the population of athletes revealed internal consistency below .70 for some subscales (McNamara & McCabe, 2013), corroborating this study’s findings.
The findings indicate there is a significant statistical relationship (between .12 and .26) between the DES male version and EAT-26. The results also indicate a statistically significant relationship (between .35 and .44) between the DES female version and EAT-26, which is in agreement with the concurrent validity processes of other studies addressing psychometric instruments aimed to identify disordered eating (Fairburn & Cooper, 1993; Henderson & Freeman, 1987). These findings indicate that the higher the score obtained in the DES, the higher the scores obtained in another psychometric tool that assess disordered eating behaviors. Note that other studies addressing the validation of psychometric scales directed to athletes also reveal concurrent validity (Martinent, Decret, Isoard-Gautheur, Filaire, & Ferrand, 2014; McNamara & McCabe, 2013).
It is worth noting that Factor 4 (“The use of substances/ drugs and satiety in sports”) of the DES male version does not relate to EAT-26. This finding may be explained by the fact that the DES Factor 4 is intended to analyze the refusal of individuals to use anabolic steroids/drugs and satiety while the EAT-26 assess food restriction, purging and environmental forces that encourage food intake. Hence, because these are
different constructs, the results do not indicate a statistically significant relationship, which is in agreement with the findings of other studies addressing athletes (Besharat, 2010; Martinent et al., 2014).
Likewise, no relationship was found between Factor 2 of the DES female version and EAT-26, or between Factor 4 and EAT-26. These results can be explained by the fact that Factor 2 analyzes the perception of athletes with regard to their diet and Factor 4 assesses healthy eating habits in the sports environment, while the EAT-26 assesses food restriction, purging and forces from the environment encouraging food intake. Hence, the constructs are different and the results do not reveal statistically significant relationships, which is in agreement with the results reported by other studies addressing athletes (Besharat, 2010; Martinent et al., 2014).
With regard to the scale’s reproducibility, no differences were found in the DES test-retest. The intra-class correlation coefficient was significant for both the male (r = .86) and female (r = .90) versions. These findings indicate the DES’ good stability in a period of two weeks, corroborating the recommendations of a psychometrics expert (DeVellis, 2003). Other studies also report good stability of other psychometric tools to identify eating disorders (Fairburn & Cooper, 1993; Henderson & Freeman, 1987). Note, however, that other studies addressing the validity of scales directed to athletes did not analyze the stability of the psychometric tool (Galli et al., 2013; Martinsen et al., 2014; McNamara & McCabe, 2013), which hinders comparisons with the results presented by this study.
The results concerning discriminating validity reveal differences in the scores obtained in the DES due to the body adiposity classifications, that is, the higher one’s body adiposity, the higher the DES score. This finding indicates that the instrument has good discriminant validity, since the findings of other scientific investigation indicate that athletes with greater body adiposity more frequently present disordered eating behaviors (Fortes, Almeida, et al., 2014). In the study validating the EAT-26, Garner et al. (1982) addressed a group of women with clinical diagnosis of anorexia nervosa as discriminant validity criterion. According to DeVellis (2003), researchers should adopt a criterion of discriminant validity of the new psychometric tool capable to discriminate individuals with distinct characteristics regarding the phenomenon under study. Therefore, based on this study’s findings, we consider it important to use body adiposity as a criterion of discriminant validity for DES.
representative of the population of Brazilian athletes. Despite these limitations, we believe that both versions (male and female) of DES met psychometric requirements, justifying its use with athletes.
The results indicate that the DES female and male versions present satisfactory factor structure, concurrent and discriminant validity, and reproducibility. Hence, DES is a good instrument to analyze behaviors that favor disordered eating among athletes. This new scale can be used in research and practical (coaches) contexts to analyze disordered eating behaviors in the population of athletes.
Additionally, further studies are needed to assess DES’ external validity. Finally, we recommend that the DES versions be adapted and validated in other languages and cultures to favor comparisons of disordered eating behaviors among athletes from different countries.
References
Besharat, M. A. (2010). Psychometric properties of the Sport Stress Coping Styles Scale. Procedia - Social and Behavioral Sciences, 5, 609-613. doi:10.1016/j. sbspro.2010.07.151
Bighetti, F., Santos, C. B., Santos, J. E., & Ribeiro, R. P. P. (2004). Tradução e validação do Eating Attitudes Test em adolescentes do sexo feminino de Ribeirão Preto, São Paulo [Translation and validation of the Eating Attitudes Test in female adolescents in Ribeirão Preto, SP, Brazil]. Jornal Brasileiro de Psiquiatria, 53(6), 339-346.
Bratland-Sanda, S., & Sundgot-Borgen, J. (2013). Eating disorders in athletes: Overview of prevalence, risk factors and recommendations for prevention and treatment. European Journal of Sport Science, 13(5), 499-508. doi:1 0.1080/17461391.2012.740504
De Bruin, A. P., Oudejans, R. R. D., Bakker, F. C., & Woertman, L. (2011). Contextual body image and athletes’ disordered eating: The contribution of athletic body image to disordered eating in high performance women athletes. European Eating Disorders Review, 19(3), 201-215. doi:10.1002/erv.1112
DeVellis, R. F. (2003). Scale development: Theory and applications (2nd ed.). Newbury Park, CA: Sage.
Ekeroth, K., & Birgegård, A. (2014). Evaluating reliable and clinically significant change in eating disorders: Comparisons to changes in DSM-IV diagnoses. Psychiatry Research, 216(2), 248-254. doi:10.1016/j. psychres.2014.02.008
El Ghoch, M., Soave, F., Cafugi, S., & Dalle Grave, R. (2013). Eating disorders, physical fitness and sport performance: A systematic review. Nutrients, 5(12), 5140-5160. doi:10.3390/nu5125140
Fairburn, C. G., & Cooper, Z. (1993). The eating disorders examination. In C. G. Fairburn & G. T. Wilson (Eds.), Binge eating: Nature, assessment, and treatment (pp. 317-360). New York, NY: Guilford.
Fortes, L. S., Almeida, S. S., & Ferreira, M. E. C. (2014). Influence of psychological, anthropometric and
sociodemographic factors on the symptoms of eating disorders in young athletes. Paidéia (Ribeirão Preto), 24(57), 21-27. doi:10.1590/1982-43272457201404 Fortes, L. S., Ferreira, M. E. C., Oliveira, S. M. F., Cyrino,
E. S., & Almeida, S. S. (2015). A socio-sports model of disordered eating among Brazilian male athletes. Appetite, 92, 29-35. doi:10.1016/j.appet.2015.05.005 Fortes, L. S., Kakeshita, I. S., Almeida, S. S., Gomes, A. R.,
& Ferreira, M. E. C. (2014). Eating behaviours in youths: A comparison between female and male athletes and non-athletes. Scandinavian Journal of Medicine & Science in Sports, 24(1), e62-e68. doi:10.1111/sms.12098
Francisco, R., Narciso, I., & Alarcão, M. (2013). Individual and relational risk factors for the development of eating disorders in adolescent aesthetic athletes and general adolescents. Eating and Weight Disorders, 18(4), 403-411. doi:10.1007/s40519-013-0055-6
Galli, N., Reel, J. J., Petrie, T., Greenleaf, C., & Carter, J. (2013). Preliminary development of the weight pressures in sport scale for male athletes. Journal of Sport Behavior, 34(1), 47-68.
Garner, D. M., Olmsted, M. P., Bohr, Y., & Garfinkel, P. E. (1982). The Eating Attitudes Test: Psychometric features and clinical correlates. Psychological Medicine, 12(4), 871-878. doi.org/10.1017/S0033291700049163
Garner, D. M., Olmsted, M. P., & Polivy, J. (1983). Development and validation of a multidimensional eating disorders inventory for anorexia nervosa and bulimia. International Journal of Eating Disorder, 2(2), 15-34. doi:10.1002/1098-108X(198321)2:2<15::AID-EAT2260020203>3.0.CO;2-6
Henderson, M., & Freeman, C. P. (1987). A self-rating scale for bulimia. The BITE. British Journal of Psychiatry, 150(1), 18-24. doi:10.1192/bjp.150.1.18
Jackson, A. S., & Pollock, M. L. (1978). Generalized equations for predicting body density of men. British Journal Nutrition, 40(3), 497-504. doi:10.1079/BJN19780152 Jackson, A. S., Pollock, M. L., & Ward, A. (1980). Generalized
equations for predicting body density of women. Medicine and Science and Sports and Exercise, 12(3), 175-181. doi:10.1249/00005768-198023000-00009
Lohman, T. G. (1987). The use of skinfold to estimate body fatness on children and youth. Journal of Physical Education, Recreational & Dance, 58(9), 98-103. doi:10. 1080/07303084.1987.10604383
Martinent, G., Decret, J. C., Isoard-Gautheur, S., Filaire, E., & Ferrand, C. (2014). Evaluations of the psychometric proprieties of the Recovery-Stress Questionnaire for athletes among a sample of young French table tennis players. Psychological Reports, 114(2), 326-340. doi:10.2466/03.14.PR0.114k18w2
McNamara, J., & McCabe, M. P. (2013). Development and validation of the Exercise Dependence and Elite Athletes Scale. Performance Enhancement & Health, 2(1), 30-36. doi:10.1016/j.peh.2012.11.001
Petrie, T. A., Galli, N., Greenleaf, C., Reel, J., & Carter, J. (2014). Psychological correlates of bulimic-symptomatology among male athletes. Psychology of Sport and Exercise, 15(6), 680-687. doi:10.1016/j. psychsport.2013.09.002
Plateau, C. R., McDermott, H. J., Arcelus, J., & Meyer, C. (2014). Identifying and preventing disordered eating among athletes: Perceptions of track and field coaches. Psychology of Sport and Exercise, 15(6), 721-728. doi:10.1016/j.psychsport.2013.11.004
Rouveix, M., Bouget, M., Pannafieux, C., Champely, S., & Filaire, E. (2007). Eating attitudes, body esteem, perfectionism and anxiety of judo athletes and nonathletes. International Journal of Sports Medicine, 28(4), 340-345. doi:10.1055/s-2006-924334
Scoffier, S., Paquet, Y., Corrion, K., & d’Arripe-Longueville, F. (2010). Development and validation of the French Self-regulatory Eating Attitude in Sports Scale. Scandinavian Journal of Medicine & Science in Sports, 20(4), 696-705. doi:10.1111/j.1600-0838.2009.00984.x
Slaughter, M. H., Lohman, T. G., Boileau, R. A., Horswill, C. A., Stillman, R. J., Van Loan, M. D., & Bemben, D. A. (1988). Skinfold equations for estimation of body fatness in children and youth. Human Biology, 60(5), 709-723. Thompson, R. A., & Sherman, R. (2014). Reflections
on athletes and eating disorders. Psychology of Sport and Exercise, 15(6), 729-734. doi:10.1016/j. psychsport.2014.06.005
Ximenes, R. C. C., Colares, V., Bertulino, T., Couto, G. B. L., & Sougey, E. B. (2011). Versão brasileira do “BITE” para uso em adolescentes [Brazilian version of “BITE” for use in adolescents]. Arquivos Brasileiros de Psicologia, 63(1), 52-63.
Leonardo de Sousa Fortes is a Professor of the Núcleo de Educação Física e Ciências do Esporte of the Universidade Federal de Pernambuco.
Sebastião de Sousa Almeida is a Full Professor of the Faculdade de Filosofia, Ciências e Letras de Ribeirão Preto at Universidade de São Paulo.
Maria Elisa Caputo Ferreira is an Adjunct Professor of the Faculdade de Educação Física e Desportos at Universidade Federal de Juiz de Fora
Received: May 18, 2015 1st Revision: Sep. 9, 2015 Approved: Oct. 7, 2015 How to cite this article: