Optimization of bioactive compound’s extraction conditions from
beetroot by means of artificial neural networks (ANN)
Raquel P. F. Guiné
1*, Mateus Mendes
2,3, Fernando Gonçalves
1 (1. CI&DETS/CERNAS Research Centre, Dep. Food Industry, Polytechnic Institute of Viseu, 3504-510 Viseu, Portugal;2. Polytechnic Institute of Coimbra – ESTGOH, 3400-124 Oliveira do Hospital;
3. Institute of Systems and Robotics of the University of Coimbra, Dep. of Electrical and Computer Engineering, University of Coimbra, 3030-790 Coimbra, Portugal)
Abstract: The present work used an artificial neural network (ANN) model to correlate beetroot extraction conditions with total phenolic compounds (TPC), anthocyanins (ANT) and antioxidant activity (AOA). The input variables were extraction time, type of solvent, solvent volume/sample mass (VMR = volume to mass ratio) and order of extraction. The ANN models produced showed very good accuracy (R>94%), being suitable for data mining using weight analysis techniques. The experiments involved variable conditions: solvents (methanol, ethanol: water and acetone: water), extraction times (15 and 60 min), VMR (5, 10 and 20), order of extract (3 sequential extractions). The TPC were evaluated by the Folin-Ciocalteu method, ANT by the SO2 bleaching method and AOA following the ABTS method. The experimental results showed that the
extracting solutions used in this study exhibited similar extraction efficiency for TPC, but not for AOA. Also, the results allowed concluding that a higher VMR originated extracts with higher amounts of TPC and AOA.
Keywords:
Citation: Guiné, R. P. F., M. Mendes, and F. Gonçalves. 2019. Optimization of bioactive compound’s extraction conditions from beetroot by means of artificial neural networks (ANN). Agricultural Engineering International: CIGR Journal, 21(4): 216–223.
1 Introduction
Beetroot (or red beet) is a form of Beta vulgaris subsp. vulgaris (conditiva) and comprises several varieties of edible taproots that are cultivated in America, Europe and Asia. As compared to the sugar beet, Beta vulgaris subsp. vulgaris (altissima), it has a considerable lower sugar content, about two times lower, thus being grown for many food uses (pickles, salads, juices) instead of sugar production (Wruss et al., 2015).
Red beetroot constitutes the richest source of betalains, which are a group of phenolic secondary plant metabolites. Betalains are water-soluble, nitrogen-containing natural pigments that can be divided into two groups: red-violet betacyanins and
Received date: 2018-10-10 Accepted date: 2019-01-01 *Corresponding author: Raquel de Pinho Ferreira Guiné, Professor (PhD and Habilitation), CI&DETS/CERNAS Research Centre, Dep. Food Industry, Polytechnic Institute of Viseu, Portugal. Tel: +351 232 446 641, Email: [email protected].
yellow-orange betaxanthins (Ravichandran et al., 2013). The very intense red coloration of beetroots comes from particularly high concentrations of betalains as well as anthocyanins. The betalains are used as natural colorants in the food industry, but have also received increasing attention due to possible health benefits in humans, mostly related to their antioxidant and anti-inflammatory activities (Azeredo, 2009; Sawicki et al., 2016). Furthermore, they have demonstrated antiviral effects and also can inhibit the cell proliferation of human tumour cells (Strack et al., 2003; Reddy et al., 2005).
Natural antioxidants like phenolic compounds have attracted much attention due to their positive effects for the human health. In fact, studies demonstrated that phenolic compounds have outstanding antimicrobial activities and can be utilized instead of synthetic antioxidants and antimicrobial agents in food products. Moreover, they can be used in functional food formulations and pharmaceutical industries for health-promoting effects (Rafiee et al., 2017). The
phenolic compounds are a large group of phytochemicals, existing ubiquitously in plants as secondary metabolites. The most abundant phenolic compounds present in the human diet are phenolic acids, flavonoids and tannins (Tian et al., 2017). Anthocyanins are a type of phenolic compounds belonging to the class of flavonoids, which are present in a very wide range of fruits and vegetables, providing particularly bright colours such as red, blue, purple and orange (Wang et al., 2017).
Artificial neural networks (ANN) is a useful tool for modelling processes in different areas, including food engineering and food chemistry fields. The models created can be used both for predicting output values based on known input variables, as well as for data mining, revealing important correlations between input and output variables. Guiné et al. (2015) successfully modelled the antioxidant activity and phenolic compounds content through ANN for dried bananas. Dahmoune et al. (2015) also used ANN for the prediction of recovery of phenolic compounds from Pistacia lentiscus leaves using ultrasound assisted extraction.
The aim of the present work was to find a model through ANN that could correlate the extraction conditions with the contents of phenolic compounds, anthocyanins and antioxidant activity in beetroot. The input variables evaluated included extraction time, type of solvent, sample mass/solvent volume ratio and order of the extraction step. Hence, the research hypothesis investigated in this work is whether the extraction conditions can be optimized in order to maximize the quantification of phenolic compounds and antioxidant activity in beetroot.
2 Material and methods
2.1 Sampling and extraction procedure
Samples of beetroot (B. vulgaris) were purchased in a local market and carried to the laboratory where they were washed, the peel removed and the pulps triturated for standardization. Samples of 5 g were taken from the ground mass, for the extraction experiments, which included trying different conditions as indicated in Table 1. For each experiment, the same sample mass was used to perform three successive extraction steps.
The experiments in Table 1 allowed obtaining 54
extracts which were then used to quantify the total phenolic compounds, the anthocyanins and the antioxidant activity.
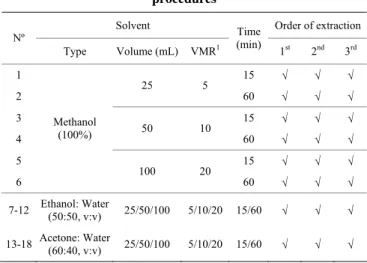
Table 1 Operating conditions tested for the extraction procedures
Solvent Order of extraction Nº Type Volume (mL) VMR1 Time (min) 1st 2nd 3rd 1 15 √ √ √ 2 25 5 60 √ √ √ 3 15 √ √ √ 4 50 10 60 √ √ √ 5 15 √ √ √ 6 Methanol (100%) 100 20 60 √ √ √ 7-12 Ethanol: Water (50:50, v:v) 25/50/100 5/10/20 15/60 √ √ √ 13-18 Acetone: Water (60:40, v:v) 25/50/100 5/10/20 15/60 √ √ √ Note: 1 VMR = Volume/mass ratio.
2.2 Evaluation of total phenolic compounds
The contents of total phenolic compounds (TPC) in the extracts was determined by the Folin-Ciocalteu reagent, by adaptation of the method referred by Gonçalves et al. (2012) and Guiné et al. (2014). For that, 0.125 mL of each sample were added to 0.75 mL of deionized water and 0.125 mL of the Folin-Ciocalteu reagent. Then the solution was left to stand for 6 min, and after that 2 mL of a 5% (m/v) solution of sodium carbonate were added and the mixture was left to rest again for 90 min, at room temperature and in the dark. A calibration curve was obtained with standard solutions of gallic acid and the absorbance was measured in a spectrophotometer at 760 nm. The results were expressed as milligrams of gallic acid equivalents (GAE) per gram of fresh sample, being a mean of three measurements for different conditions of sample mass and volume of extract.
2.3 Evaluation of anthocyanins
Total anthocyanins (ANT) were determined using SO2 bleaching method (Cheynier et al., 1989; Boulton,
2001). For that, 1 mL of each sample was added to equal volume of ethanol acidified by 0.1% HCl and 20 mL of 2% HCl (pH 0.6) solution. In one tube, 2 mL of previous solution was added to 0.8 mL of water (t1). In another tube (t2) 2 mL of previous solution were mixed with 0.4 mL of HNaSO3 solution (15% w/v). After 20 min in
measured at 520 nm. The total anthocyanins (ANT) were calculated using the following equation: TA (mg Mv3G/g) = 875 × (abst1–abst2), and results were expressed as
malvidin equivalents, according to the mass of sample and volume of extract. The analyses were performed in triplicate for each sample.
2.4 Evaluation of antioxidant activity
The antioxidant activity (AOA) was determined using the free radical 2, 2'-azino-bis (3-ethylbenzthiazoline-6- sulphonic acid (ABTS). The method is based on the abilities of different substances to scavenge ABTS+ radical compared with a standard antioxidant (Trolox). The results were based on the percentage of inhibition, compared with the Trolox, in a dose–response curve being expressed as μmol Trolox equivalents (TE) per gram of sample.
For the assay, ABTS+ radical was prepared by mixing an ABTS+ stock solution (7 mM in water) with 2.45 mM potassium persulfate. This mixture was allowed to stand for 12–16 h at room temperature in the dark until a stable oxidative state. The ABTS+ solution (1 mL) was diluted in 80 mL of ethanol or buffer solution prior to utilization. In a tube, 2 mL of ABTS+ solution were placed with 0.1 mL of sample and after agitation it was left to rest in the dark for 15 minutes (Santos et al., 2014; Guiné et al., 2014). Then the absorbance was measured at 734 nm to assess the percentage of inhibition, using a calibration curve previously obtained. The analyses for antioxidant activity were performed in triplicate for each of the extracts analysed.
2.5 ANN modelling
Artificial neural networks are computational models frequently used for machine learning and data mining, inspired by the architecture of the human brain cells and neural connections.
2.5.1 Neural models
The basic neural unit used in the present work is the perceptron, trained using a backpropagation algorithm. The perceptron has one output and a number of inputs, one for each input variable. When the perceptron receives some stimuli in the inputs, it shows a corresponding value in the output. To calculate the output, the value of each input is multiplied by a corresponding weight, as well as possibly summed to a bias value, and the sum of the
weighted inputs and bias is adjusted through some mathematical function to generate the output. The output of each neuron is, therefore, proportional to the values of the weighted inputs. Neurons are trained by adjusting the weights given to the input variables, in a way that the error between the neuron’s expected output and the measured output value is minimized during a training process. The weights learnt by the neural network during training reflect the contribution of each variable for the output of each neuron. The analysis of the weights, therefore, is a method of data mining for finding patterns and correlations existing in some types of datasets, such as the present laboratorial experiments.
2.5.2 Architecture of the ANN used
The ANN used was a feed-forward model, created using Matlab™ (Matlab is a registered trademark of Mathworks. www.mathworks.com.) fitnet function. A sigmoidal transfer function, which is a universal approximator, was used in the hidden layer. A linear transfer function was used in the output layer. Training was performed using the Levenberg-Marquartd method. The mean squared error (MSE) method was used for the performance assessment. Performance of the models was also assessed calculating the correlation factor between values predicted by the neural networks and the experimental values measured in the laboratory.
For simplicity of the analysis, each output variable was studied separately. An ANN model was created for predicting each output variable. All ANNs had just two neurons: one in the hidden layer and the other in the output layer. Hence, the number of weights to analyse for each output variable was equal to the number of input variables, which are inputs to the first neuron, plus one weight which is the input to the output neuron. The architecture of the ANNs used comprised one input layer with 11 neurons, one hidden layer and one output layer with one neuron.
2.5.3 Characterization of the datasets and variables The quality of the neural model obtained depends on the architecture of the neural network and the efficiency of the learning process. In general, more samples used for training produce better models and the confidence in the results increases. In the present work, the number of experimental results available varied for different output
variables. The number of samples used for each of the models produced is as follows: 189 for total phenolic compounds (TPC) and for total anthocyanins (ANT) and 182 for antioxidant activity (AOA).
For each run, the Matlab script randomly selected approximately 70% of the samples for the train subset, 15% for the validation subset and the remainder samples were used for the test subset.
For better neural network fitting and analysis, the four input variables were expanded into a total of eleven Boolean inputs. Details of the encoding of the input variables are as follows:
• Solvent (#1-3): 1 – Methanol (MET); 2 – Ethanol: water (EW); 3 – Acetone: water (AW)
• Volume/mass ratio (#4-6): 4 – 5=25 mL/5 g (VMR5); 5–10=50 mL/5 g (VMR10); 6–20= 100 mL/5 g (VMR20)
• Order of extraction (#7-9): 7 – First extraction (E1); 8 – Second extraction (E2); 9 – Third extraction (E3)
• Time (#10-11): 10 – 15 minutes (T15); 11 – 60 minutes (T60)
The result of the learning process depends on some initial random values. Namely, the convergence of the model can be faster, slower or even totally impaired depending on the initial weights and bias of each neural connection, as well as the subset of samples selected for training, testing and validation. Therefore, the final results obtained usually differ between experiments, because the starting point and data may also differ.
The best neural network models will produce the best correlations between values predicted by the neural network and the experimental values measured in the laboratory. In the present work, the performance of the models is measured using the correlation factor (R) and mean squared error (MSE).
For better confidence in the analysis, many experiments were performed in the present study. For each output variable, one hundred different models were trained. The results were sorted by the correlation factor R, from best to worst. The six best models were then selected for further analysis.
The neurons’ input weights can be positive or negative. A positive weight means that the input variable
contributes more to the output of that neuron. In a network with two layers, if the connection between the first and the second neurons also receives a negative weight, that inverts the result which comes from the first layer. Therefore, in the present analysis the signals of the input weights were mirrored when the weight of the second neuron was negative. The weights were also normalized into the interval [–1, 1]. The results showed are the average of the six best models, after this post-processing.
3 Results and discussion
3.1 Total phenolic compounds
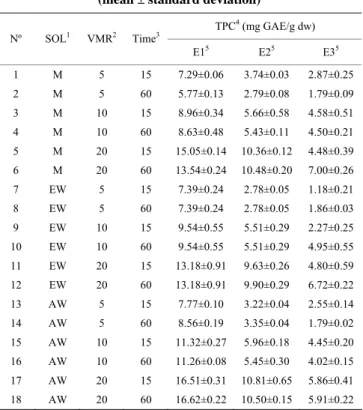
Table 2 shows the total phenolic compounds presented in the three extracts (E1, E2 and E3) of the 18 different conditions under study. The total amount of phenolic compounds (TPC) extracted in the three extracts using methanol ranged from 10.4 to 31.0 mg GAE/g dw. The highest value was obtained for the ratio ‘volume of solvent: mass of sample’ (VMR) of 20 with extraction time of 60 min. Using ethanol: water as extracting solution, the TPC extracted ranged from a minimum of 11.4 to a maximum of 29.8 mg GAE/g dw, while the extracts obtained with acetone: water contained 13.5- 33.2 mg GAE/g dw of TPC. These values are higher when compared to those reported by Chen et al. (2015) (12.5 to 17.0 mg GAE/g dw), using different extractions conditions, such as acid ethanol, and temperature from 20ºC to 60ºC for 30-90 min of ultrasonic-assisted extraction.
The first extraction allowed to obtain 44%-56%, 44%-65%, and 50%-62% of TPC quantified when using methanol, ethanol: water, and acetone: water, respectively. On average 29% and 19% of TPC quantified were obtained in the second and third extracts, respectively.
Regarding different times of extraction, for all extracting solutions used, no significant effect was possible to be observed by increasing contact time from 15 to 60 min. On the contrary, increasing the VMR led to higher values of TPC extracted. On average, a VMR = 10% led to 58% more of TPC extracted when compared with a VMR = 5. The use of a VMR of 10 allowed obtaining 94% more of TPC when compared with the use of a VMR of 5.
Table 2 Total phenolic compounds in different extracts (mean ± standard deviation)
TPC4 (mg GAE/g dw) Nº SOL1 VMR2 Time3 E15 E25 E35 1 M 5 15 7.29±0.06 3.74±0.03 2.87±0.25 2 M 5 60 5.77±0.13 2.79±0.08 1.79±0.09 3 M 10 15 8.96±0.34 5.66±0.58 4.58±0.51 4 M 10 60 8.63±0.48 5.43±0.11 4.50±0.21 5 M 20 15 15.05±0.14 10.36±0.12 4.48±0.39 6 M 20 60 13.54±0.24 10.48±0.20 7.00±0.26 7 EW 5 15 7.39±0.24 2.78±0.05 1.18±0.21 8 EW 5 60 7.39±0.24 2.78±0.05 1.86±0.03 9 EW 10 15 9.54±0.55 5.51±0.29 2.27±0.25 10 EW 10 60 9.54±0.55 5.51±0.29 4.95±0.55 11 EW 20 15 13.18±0.91 9.63±0.26 4.80±0.59 12 EW 20 60 13.18±0.91 9.90±0.29 6.72±0.22 13 AW 5 15 7.77±0.10 3.22±0.04 2.55±0.14 14 AW 5 60 8.56±0.19 3.35±0.04 1.79±0.02 15 AW 10 15 11.32±0.27 5.96±0.18 4.45±0.20 16 AW 10 60 11.26±0.08 5.45±0.30 4.02±0.15 17 AW 20 15 16.51±0.31 10.81±0.65 5.86±0.41 18 AW 20 60 16.62±0.22 10.50±0.15 5.91±0.22 Note: 1 M = methanol; EW = ethanol: water; AW = acetone: water;
2 VMR = volume/mass ratio (mL/g); 3 Time (min);
4 TPC = total phenolic compounds (expressed in mg gallic acid equivalent/g dry
weight);
5 E1 = 1st extract; E2 = 2nd extract; E3 = 3rd extract.
3.2 Antioxidant activity
The antioxidant activity (AOA) of three extracts (E1, E2 and E3) obtained under different conditions of solvent (methanol, ethanol: water and acetone: water), volume/mass ratio (VMR) and time of extraction (15 and 60 min) are shown in Table 3. The total amount of antioxidant activity quantified as the sum of the three extracts using methanol ranged from 136.0 to 176.3 µmol TE/g dw, and from 132.7-170.5 µmol TE/g dw when acetone-water was used. On average using ethanol: water as solvent, lower values (115.7-150.2 µmol TE/g dw) were quantified. The compounds present in the first extracts were responsible for 61%-93% of the total antioxidant activity.
Increasing the volume/mass ratio allowed to reach higher values of antioxidant activity, 12%-22% in case of VMR equal to 10, and 28%-35% in case of VMR equal to 20, when compared to the values obtained for VMR equal to 5. On the contrary, two times of extraction originated different effects depending on the extraction conditions, thus not allowing establishing a definite pattern.
Table 3 Antioxidant activity in different extracts (mean ± standard deviation)
AOA4 (µmol TE/g dw)
Nº SOL1 VMR2 Time3 E15 E25 E35 1 M 5 15 91.17±8.52 38.52±3.70 6.26±1.08 2 M 5 60 109.91±0.55 26.19±0.73 15.47±1.42 3 M 10 15 122.61±10.98 36.17±4.38 7.23±1.37 4 M 10 60 119.98±5.05 25.94±1.73 12.25±1.46 5 M 20 15 159.36±13.09 16.98±0.85 0.00±0.00 6 M 20 60 127.64±6.57 24.63±2.47 13.57±3.77 7 EW 5 15 79.07±3.77 27.74±2.64 4.64±0.81 8 EW 5 60 101.87±4.67 26.19±0.73 15.47±1.42 9 EW 10 15 115.52±9.49 17.07±2.78 2.72±0.35 10 EW 10 60 70.08±8.18 29.51±2.43 16.09±3.62 11 EW 20 15 138.98±10.17 11.24±4.20 0.00±0.00 12 EW 20 60 114.83±5.30 15.30±3.77 7.83±2.44 13 AW 5 15 101.06±5.76 29.25±0.52 2.42±0.73 14 AW 5 60 114.95±2.56 31.82±4.08 5.32±1.15 15 AW 10 15 128.35±4.46 20.04±1.45 0.62±0.28 16 AW 10 60 108.15±5.41 19.71±1.11 6.00±1.18 17 AW 20 15 141.49±6.97 29.02±1.84 0.00±0.00 18 AW 20 60 113.01±4.45 36.88±1.24 9.65±0.76 Note: 1 M = methanol; EW = ethanol: water; AW = acetone: water;
2 VMR = volume/mass ratio (mL g-1); 3 Time (min);
4 AOA = antioxidant activity (expressed in µmol torlox equivalent/g dry weight); 5 E1 = 1st extract; E2 = 2nd extract; E3 = 3rd extract.
3.3 Total anthocyanins content
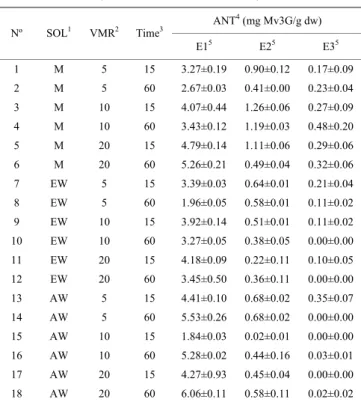
The total of anthocyanins (ANT) present in the extracts ranged from 1.9 mg Mv3G/g dw, obtained with ethanol: water during 60 min with a volume/mass ratio of 5, to 6.2 mg Mv3G/g dw, extracted with methanol during 15 min with a volume/mass ratio of 20 (Table 4). On average, 84% of anthocyanins were recovered in the first extract. Unlike in the previous cases, the results obtained did not allow to conclude a significant effect of the different conditions (solvent, volume/mass ratio or time of extraction) on the quantification of anthocyanins.
3.4 Results of ANN modeling
Table 5 shows the MSE and the correlation coefficient R obtained for each subset of the datasets used to predict each output variable. The parameters show that the models are very good, since R is always above 0.93 for all subsets and the MSE is in general very low for the type of data. The output values were not normalized, so the MSE = 1.742 for AOA reflects the fact that the data for that particular variable presents values in the range [–1, 22.4], while TPC and ANT show smaller amplitudes, namely [0.13, 2.09] and [0, 0.77].
Table 4 Anthocyanins indifferent extracts (mean ± standard deviation)
ANT4 (mg Mv3G/g dw) Nº SOL1 VMR2 Time3 E15 E25 E35 1 M 5 15 3.27±0.19 0.90±0.12 0.17±0.09 2 M 5 60 2.67±0.03 0.41±0.00 0.23±0.04 3 M 10 15 4.07±0.44 1.26±0.06 0.27±0.09 4 M 10 60 3.43±0.12 1.19±0.03 0.48±0.20 5 M 20 15 4.79±0.14 1.11±0.06 0.29±0.06 6 M 20 60 5.26±0.21 0.49±0.04 0.32±0.06 7 EW 5 15 3.39±0.03 0.64±0.01 0.21±0.04 8 EW 5 60 1.96±0.05 0.58±0.01 0.11±0.02 9 EW 10 15 3.92±0.14 0.51±0.01 0.11±0.02 10 EW 10 60 3.27±0.05 0.38±0.05 0.00±0.00 11 EW 20 15 4.18±0.09 0.22±0.11 0.10±0.05 12 EW 20 60 3.45±0.50 0.36±0.11 0.00±0.00 13 AW 5 15 4.41±0.10 0.68±0.02 0.35±0.07 14 AW 5 60 5.53±0.26 0.68±0.02 0.00±0.00 15 AW 10 15 1.84±0.03 0.02±0.01 0.00±0.00 16 AW 10 60 5.28±0.02 0.44±0.16 0.03±0.01 17 AW 20 15 4.27±0.93 0.45±0.04 0.00±0.00 18 AW 20 60 6.06±0.11 0.58±0.11 0.02±0.02 Note: 1 M = methanol; EW = ethanol: water; AW = acetone: water;
2 VMR = volume/mass ratio (mL g-1); 3 Time (min);
4 ANT = anthocyanins (expressed in mg malvidin-3-glucoside/g dry weight); 5 E1 = 1st extract; E2 = 2nd extract; E3 = 3rd extract.
Table 5 Quality parameters of the models used
Output R - Train set R - Test set R - Validation set R - All dataset MSE
TPC 0.975 0.971 0.972 0.974 0.010 AOA 0.977 0.974 0.976 0.976 1.742
ANT 0.948 0.933 0.949 0.945 0.005
Figure 1 illustrates the average neural weights of the input variables. One immediate conclusion is that the third extraction has a negative impact on all the
dependent variables, which is according to the observation that the first and second extractions remove most of the phenolic compounds, anthocyanins and antioxidants.
The chart also illustrates the fact that higher volume/mass ratios are more important predictors, which is notorious for TPC. In fact, TPC is very dependent on VMR20 and E1. Also, the chart shows that time influences TPC and AW is a more influential extract.
As for AOA, the weights learnt for all extracts, as well as volume/mass ratio, are very similar and they are all important – all the weights vary between 0.32 and 0.46. The order of the extract is, however, more important, since E1 and E2 receive very large weights and E3 receives a very large negative weight. That means E1 and E2 give an important positive contribution and E3 gives an important negative contribution to the value predicted. On the other hand, T15 and T60 receive negligible weights. That means the AOA is mostly indifferent to the time. If the independent variables T15 and T60 were removed the model would still show similar accuracy.
ANT exhibits a behavior which is very similar to AOA. However, ANT is mostly indifferent to E2, which shows that the first extraction is much more effective than the second, while the third will be much less effective than the previous ones. Another difference is that EW receives a weight close to zero, which means that ANT is much more affected by MET and AW (MET and AW scored weights of 0.42).
Figure 1 Average neural weights calculated for the models
In view of the observed results, it was possible to establish a relation between the extraction conditions and the quantification of phenolic compounds and antioxidant
activity in beetroot, thus confirming the research hypothesis formulated. The extraction variables showed that a higher influence on the output variables were
volume/mass ratio and order of extraction, and therefore these could be identified to optimize the extraction procedure as to maximize the bioactive properties of beetroot.
4 Conclusions
The results showed that the amount of quantified TPC in the extracts was not much affected by the type of solvent or extraction time, but was influenced by the volume/mass ratio and by the order of extraction, being higher for higher VMR and lower order of extract.
Regarding antioxidant activity, the effect of solvent was noticed, being the ethanol: water mixture less efficient in extracting compounds with antioxidant activity from beetroot. The influence of the extraction time was variable according to the conditions, and therefore no decisive trend was observed for its effect on AOA. In the neural model a longer time received a slightly lower weight. Regarding the effect of the variables VMR and order of extract, their influence on the AOA was similar to that previously described for TPC, although AOA seems to be less sensitive to VMR than TPC.
As for anthocyanins, it was concluded that the order of extraction influenced the results, with higher values in the first extract, and decreasing successively to the third extract. The neural model showed it was less affected by EW and slightly more affected by higher VMR, while almost indifferent to time.
Acknowledgment
This work was financed by FCT - Fundação para a Ciência e Tecnologia, I.P., project UID/Multi/04016/2016. Furthermore we would like to thank the Instituto Politécnico de Viseu and CI&DETS for their support, through project CI&DETS/2015/0004.
References
Azeredo, H. M. C. 2009. Betalains: properties, sources, applications, and stability – a review. International Journal of Food Science & Technology, 44(12): 2365–2376.
Boulton, R. 2001. The copigmentation of anthocyanins and its role in the color of red wine: a critical review. American Journal of Enology and Viticulture, 52(2): 67–87.
Chen, M., Y. Zhao, and S. Yu. 2015. Optimisation of ultrasonic-assisted extraction of phenolic compounds, antioxidants, and anthocyanins from sugar beet molasses. Food Chemistry, 172: 543–550.
Cheynier, V., J. Rigaud, J. M. Souquet, J. M. Barillère, and M. Moutounet. 1989. Effect of pomace contact and hyperoxidation on the phenolic composition and quality of grenache and chardonnay wines. American Journal of Enology and Viticulture, 40(1): 36–42.
Dahmoune, F., H. Remini, S. Dairi, O. Aoun, K. Moussi, N. Bouaoudia-Madi, N. Adjeroud, N. Kadri, K. Lefsih, L. Boughani, L. Mouni, B. Nayak, and K. Madani. 2015. Ultrasound assisted extraction of phenolic compounds from P. lentiscus L. leaves: comparative study of artificial neural network (ANN) versus degree of experiment for prediction ability of phenolic compounds recovery. Industrial Crops and Products, 77: 251–261.
Gonçalves, F. J., S. M. Rocha, and M. A. Coimbra. 2012. Study of the retention capacity of anthocyanins by wine polymeric material. Food Chemistry, 134(2): 957–963.
Guiné, R. P. F., M. J. Barroca, F. J. Gonçalves, M. Alves, S. Oliveira, and M. Mendes. 2015. Artificial neural network modelling of the antioxidant activity and phenolic compounds of bananas submitted to different drying treatments. Food Chemistry, 168: 454–459.
Guiné, R. P. F., S. M. A. Soutinho, and F. J. Gonçalves. 2014. Phenolic compounds and antioxidant activity in red fruits produced in organic farming. Croatian Journal of Food Science and Technology, 6(1): 15–26.
Rafiee, Z., M. Barzegar, M. A. Sahari, and B. Maherani. 2017. Nanoliposomal carriers for improvement the bioavailability of high – valued phenolic compounds of pistachio green hull extract. Food Chemistry, 220: 115–122.
Ravichandran, K., N. M. M. T. Saw, A. A. A. Mohdaly, A. M. M. Gabr, A. Kastell, H. Riedel, Z. Cai, D. Knorr, and I. Smetanska. 2013. Impact of processing of red beet on betalain content and antioxidant activity. Food Research International, 50(2): 670–675.
Reddy, M. K., R. L. Alexander-Lindo, and M. G. Nair. 2005. Relative inhibition of lipid peroxidation, cyclooxygenase enzymes, and human tumor cell proliferation by natural food colors. Journal of Agricultural and Food Chemistry, 53(23): 9268–9273.
Santos, S. C. R. V. L., R. P. F. Guiné, and A. Barros. 2014. Effect of drying temperatures on the phenolic composition and antioxidant activity of pears of Rocha variety (Pyrus communis L.). Journal of Food Measurement and Characterization, 8(2): 105–112.
Sawicki, T., N. Bączek, and W. Wiczkowski. 2016. Betalain profile, content and antioxidant capacity of red beetroot dependent on the genotype and root part. Journal of Functional Foods, 27:
249–261.
Strack, D., T. Vogt, and W. Schliemann. 2003. Recent advances in betalain research. Phytochemistry, 62(3): 247–269.
Tian, Y., J. Liimatainen, A. L. Alanne, A. Lindstedt, P. Liu, J. Sinkkonen, H. Kallio, and B. Yang. 2017. Phenolic compounds extracted by acidic aqueous ethanol from berries and leaves of different berry plants. Food Chemistry, 220: 266–281.
Wang, Y., J. Li, and B. Li. 2017. Chitin microspheres: A
fascinating material with high loading capacity of anthocyanins for colon specific delivery. Food Hydrocolloids, 63: 293–300.
Wruss, J., G. Waldenberger, S. Huemer, P. Uygun, P. Lanzerstorfer, U. Müller, O. Höglinger, and J. Weghuber. 2015. Compositional characteristics of commercial beetroot products and beetroot juice prepared from seven beetroot varieties grown in Upper Austria. Journal of Food Composition and Analysis, 42: 46–55.