2003
Humberto Salazar
Amorim Varum
Avaliação, reparação e reforço sísmico de edifícios
existentes
Seismic assessment, strengthening and repair of
existing buildings
2003
Humberto Salazar
Amorim Varum
Avaliação, reparação e reforço sísmico de edifícios
existentes
Seismic assessment, strengthening and repair of
existing buildings
dissertação apresentada à Universidade de Aveiro para cumprimento dos requisitos necessários à obtenção do grau de Doutor em Engenharia Civil, realizada sob a orientação científica do Prof. Doutor Aníbal Costa, Professor Associado com Agregação da Faculdade de Engenharia da Universidade do Porto e do Prof. Doutor Paulo Vila Real, Professor Associado com Agregação da Universidade de Aveiro
o júri
presidente Profª. Doutora Maria Helena Vaz de Carvalho Nazaré
Reitora da Universidade de Aveiro
vogais Prof. Doutor Aníbal Guimarães da Costa
professor associado com agregação da Faculdade de Engenharia da Universidade do Porto
Prof. Doutor Paulo Jorge de Melo Matias Faria de Vila Real
professor associado com agregação da Universidade de Aveiro
Doutor Artur Vieira Pinto
chefe do sector de Construção e Engenharia Sísmica do Laboratório ELSA do Centro Comum de Investigação da Comissão Europeia, Ispra, Itália
Prof. Doutor Raimundo Moreno Delgado
professor catedrático da Faculdade de Engenharia da Universidade do Porto
Prof. Doutor João José Rio Tinto de Azevedo
professor catedrático do Instituto Superior Técnico da Universidade Técnica de Lisboa
Prof. Doutor José Claudino de Pinho Cardoso
professor associado da Universidade de Aveiro
Prof. Doutor Paulo Barreto Cachim
acknowledgements The present work has been developed at the Civil Engineering Department of Aveiro University and at the ELSA laboratory of the Joint Research Centre at Ispra, in Italy. I gratefully acknowledge the generous help of the following organisations and many individuals, for their generous support, which made this work possible:
To Professor Aníbal Costa and Professor Paulo Vila Real for their invaluable supervision. To Professor Aníbal Costa I would like to express my gratitude for the encouragement over these years. Without his constructive advice on the contents, I would have never got to finish the thesis.
To Dr. Artur Pinto for directing me towards such an interesting project, and for making my work at JRC so stimulating. He was largely responsible for the conception and success of this project. His contribution, comments and patient supervision are gratefully acknowledged.
The financial support provi ded by the Portuguese Science and Technology Foundation (PRAXIS XXI BD/15875/98 grant) is gratefully acknowledged. Thanks go to Dr. Javier Molina, Dr. Rui Pinho, Professor Michael Griffith, Dr. Pierre Pegon, Dr. José Jara, Dr. António Arêde, Dr. João Guedes, Dr. Rui Faria and Professor Raimundo Delgado for their friendship, supportive interest and constructive comments to my work. The contributions from European
institutions and researchers involved in the ICONS TMR-Network research programme are also acknowledged. Special thanks are due to Dr. Eduardo Carvalho and Dr. Ema Coelho from LNEC.
The successful preparation and execution of the complex testing campaign is a result of the exceptional joint effort of the ELSA laboratory staff and
researchers. Their technical assistance, professionalism and welcoming environment are gratefully acknowledged. Particular thanks to Professor Michael Geradin, Mr. Guido Verzeletti, Ms. Jeanne-Paule Ambrosetti and Ms. Paola Schaack.
I would like to address special thanks to all my undergraduate and master professors from the Engineering Faculty of University of Porto. Their example was always a precious positive reference to me. My work reflects what I have learned from them, from an academic, professional and human point of view. To my colleagues from the Civil Engineering Department at University of Aveiro, I express my thanks for their friendship, comments and suggestions. Particular thanks to Professor Claudino Cardoso, Professor Luís Magalhães, Mr. Celestino Quaresma, Nuno Lopes and Ms. Ana Maria.
Thanks are due to Mr. Manuel Carvalho for his assistance in the final arrangement of the figures.
To the great friends I have made while at the JRC, I am also very grateful for their genuine friendship. I am also eternally indebted to my sincere friends in Portugal, particularly to Paulo Fidalgo and Daniel Oliveira for their endless friendship, tolerance and encouragement.
Lastly, I would also like express my sincere appreciation to my dear parents, brothers and my sweet fiancée Celeste Amorim, for their unfailing patience, support, encouragement, affection and love, that made this experience to happen. I wish to dedicate this thesis to them all, with appreciation for patiently enduring and sharing these years of preparation with me.
resumo Sismos recentemente ocorridos em todo o mundo têm demonstrado de forma dramática que a investigação na engenharia sísmica deve ser direccionada para a avaliação da vulnerabilidade das construções existentes, desprovidas de adequadas características resistentes. O seu reforço deve ser realizado, reduzindo a sua vulnerabilidade e consequentemente risco para níveis aceitáveis. O estudo e desenvolvimento de novas técnicas de reforço tem um papel principal no sentido de evitar a perda de vidas humanas e económicas. Os principais objectivos desta tese são: a avaliação experimental de edifícios existentes de betão armado, o desenvolvimento de modelos numéricos refinados capazes de reproduzir rigorosamente a sua resposta estrutural, o desenvolvimento de metodologias simplificadas para a análise não-linear dinâmica de estruturas irregulares, e o desenvolvi mento de ferramentas numéricas para a optimização de reforço para este tipo de estruturas. São apresentadas as mais comuns causas de dano ou colapso de estruturas existentes, bem como as técnicas de reparação e reforço adequadas. Em muitas cidades do sul da Europa, os edifícios existentes, dimensionados e construídos até finais dos anos 70, sem considerar a acção sísmica, constituem um elevado risco para as populações.
Dois pórticos de 4 pisos à escala real, representativos da prática de projecto e construção até finais dos anos 70 na maioria dos países do sul da Europa, foram dimensionados, construídos e testados para crescentes intensidades de acção. Os principais objectivos desta série de ensaios foram a avaliação da capacidade original destes edifícios, com e sem alvenaria, e ainda a validação experimental da eficiência de várias técnicas de reparação e reforço.
Os ensaios realizados demonstraram que a vulnerabilidade destas construções, dimensionadas sem características sismo-resistentes, que constituem uma parte importante dos edifícios existentes na Europa, são uma fonte de alto risco para as populações. Foi ainda comprovado que soluções de reforço adequadamente seleccionadas, podem reduzir consideravelmente este risco para níveis aceitáveis de acordo com a actual filosofia dos códigos de dimensionamento e avaliação da segurança estrutural.
Foram utilizados modelos numéricos refinados para o pórtico e para a alvenaria. Os modelos foram calibrados com os resultados dos ensaios à escala real. Especial atenção foi dedicada ao escorregamento das armaduras de aderência normal, dada a sua influência na resposta de estruturas
existentes. Os modelos calibrados demonstraram ser adequados na determinação da resposta não-linear de estruturas existentes.
Adicionalmente é proposta uma metodologia simplificada para a análise dinâmica não-linear de edifícios baseada no cálculo espectral multi-modal da resposta sísmica. Esta metodologia apresenta a possibilidade de análise de estruturas irregulares e constitui-se como uma ferramenta essencial para a optimização do reforço de edifícios existentes que se desenvolveu no âmbito da presente tese.
abstract Recent major earthquakes around the world have evidenced that research in earthquake engineering must be directed to the assessment of vulnerability of existing constructions lacking appropriate seismic resisting characteristics. Their retrofit or replacement should be made in order to reduce vulnerability, and consequent risk, to currently accepted levels. The development of retrofitting techniques represents a key issue in order to avoid both human casualties and economic losses.
The aims of this thesis are to experimentally study the behaviour of existing reinforced concrete buildings, to calibrate a refined numerical model in order to reproduce rigorously their structural behaviour, to develop a simplified
methodology for non-linear dynamic analysis of irregular buildings, and to propose a methodology for optimum strengthening.
As a background, a theoretical summary on the most common causes of damage and failure and on repair and strengthening techniques for existing reinforced concrete buildings is presented. Older buildings, designed and constructed until the late 1970's, without considering earthquake provisions, constitute a significant hazard in many cities of southern Europe.
Two full-scale four-storey frame models, representative of the common practice of construction until the late 1970's in most southern European countries, were designed, constructed and tested pseudo-dynamically. This experimental study aimed at assessing the original capacity of existing structures, with and without infill masonry, and to compare performances of different retrofitting solutions. The tests have shown that the vulnerability of existing reinforced concrete frames designed without specific seismic resisting characteristics, which are an important part of the existing buildings in Europe, constitute a source of high risk for human life. Furthermore, it was demonstrated that advanced retrofitting methods, solutions and techniques substantially reduce that risk to levels currently considered in modern design.
Refined finite element models for the frame and infill masonry were calibrated with the results of the full-scale tests. Special attention was devoted to bond-slip phenomenon, which is likely to influence the behaviour of existing reinforced concrete structures with round smooth reinforcing. The improved models were found capable to analyse existing reinforced concrete structures, reproducing accurately their non-linear response.
Additionally, it is proposed a simplified methodology for non-linear dynamic analysis of buildings based on the multi-modal spectral seismic response. This methodology is a valuable tool to analyse irregular structures and constitutes an important tool for the optimum strengthening design of existing buildings, which was also developed in this thesis.
? Assessment, strengthening and repair of structures
? Existing reinforced concrete buildings
? Structural deficiencies
? Seismic retrofitting
? Pseudo-dynamic earthquake testing
? Global refined non- linear numerical modelling and analysis
? Masonry infilled frames
? Bond-slip
? Performance-based earthquake engineering
? Simplified assessment methods
Here are catalogued the abbreviations used in this thesis, which can be pronounced as whole words, abbreviations that do not form a word, as well as, codes which constituents do not derive from words. Generally speaking the database entries are retrieved from English language sources but the acronym itself does not necessarily need to be of English origin. Their meaning are listed in the following:
2D two-dimensional
3D three-dimensional
AASHTO American Association of State Highway and Transportation Officials ACI American Concrete Institute
AIJ Architectural Institute of Japan
AISC American Institute of Steel Construction ADRS Acceleration-Displacement Response Spectra ASCE American Society of Civil Engineers
ASR Assessment, Strengthening and Repair ASTM American Society for Testing Materials ATC Applied Technology Council
BF Bare Frame
BS Base-Shear
BS British Standards
CALTRANS California Department of Transportation (USA) CBC alifornia Building Code
CEA Commissariat à l'Energie Atomique (France) - (French Atomic Energy Commission) CEB Comité Euro-International du Béton (Euro-International Concrete Committee) CEN European Committee for Standardization
CFRP Carbon Fibre Reinforced Polymers
CNS Council of the National Seismic System (USA) CONLIN CONvex LINearization method
CPU Central Processing Unit CSM Capacity Spectrum Method
CUREE California Universities for Research in Earthquake Engineering (USA) DBD Displacement Based Design
DC Ductility Class
DE Design Earthquake
DI Damage Index
DOF Degree-Of-Freedom
EASY Earthquake engineering slide information system
EC European Commission
EC2 Eurocode 2
EC6 Eurocode 6
EC8 Eurocode 8
ECEE European Conference on Earthquake Engineering
ECOEST European Consortium of Earthquake Shaking Tables (Access to LSF research project) EDD Energy Dissipation Device
EDS Energy Dissipation System EE Earthquake Engineering
EERC Earthquake Engineering Research Center (USA) EERI Earthquake Engineering Research Institute (USA) ELSA European Laboratory for Structural Assessment EN Norme Européenne (European Standard) ENV Prénorme Européenne (European Prestandard)
EQ Earthquake
EQGM Earthquake Ground Motion ERA European Research Area
ESC European Seismological Commission ESD European Strong-motion Database
FE Finite Element
FEM Finite Element Method
FEMA Federal Emergency Management Agency
FEUP Faculty of Engineering - University of Porto (Portugal) FFT Fast Fourier Transform
FIB Fédération Internationale du Béton (International Federation for Structural Concrete) FIP Fédération Internationale de la Précontrainte (International Federation for Prestressing)
FP Framework Program
FRP Fibre Reinforced Polymers
GECoRPA Portuguese Society for Conservation and Rehabilitation of the Architectural Heritage GIS Geographic Information Systems
HCM Human Capital and Mobility programme of the European Commission IABSE International Association for Bridge and Structural Engineering IBC International Building Code
ICONS Innovative seismic design CONcepts for new and existing Structures (EC funded programme of research network)
ICT Information and Communication Technology ID Inter-storey Drift
IN Infilled frame
IPSC Institute for the Protection and the Security of the Citizen (JRC) IRIS Incorporated Research Institutions for Seismology
ISIS Institute for Systems, Informatics and Safety (JRC)
ISPMNH International Society for the Prevention and Mitigation of Natural Hazards IT Information Technology
JBC Japanese Building Code
JBDPA Japan Building Disaster Prevention Association JMA Japanese Meteorological Agency
JRC Joint Research Centre
JSCE Japan Society of Civil Engineers
KB K-Bracing
KOERI Kandilli Observatory & Earthquake Research Institute (Turkey) LNEC Laboratório Nacional de Engenharia Civil (Portugal)
LSF Large-Scale Facilities
MAE Mid-America Earthquake Center
max maximum
MCE Maximum Capable Earthquake
MCEER Multidisciplinary Center for Earthquake Engineering Research (USA) MDOF Multiple-Degree-of-Freedom system
ME Maximum Earthquake
min minimum
MMA Method of Moving Asymptotes NAHB National Association of Home Builders
NEHRP National Earthquake Hazard Reduction Program (USA) NEIC National Earthquake Information Center
NISEE National Information Service for Earthquake Engineering - University of California, Berkeley (USA)
NIST National Institute of Standards and Technology (USA) NSF National Science Foundation (USA)
NZ New Zealand
NZCS New Zealand Concrete Society
NZS New Zealand Standard Code of Practice for General Structural Design and Design Loading for Buildings
NZNSEE New Zealand National Society for Earthquake Engineering OECD Organisation for Economic Co -operation and Development OSHA Occupational Safety and Health Administration (USA) PA Park and Ang Damage Index
PBD Performance Based Design PBE Performance Based Engineering
PBSD Performance Based Seismic Design PBSE Performance Based Seismic Engineering
PC Personal Computer
PEER Pacific Earthquake Engineering Research Center (USA) PGA Peak Ground Acceleration
PGV Peak Ground Velocity
PO Performance Objective (or Performance design Objective) PP Performance Point
PREC8 Prenormative Research in support of Eurocode 8 project (preceded the ICONS project) PSA Pseudo Acceleration Spectrum
PsD Pseudo-Dynamic
PSV Pseudo Velocity Spectrum RC Reinforced Concrete R&D Research and Development
REBAP Regulamento de Estruturas de Betão Armado e Pré-esforçado (Portuguese code for RC structures)
RILEM International Un ion of Laboratories and Experts in Construction Materials, Systems and Structures
RSA Regulamento de Segurança e Acções para estruturas de edifícios e pontes (Portuguese code for actions on structures)
SAFERR Safety Assessment For Earthquake Risk Reduction (European Research Training Network) SC Infill strengthened frame ('Shotcrete')
SCP Sequential Convex Programming SDOF Single -Degree-Of-Freedom system SE Serviceability Earthquake
SEAOC Structural Engineers Association Of California
SI Système International d'unités (International System of Units) SLP Sequential Linear Programming
SPES Sociedade Portuguesa de Engenharia Sísmica (Portuguese Society for Earthquake Engineering)
SR Selective Retrofitted frame SRC Steel Reinforced Concrete
TD Top-Displacement
TMR Training and Mobility of Researchers UBC Uniform Building Code
UK United Kingdom
URM Un-Reinforced Masonry USA United States of America USGS United States Geological Survey
WCEE World Conference on Earthquake Engineering yrp Years Return Period
CHAPTER 1 – INTRODUCTION, MAIN OBJECTIVES AND PLAN OF THE THESIS
1.1 – INTRODUCTION ...1
1.2 – MAIN OBJECTIVES OF THE THESIS...10
1.3 – PLAN OF THE THESIS...11
CHAPTER 2 – SEISMIC VULNERABILITY AND REHABILITATION OF EXISTING RC STRUCTURES 2.1 – INTRODUCTION ...15
2.2 – STRUCTURAL ASSESSMENT AND RETROFITTING...16
2.2.1 – Structural assessment...16
2.2.2 – Structural retrofitting ...18
2.2.3 – Seismic assessment and redesign criteria and codes: Overview...19
2.3 – METHODOLOGIES FOR ASSESSMENT AND REDESIGN ...22
2.3.1 – Performance-based design and assessment...23
2.3.2 – Displacement coefficient method...25
2.3.3 – N2 method...25
2.3.4 – Capacity spectrum method ...26
2.3.4.1 – Capacity curve...27
2.3.4.2 – Demand spectrum...27
2.3.4.4 – Performance objective ... 28
2.3.4.5 – Procedure to calculate the performance point ... 29
2.3.4.6 – Conversion of the capacity curve to the capacity spectrum... 30
2.3.5 – Equivalent damping ratio ... 31
2.4 – FIELD EVIDENCE: OBSERVED DAMAGE IN RC BUILDINGS AND CASUALTIES DURING RECENT EARTHQUAKES... 34
2.4.1 – The 24th March 2001 Geiyo earthquake, southwest Japan... 35
2.4.2 – The 20th February 2001 Nisqually earthquake, Seattle -Olympia, US... 36
2.4.3 – The 7th September 1999 Athens earthquake, Greece... 37
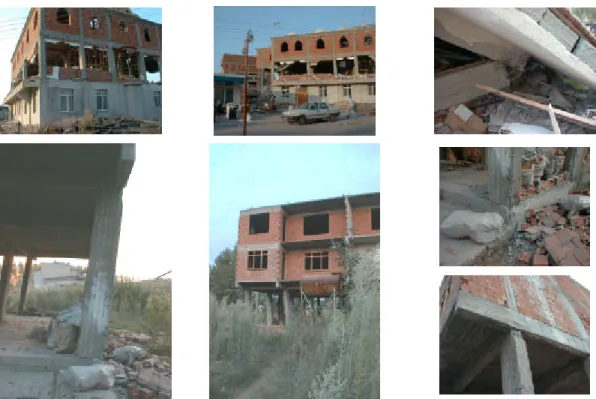
2.4.4 – The 17th August 1999 Izmit earthquake, Kocaeli, Turkey... 39
2.4.5 – The 25th January 1999 Armenia earthquake, Colombia ... 43
2.4.6 – The 26th January 1995 Great Hanshin-Awaji earthquake, Kobe, Japan... 45
2.4.7 – The 17th January 1994 Northridge earthquake, Los Angeles, US ... 49
2.4.8 – Conclusion and discussion... 50
2.5 – TYPICAL CAUSES OF DAMAGE AND FAILURE OF EXISTING NON– DUCTILE RC BUILDINGS... 50
2.5.1 – Stirrups/hoops, confinement and ductility... 52
2.5.2 – Bond, anchorage, lap-splices and bond splitting ... 53
2.5.3 – Inadequate shear capacity and failure ... 56
2.5.4 – Inadequate flexural capacity and failure... 59
2.5.5 – Inadequate shear strength of the joints ... 60
2.5.6 – Influence of the infill masonry on the seismic behaviour of frames... 61
2.5.7 – Vertical and horizontal irregularities ... 63
2.5.8 – Higher modes effect... 66
2.5.9 – Strong-beam weak-column mechanism ... 66
2.5.10 – Structural deficiencies due to architectural requirements... 67
2.6 – COMMON RETROFITTING STRATEGIES AND TECHNIQUES OF EXISTING RC BUILDINGS ... 68
2.6.1 – Global structural system intervention techniques... 69
2.6.1.1 – Addition of RC structural shear walls ... 71
2.6.1.2 – Addition of steel bracing or post-tensioned cable systems ... 73
2.6.1.3 – Base seismic isolation... 74
2.6.1.5 – Mass reduction ...77
2.6.1.6 – Other techniques...77
2.6.2 – Member intervention techniques for RC elements...78
2.6.2.1 – Epoxy resin injection ...78
2.6.2.2 – Jacketing of existing members...79
2.6.2.3 – Shotcrete ...82
2.6.2.4 – Other techniques...83
CHAPTER 3 – EXPERIMENTAL WORK - TESTS DESCRIPTION 3.1 – INTRODUCTION ...85
3.2 – CHARACTERISATION OF THE RC FRAMES...89
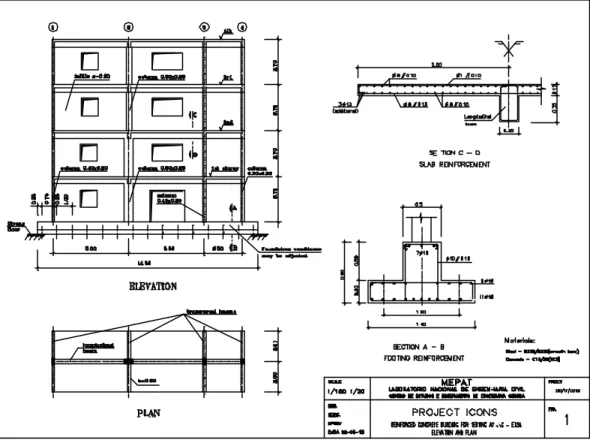
3.2.1 – Reinforced concrete frame structure: geometry and section detailing ...89
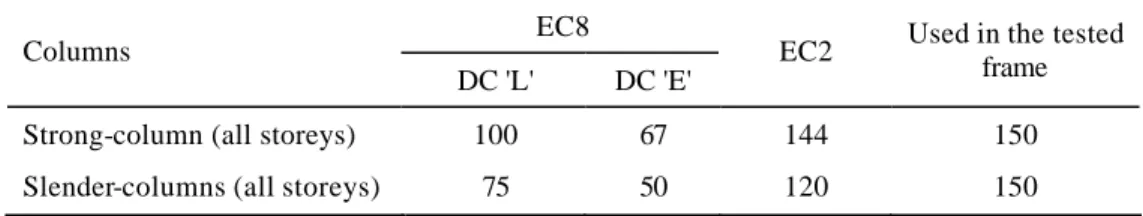
3.2.2 – Modern codes requirements for earthquake resisting structures...92
3.2.3 – Construction of the frames and loading devices ...95
3.2.4 – Transportation of the frame models ...97
3.2.5 – Materials properties...98
3.2.6 – Vertical loads ... 101
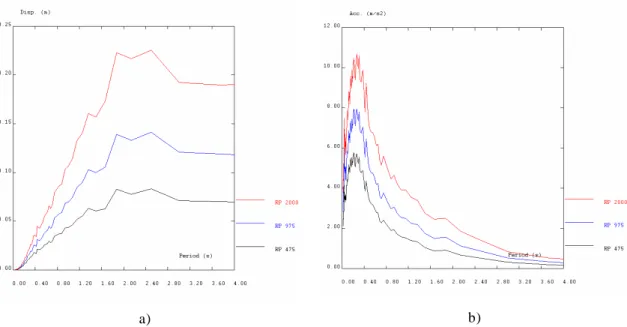
3.2.7 – Earthquake input ... 102
3.3 – SELECTIVE STRENGTHENING SOLUTION FOR THE BARE FRAME ... 104
3.4 – MASONRY INFILL WALLS AND MASONRY STRENGTHENING; CONSTRUCTION DETAILS AND MATERIALS... 107
3.4.1 – Masonry infill walls ... 108
3.4.2 – Strengthening of the infill panels ... 110
3.4.3 – Material properties ... 113
3.4.3.1 – Mortar used in joints and plaster... 113
3.4.3.2 – Compression tests on infill block units ... 114
3.4.3.3 – Compression tests on masonry wallets in the directions parallel and perpendicular to the bed joints... 114
3.4.3.4 – Concrete used for the shotcrete of the infill walls ... 115
3.4.3.6 – Mechanical properties of the masonry walls obtained from diagonal
compression tests...121
3.4.3.7 – Comparison of the results obtained for the masonry materials and masonry wallets ...124
3.4.4 – Empirical estimation of the masonry strength...126
3.4.4.1 – Infilled frames without apertures...126
3.4.4.2 – Reduction of strength and stiffness of the panels due to the presence of apertures...129
3.4.4.3 – Drift limits for masonry infill walls ...131
3.4.4.4 – Storey strength of the infilled frame ...132
3.5 – K-BRACING WITH SHEAR-LINK...134
3.6 – REPAIR AND STRENGTHENING OF THE FRAMES...136
3.6.1 – Damage-state after the pseudo-dynamic tests...136
3.6.2 – Repair and retrofitting using composite carbon fibre materials ...137
3.6.3 – Material properties...138
3.6.4 – Application to repair and strengthening of the frames...139
3.6.4.1 – Overview...139
3.6.4.2 – Concrete repair and crack injection...139
3.6.4.3 – Carbon fibre application ...140
3.6.5 – Remarks...141
3.7 – TESTING PROGRAMME AND TEST SET–UP ...142
3.7.1 – Additional masses...143
3.7.2 – Reaction-wall ...145
3.7.3 – Pseudo-dynamic test method ...146
3.7.4 – Horizontal loading system ...147
3.7.5 – Instrumentation of the RC frames...149
3.7.5.1 – Rotations: inclinometers ...150
3.7.5.2 – Beam deformation at first floor level...152
3.7.5.3 – Slab-participation ...153
3.7.5.4 – Strong-column ...154
3.7.6 – Instrumentation of the infilled frame ...154
3.7.7 – Instrumentation for the K-bracing test ...156
3.7.8.1 – Relative displacement transducers at the repaired joints... 158
3.7.8.2 – Relative displacement transducers at the strong-column ... 158
3.7.8.3 – Storey displacement transducers (PSITRONIX)... 159
3.7.9 – Data acquisition system and post-processing ... 159
3.8 – NON–DESTRUCTIVE TESTS: FREQUENCIES IDENTIFICATION ... 160
3.8.1 – Non-infilled frame... 161
3.8.2 – Infilled frame ... 165
3.9 – REMARKS... 165
CHAPTER 4 – EXPERIMENTAL WORK - ANALYSIS OF TEST RESULTS 4.1 – INTRODUCTION ... 167
4.2 – RESULTS FROM THE TESTS ON THE BARE FRAME... 170
4.2.1 – Storey displacement, drift and shear ... 170
4.2.2 – Observed damages... 173
4.2.3 – Maximum absolute and relative rotations measured at the critical zones... 175
4.2.4 – Strong-column: 3rd storey... 176
4.2.5 – Local ductility and damage indices... 178
4.2.6 – Energy dissipation... 180
4.2.7 – Damage index... 182
4.2.7.1 – Park and Ang damage index... 182
4.2.7.2 – Calculation of the PA damage index for the bare frame tests... 185
4.2.8 – Deformation at the beam extremities... 188
4.2.9 – Remarks ... 189
4.3 – RESULTS FROM THE TESTS ON THE SELECTIVE STRENGTHENED FRAME... 189
4.3.1 – Storey displacement, drift and shear ... 190
4.3.2 – Observed damages... 195
4.3.3 – Maximum absolute and relative rotations measured at the critical zones... 196
4.3.4 – Energy dissipation... 197
4.3.5 – Deformation at the beam extremities... 199
4.4 – COMPARISON BETWEEN BF AND SR TESTS ... 200
4.4.2 – Maximum absolute and relative rotations measured at the critical zones ...204
4.4.3 – Energy dissipation ...206
4.4.4 – Deformation at the beam extremities ...207
4.4.5 – Vulnerability analyses...209
4.4.5.1 – Maximum inter-storey drift and global drift ...209
4.4.5.2 – Maximum rotation...210
4.4.5.3 – Energy dissipation...211
4.5 – RESULTS FROM THE TESTS ON THE INFILLED FRAME ...212
4.5.1 – Storey displacement, drift and shear...213
4.5.2 – Observed damages ...218
4.5.3 – Damage intensity classification for infill masonry panels ...221
4.5.4 – Maximum absolute and relative rotations measured at the critical zones ...222
4.5.5 – Energy dissipation ...224
4.6 – COMPARISON BETWEEN BF AND IN TESTS ...226
4.7 – RESULTS FROM THE TESTS ON INFILL STRENGTHENED FRAME ...228
4.7.1 – Storey displacement, drift and shear...229
4.7.2 – Observed damages ...232
4.7.3 – Maximum absolute and relative rotations measured at the critical zones ...234
4.7.4 – Energy dissipation ...235
4.8 – COMPARISON BETWEEN IN AND SC TESTS ...238
4.9 – K-BRACING WITH SHEAR-LINK TEST...240
4.9.1 – Test program...240
4.9.2 – Test results ...240
4.10 – FINAL CAPACITY CYCLIC TESTS...245
4.10.1 – Description of cyclic loading history...246
4.10.2 – Selective strengthened frame cyclic test results ...248
4.10.2.1 – Maximum absolute and relative rotations measured at the instrumented points ...251
4.10.2.2 – Analyses of the repaired top-columns ...252
4.10.3 – Bare frame cyclic test results ...253
4.11 – LOCAL MEASUREMENTS... 257
4.11.1 – Plastic hinge length... 257
4.11.2 – Shear cracks at the base of the 1st storey's strong-column... 258
4.11.3 – Slab-participation ... 260
4.11.4 – Diagonal deformation of the short external panel... 264
4.12 – FINAL REMARKS AND CONCLUSIONS... 272
4.12.1 – Bare and selective strengthened frames... 273
4.12.2 – Infilled and infill strengthened frames... 275
4.12.3 – K-bracing... 278
4.12.4 – Final capacity cyclic tests... 279
4.12.5 – Remarks ... 279
CHAPTER 5 – NUMERICAL SIMULATION OF THE PSEUDO-DYNAMIC TESTS ON THE FOUR-STOREY RC FRAMES 5.1 – INTRODUCTION AND MAIN OBJECTIVES ... 281
5.2 – NUMERICAL TOOLS: CASTEM... 284
5.3 – STRUCTURAL MODELLING ASPECTS... 287
5.3.1 – Description of the building frame model... 289
5.3.2 – Improved element model... 291
5.3.3 – Plastic hinge length ... 293
5.3.4 – Non-linear behaviour of RC elements ... 295
5.3.4.1 – Concrete model... 299
5.3.4.2 – Steel model... 301
5.3.5 – Bond–slip modelling of the longitudinal reinforcing steel plain bars ... 302
5.3.6 – Slab–participation ... 309
5.3.7 – Infill masonry modelling... 313
5.3.8 – Retrofitting solutions modelling ... 318
5.3.8.1 – X- and K-bracing with dissipator retrofitting ... 318
5.3.8.2 – Selective strengthening ... 322
5.3.9 – Vertical static loads, earthquake actions, masses and damping ... 324
5.4 – NATURAL FREQUENCIES AND VIBRATION MODES...328
5.5 – NUMERICAL PREDICTIONS OF THE PSEUDO-DYNAMIC TESTS...329
5.6 – RESULTS OF THE NUMERICAL NON-LINEAR DYNAMIC ANALYSES ...331
5.6.1 – Bare frame numerical results ...332
5.6.2 – Strengthened frame numeric al results ...338
5.6.3 – Infilled frame numerical results...343
5.6.4 – Discussion of the numerical results with refined FE models ...349
5.7 – STRUCTURAL RESPONSE AND ASSESSMENT USING SIMPLIFIED METHODS...351
5.7.1 – Equivalent viscous damping from the experimental hysteretic curves...352
5.7.2 – Capacity spectrum method...355
5.7.2.1 – Capacity curve and capacity spectra ...355
5.7.2.2 – Verification of the earthquake tests...359
5.7.2.3 – Assessment of the bare and strengthened structures...361
5.7.2.4 – Final remarks ...365
5.7.3 – Improved MDOF non-linear dynamic model for structural assessment ...366
5.7.3.1 – Description of the implemented algorithm ...368
5.7.3.2 – Verification of the earthquake tests...371
5.7.3.3 – Assessment of the bare frame structure...373
5.7.4 – Observed seismic performance in the earthquake tests...374
5.8 – STRUCTURAL OPTIMIZATION PROBLEM IN SUPPORT OF BUILDING RETROFITTING DECISION...377
5.8.1 – Introduction...377
5.8.2 – Theoretic mathematical background ...378
5.8.3 – Structural strengthening optimization problems' formulation...381
5.8.3.1 – Problem I: storey yielding strength ...383
5.8.3.2 – Problem II: storey yielding stiffness (initial stiffness) ...384
5.8.3.3 – Problem III: yielding strength of the energy dissipator devices...385
5.8.4 – Implementation of the optimization problems ...387
5.8.5 – Illustrative examples ...389
5.8.5.1 – Existing structure ...390
5.8.5.2 – Optimum design of the existing structure...390
5.8.6 – Final remarks ... 397
CHAPTER 6 – SUMMARY AND CONTRIBUTIONS, CONCLUSIONS, IMPLICATIONS AND FUTURE RESEARCH 6.1 – SUMMARY AND CONTRIBUTIONS... 399
6.2 – CONCLUSIONS... 401
6.3 – IMPLICATIONS FOR RESEARCHERS, POLICY MAKERS AND OWNERS... 410
6.3.1 – Implications for academic community, practitioner engineers and code makers... 411
6.3.2 – Implications for policy makers and government agencies... 413
6.3.3 – Implications for building owners ... 414
6.4 – FUTURE RESEARCH LINES ... 415
APPENDIX A – PHOTOGRAPHIC DOCUMENTATION AND STRENGTHENING DETAILS... 421
APPENDIX B – TEST RESULTS AND PHYSICAL DAMAGE PATTERNS VISUAL INSPECTION AND PHOTOGRAPHIC DOCUMENTATION... 443
APPENDIX C – GLOSSARY... 463
CHAPTER 2 – SEISMIC VULNERABILITY AND REHABILITATION OF EXISTING RC STRUCTURES
Figure 2.1 – Seismic performance design objective matrix (VISION-2000, SEAOC,
1995) ...24 Figure 2.2 – Capacity spectrum method (adapted from ATC-40, 1996) ...27 Figure 2.3 – Modal participation factors and modal mass coefficients (ATC-40, 1996) ...30 Figure 2.4 – Equivalent viscous damping for reinforced concrete structures (adapted from
Priestley, 1997) ...31 Figure 2.5 – Energy dissipated ED in a cycle of harmonic vibration determined from an
experiment (Chopra, 2001) ...32 Figure 2.6 – Damping for an hysteretic cycle ...33 Figure 2.7 – Partial collapse of a three-storey residential building in Imabari (EQE, 2001) ...35 Figure 2.8 – Chevron eccentrically braced steel frame used to seismically upgrade
building (Filiatrault et al., 2001) ...36 Figure 2.9 – Yielding of the chevron eccentrically braced frame in the east–west direction
of the building (Filiatrault et al., 2001)...36 Figure 2.10 – Extent of the damage (KOERI, 1999) ...39 Figure 2.11 – General buildings damage and collapse in Gölcük, Adapazari and Yalova
(KOERI, 1999; EQE, 1999; Sucuoglu, 2000) ...40 Figure 2.12 – Damage in buildings due to inappropriate detailing (KOERI, 1999) ...42 Figure 2.13 – Damage in RC buildings under constructio n after the Izmit earthquake
(EQE, 1999) ...43 Figure 2.14 – Typical middle rise RC frame building with brick infill walls (Kagami,
Figure 2.15 – Damage in an ordinary RC moment-resistant infilled RC frame
(Kagami, 1999) ... 44 Figure 2.16 – Poor reinforcing details in RC joints (Kagami, 1999) ... 45 Figure 2.17 – RC frame structures with a mid-height collapse (KOBEnet, 1995):
a) collapsed 6th storey of an eight-storey high office building; b) intermediate storey damage of a moderately high building; c) 5th storey
collapse of hospital... 46 Figure 2.18 – RC frame structures with a mid–height collapse (EQE, 1995;
KOBEnet, 1995) ... 47 Figure 2.19 – Soft-storey building' collapses (EQE, 1995; KOBEnet, 1995) ... 47 Figure 2.20 – Badly damaged irregular RC building in Sannomiya (EQE, 1995) ... 48 Figure 2.21 – Damages on buildings of different type in central Kobe (EQE, 1995) ... 48 Figure 2.22 – Damaged RC columns without transverse reinforcement
(Saatcioglu et al., 1999) ... 52 Figure 2.23 – Damaged RC columns with inadequate transverse reinforcement
(Saatcioglu et al., 1999) ... 52 Figure 2.24 – Inadequate lap–splice and lack of stirrups (Saatcioglu et al., 1999) ... 54 Figure 2.25 – Typical deficiencies in buildings: a) beam bars terminate with tight 180º
hooks in the joint; b) yielding of the longitudinal steel adjacent to the floor
slab (Aschheim, 2001) ... 54 Figure 2.26 – Column lap-splice details (Aschheim, 2001) ... 55 Figure 2.27 – Bar pullout-columns (Aschheim, 2001) ... 55 Figure 2.28 – Column shear failure examples: a) 1979 Montenegro earthquake
(EASY, 1997); b) 1999 Izmit earthquake (note the to lack of transverse
reinforcement - Saatcioglu et al., 1999) ... 58 Figure 2.29 – Shear and bond failure at the mid-height of a RC column during the 1985
Mexico city earthquake (EASY, 1997) ... 58 Figure 2.30 – Damaged RC corner column at the 1st storey (Bertero, 1997) ... 58 Figure 2.31 – Column shear failure (Aschheim, 2001) ... 58 Figure 2.32 – Shear cracks at the RC column of an old school building (Yamazaki, 1993) ... 58 Figure 2.33 – Column shear failures (Aschheim, 2001): a) strong-axis behaviour;
b) oblique column shear failure; c) captive column shear failure ... 59 Figure 2.34 – Typical flexural failure: column hinging (Aschheim, 2001) ... 60
Figure 2.35 – Lack of proper design of beam-column connections
(Saatcioglu et al., 1999) ...61 Figure 2.36 – Inadequate strength of joints (Aschheim, 2001): a) joint damages;
b) joint failures...61 Figure 2.37 – Damages on masonry infill walls (Saatcioglu et al., 1999): a) RC frame
building with almost fully damaged masonry infills; b) diagonal tension
failure of a masonry wall ...62 Figure 2.38 – Short column effect caused by: window opening; masonry walls; and,
landing slabs of staircases (Saatcioglu et al., 1999; Aschheim, 2001) ...63 Figure 2.39 – Partial masonry infill in concrete frame (Paulay and Priestley, 1992) ...63 Figure 2.40 – Damage on infill walls (Aschheim, 2001): a) infill cracking; b) in-plane
infill failure...63 Figure 2.41 – Soft-storeys (Aschheim, 2001) ...64 Figure 2.42 – Building failure due to the higher modes effect during the 1985 Mexico
city earthquake (EASY, 1997)...66 Figure 2.43 – Strong-beam weak-column mechanism (Aschheim, 2001;
Saatcioglu et al., 1999) ...67 Figure 2.44 – Typical buildings in Turkey (Aschheim, 2001): a) view; b) typical beam
details...68
CHAPTER 3 – EXPERIMENTAL WORK - TESTS DESCRIPTION
Figure 3.1 – Plan and elevation views of concrete frame plus masonry infill building ...90 Figure 3.2 – Beam reinforcement details ...91 Figure 3.3 – Column reinforcement details...91 Figure 3.4 – Transverse reinforcement for lap-splice zones (EC2) ...94 Figure 3.5 – Attachment system at floor level...96 Figure 3.6 – Best–fit of steel constitutive law (Carvalho et al., 1999) ... 100 Figure 3.7 – Scheme of vertical static loads... 101 Figure 3.8 – Ground motion acceleration time histories for 475, 975 and 2000-yrp... 103 Figure 3.9 – Response linear-elastic spectra for 475, 975 and 2000-yrp (5% damping): a)
Figure 3.10 – Selective strengthening of the RC frame: a) strength-only intervention in strong-column; and, b) ductility-only intervention in strong-column
(Elnashai and Pinho, 1999) ...105 Figure 3.11 – Selective strengthened RC frame ...105
Figure 3.12 – Elevation view of the infilled concrete frame (frame A): infill openings (location and dimensions) ...108
Figure 3.13 – Infill block units ...108 Figure 3.14 – Detail of the infill walls construction...108 Figure 3.15 – Reconstruction of the 1st storey infill panels and infill strengthening
(shotcrete) of the short external bay at all storeys (elevation): a) south
view; b) north view...110 Figure 3.16 – Constructive details (layout and dimensions) of the infill strengthening...111 Figure 3.17 – Infill strengthening: a) light connection between masonry and steel mesh
(nine connection points); b) reinforcement detailing (lateral overlapping
of 0.50 m) ...112 Figure 3.18 – Diagonal compression tests: typology and nomenclature of the tested
specimens ...117 Figure 3.19 – Diagonal compression test: a) testing set-up; b) instrumentation and
loading shoe detail...118 Figure 3.20 – Diagonal compression tests: generic scheme...118 Figure 3.21 – Diagonal compression tests on specimens without plaster...119 Figure 3.22 – Diagonal compression tests on specimens with plaster in both sides...120 Figure 3.23 – Diagonal compression tests on specimens with plaster in both sides and
strengthened...120 Figure 3.24 – Diagonal compression tests: specimens without plaster (red), with plaster
in both sides (blue) and with plaster in both sides and strengthened (black) ...120 Figure 3.25 – Reference stress on diagonal compression tests: specimens without plaster
(red), with plaster in both sides (blue) and with plaster in both sides and
strengthened (black)...124 Figure 3.26 – Masonry model: a) simplified pattern of distribution of interactive forces
between infill and frame; b) tri-linear non-symmetric envelope and
hysteretic rules ...126 Figure 3.27 – Nomenclature: a) aperture and panel dimensions; b) identification of four
panel-types...131 Figure 3.28 – Empirical shear-drift curves for the 1st storey confined masonry panels ...133
Figure 3.29 – Simplified tensile behaviour curves for the concrete and masonry ... 133 Figure 3.30 – K-bracing with shear-link system: possible layouts... 135 Figure 3.31 – K-bracing with shear-link system test assembly ... 136 Figure 3.32 – Failure (shear-out) of the column/joint interface... 137 Figure 3.33 – Distribution of the additional loads ... 144 Figure 3.34 – Reaction wall/floor facility (dimensions in m) at the ELSA laboratory
(Pinto, 1998) ... 145 Figure 3.35 – General layout f the pseudo-dynamic test: reaction-wall,
structure, pistons and reference steel-frame... 148 Figure 3.36 – General layout of the 2nd storey cyclic test: reaction-wall,
structure, pistons and reference steel-frame... 149 Figure 3.37 – Location of the 64 inclinometers ... 151 Figure 3.38 – Inclinometers location scheme: a) strong-column; b) slender-column ... 151 Figure 3.39 – 1st floor beam instrumentation: general layout, dimensions and detail of the
zone nearest to the strong-column ... 152 Figure 3.40 – Instrumentation for the slab-participation monitoring ... 153 Figure 3.41 – Strong–column instrumentation: 1st storey, joint and base of the 2nd storey... 154 Figure 3.42 – Infill masonry instrumentation (general layout): 1st and 2nd storeys ... 155 Figure 3.43 – Infill masonry instrumentation (numbering): 1st and 2nd storeys ... 156 Figure 3.44 – K-bracing test instrumentation: bracing and shear-link instrumentation... 157 Figure 3.45 – K-bracing test instrumentation: location of the 22 inc linometers... 157 Figure 3.46 – K-bracing test instrumentation: infill relative-displacement transducers... 157 Figure 3.47 – Instrumentation at the repaired joints: a) frame A; b) frame B; c) detail ... 158 Figure 3.48 – Strong-column instrumentation for the final capacity cyclic test: frame A... 159 Figure 3.49 – Evolution of the four eigenfrequencies ... 162 Figure 3.50 – Evolution of the four eigenfrequencies (relative values: measured
CHAPTER 4 – EXPERIMENTAL WORK - ANALYSIS OF TEST RESULTS
Figure 4.1 – BF tests: storey displacement time histories ...170 Figure 4.2 – BF tests: top-displacement evolution...171 Figure 4.3 – BF tests: storey shear versus inter-storey drift ...171 Figure 4.4 – BF tests: base-shear versus top-displa cement ...172 Figure 4.5 – BF tests: envelope storey shear versus inter-storey drift ...172 Figure 4.6 – BF tests: a) maximum inter-storey drift profiles; b) maximum storey shear
profiles...172 Figure 4.7 – Damage observed on the 3rd storey strong-column after BF tests: a) at the bar
termination zone (note reinforcement detail); b) at the top of the column ...174 Figure 4.8 – BF tests: maximum absolute and relative rotation demands ...175 Figure 4.9 – Strong-column at the base of the 3rd storey: lap-splice reinforcement detail
(70 cm length) ...176 Figure 4.10 – Evolution of the rotations at the 3rd storey strong-column during the BF975
test...177 Figure 4.11 – 3rd storey strong-column: a) scheme of reinforcement; b) moments
distribution...178 Figure 4.12 – Local rotation ductility demand and damage for the bare frame tests ...179 Figure 4.13 – BF tests: storey and total energy dissipation ...181 Figure 4.14 – BF tests: relative energy dissipation profiles ...181 Figure 4.15 – Calculated damage index versus observed damage (Park et al., 1987) ...184 Figure 4.16 – BF tests: evolution of the storey damage index ...187 Figure 4.17 – BF tests: influence of the energy dissipation on the evolution of the storey
damage index ...187 Figure 4.18 – BF tests: beam 1st floor: a) maximum relative rotation; b) maximum
uniform strain...188 Figure 4.19 – SR tests: storey displacement time histories...191 Figure 4.20 – SR tests: top-displacement evolution...192 Figure 4.21 – SR tests: base-shear versus top-displacement...192 Figure 4.22 – SR tests: storey shear versus inter-storey drift...193
Figure 4.23 – SR tests: envelope storey shear versus inter-storey drift ... 193 Figure 4.24 – SR tests: a) maximum inter-storey drift profiles; b) maximum storey shear
profiles... 194 Figure 4.25 – SR tests: maximum absolute and relative rotation demands ... 196 Figure 4.26 – SR tests: storey and total energy dissipation... 198 Figure 4.27 – SR tests: relative energy dissipation profiles ... 199 Figure 4.28 – SR tests: beam 1st floor: a) maximum relative rotation; b) maximum
uniform strain ... 199 Figure 4.29 – BF and SR tests: maximum inter-storey drift profiles... 202 Figure 4.30 – BF and SR tests: maximum inter-storey drift profiles... 202 Figure 4.31 – BF and SR 975-yrp tests: storey shear versus inter-storey drift ... 203 Figure 4.32 – BF and SR tests: storey shear versus inter-storey drift... 204 Figure 4.33 – BF and SR tests: maximum relative rotation demands for the 975-yrp tests... 205 Figure 4.34 – BF and SR tests: relative energy dissipation profiles... 206 Figure 4.35 – BF and SR tests: relative energy dissipation profiles (475-yrp
and 975-yrp tests)... 207
Figure 4.36 – BF and SR 475-yrp tests (beam 1st floor): a) maximum relative rotation; b) maximum uniform strain ... 207
Figure 4.37 – BF and SR 975-yrp tests (beam 1st floor): a) maximum relative rotation; b) maximum uniform strain ... 208
Figure 4.38 – BF and SR tests: a) maximum inter-storey drift; b) maximum global drift ... 209 Figure 4.39 – BF and SR tests: local rotation maximum demands ... 211 Figure 4.40 – BF and SR tests: total energy dissipation ... 212 Figure 4.41 – IN tests: storey displacement time histories... 214 Figure 4.42 – IN tests: top-displacement evolution ... 214 Figure 4.43 – IN tests: base-shear versus top-displacement... 215 Figure 4.44 – IN tests: envelope storey shear versus inter-storey drift... 215 Figure 4.45 – IN tests: storey shear versus inter-storey drift ... 216 Figure 4.46 – IN tests: a) maximum inter-storey drift profiles; b) maximum storey shear
Figure 4.47 – Types of damage in masonry infill panels (Sortis et al., 1999) ...221 Figure 4.48 – IN tests: maximum absolute and relative rotation demands ...223 Figure 4.49 – IN tests: relative energy dissipation profiles...224 Figure 4.50 – IN tests: storey and total energy dissipation ...225 Figure 4.51 – BF and IN tests: 1st and 2nd storey shear versus inter-storey drift and
respective envelope curves...227 Figure 4.52 – BF and IN tests (475 and 975-yrp): maximum inter-storey drift profiles ...228 Figure 4.53 – SC tests: storey displacement time histories...229 Figure 4.54 – SC tests: top-displacement evolution...230 Figure 4.55 – SC tests: base-shear versus top-displacement...230 Figure 4.56 – SC tests: storey shear versus inter-storey drift...231 Figure 4.57 – SC tests: envelope storey shear versus inter-storey drift...231 Figure 4.58 – SC tests: a) maximum inter-storey drift profiles; b) maximum storey shear
profiles ...232 Figure 4.59 – SC tests: maximum absolute and relative rotation demands ...234 Figure 4.60 – SC tests: storey and total energy dissipation ...236 Figure 4.61 – SC tests: relative energy dissipation profiles ...237 Figure 4.62 – IN and SC tests: base-shear versus global drift...238 Figure 4.63 – IN and SC tests: base-shear versus global drift and respective envelope
curves...238 Figure 4.64 – IN and SC tests: storey shear versus inter-storey drift and respective
envelope curves...239 Figure 4.65 – IN and SC tests: maximum inter-storey drift profiles...239 Figure 4.66 – KB-cyclic test: total storey shear versus relative storey displacement ...241 Figure 4.67 – KB-cyclic test: damage inspection ...242 Figure 4.68 – KB-cyclic test: shear force versus relative lateral displacement at the
shear-link...243 Figure 4.69 – KB-cyclic test: total lateral storey resistance and shear-link shear resistance...244 Figure 4.70 – KB-cyclic test: energy dissipation for retrofitted frame and shear-link...244
Figure 4.71 – KB-cyclic test: total storey shear versus relative storey displacement and
shear force versus relative lateral displacement at the shear-link ... 245 Figure 4.72 – Controlled force pattern and top-displacement: a) schematic representation;
b) history of imposed lateral displacements... 246 Figure 4.73 – SR and SR-cyclic tests: storey shear versus inter-storey drift... 249 Figure 4.74 – SR and SR-cyclic tests: base-shear versus top-displacement... 250 Figure 4.75 – SR2000 and SR-cyclic tests (frame B): maximum absolute rotation
demands ... 251 Figure 4.76 – SR2000 and SR-cyclic tests (frame B): maximum relative rotation
demands ... 251 Figure 4.77 – Nomenclature of the repaired external top-column (1st and 2nd storeys)... 252 Figure 4.78 – Frame B (evolution of N2 and D2 top-columns dislocation): a) test L33
(before repair), b) test L38 (after repair)... 253 Figure 4.79 – Frame B (joints N2 and D2): top-columns dislocation versus inter-storey
drift before repair (test L33) and after repair (test L38) ... 253 Figure 4.80 – BF and BF-cyclic tests: storey shear versus inter-storey drift... 255 Figure 4.81 – BF and BF-cyclic tests: base–shear versus top-displacement ... 256 Figure 4.82 – Maximum uniform strain for positive and negative bending at the plastic
hinge zone for the BF and SR tests... 258 Figure 4.83 – BF475 test (1st storey strong-column): a) ID; b) elongation in transducer
#105... 259 Figure 4.84 – IN975 test (1st storey strong-column): a) ID; b) elongation in transducer
#105... 259 Figure 4.85 – Scheme of the slab-participation... 261 Figure 4.86 – Scheme of the slab-participation... 261 Figure 4.87 – BF tests: maximum deformation distribution (mm) at the internal long-bay... 262 Figure 4.88 – SR tests: maximum deformation distribution (mm) at the internal long-bay... 262 Figure 4.89 – Nomenclature for diagonal deformation (six zones) in the short external
panel... 264 Figure 4.90 – IN tests: 1st storey strain of the short external panel (total mean diagonal
strain) ... 266 Figure 4.91 – IN tests: 2nd storey strain of the short external panel (total mean diagonal
Figure 4.92 – IN tests: 1st storey strain of the short external panel (middle) ...266 Figure 4.93 – IN tests: 2nd storey strain of the short external panel (middle) ...266 Figure 4.94 – IN tests: 1st storey strain of the short external panel (diagonal ascendant /)...267 Figure 4.95 – IN tests: 1st storey strain of the short external panel (diagonal descending \)...267 Figure 4.96 – IN tests: 2nd storey strain of the short external panel (diagonal ascendant /)...267 Figure 4.97 – IN tests: 2nd storey strain of the short external panel (diagonal
descending \) ...267 Figure 4.98 – SC tests: 1st storey strain of the short external panel (total mean diagonal
strain) ...269 Figure 4.99 – SC tests: 2nd storey strain of the short external panel (total mean diagonal
strain) ...269 Figure 4.100 – SC tests: 1st storey strain of the short external panel (middle) ...270 Figure 4.101 – SC tests: 2nd storey strain of the short external panel (middle) ...270 Figure 4.102 – SC tests: 1st storey strain of the short external panel
(diagonal ascendant /)...270 Figure 4.103 – SC tests: 1st storey strain of the short external panel
(diagonal descending \)...270 Figure 4.104 – SC tests: 2nd storey strain of the short external panel
(diagonal ascendant /)...271 Figure 4.105 – SC tests: 2nd storey strain of the short external panel
(diagonal descending \)...271
CHAPTER 5 – NUMERICAL SIMULATION OF THE PSEUDO-DYNAMIC TESTS ON THE FOUR-STOREY RC FRAMES
Figure 5.1 – Schematic flow chart of modelling procedures adopted for the RC frames ...288 Figure 5.2 – Model of the plane bare frame...290 Figure 5.3 – Generic element model: association of sub-elements with elastic linear
(joints and central elements) and non-linear behaviour (plastic hinge zones) ...292 Figure 5.4 – Length of the non-linear fibre element ...295 Figure 5.5 – General fibre method: section, discrete elements and curvature (adapted from
Figure 5.6 – Discrete elements for the fibre model... 298 Figure 5.7 – Concrete axial stress-strain constitutive law: envelope monotonic curves for
concrete under tension and compression with the effects of confinement and
cyclic curves (Guedes, 1997)... 300 Figure 5.8 – Uniaxial constitutive model for steel (Guedes, 1997)... 301 Figure 5.9 – Bond-slip deformation of the constituent materials... 303 Figure 5.10 – Correction of the steel reinforcing constitutive law... 304 Figure 5.11 – Bond stress-slip relationship (CEB-217, 1993) ... 305 Figure 5.12 – Bond stress-slip relationship for smooth reinforcing steel... 306 Figure 5.13 – Comparison of the bond stress-slip behaviour of plain and deformed bars
(Rehm, 1961; CEB-217, 1993) ... 307 Figure 5.14 – Bond stress-slip behaviour of plain bars (Rehm studies, 1961; and, MC-90,
1990) ... 307 Figure 5.15 – Computed relative steel strain function of the total ('concrete') strain ... 307 Figure 5.16 – Computed steel strain function of the total ('concrete') strain ... 307 Figure 5.17 – Proposed bond stress-slip relationship for smooth reinforcing bars... 309 Figure 5.18 – Variation of sectional properties along the span of a beam (Paulay and
Priestley, 1992) ... 310 Figure 5.19 – Variation of sectional properties along the span of a beam (Paulay and
Priestley, 1992) ... 311 Figure 5.20 – Effective flange width of T-beam... 312 Figure 5.21 – Slab geometry and reinforcement details ... 313 Figure 5.22 – Equivalent bracing action of masonry infill in the frame behaviour
(Paulay and Priestley, 1992) ... 314 Figure 5.23 – Equivalent strut for the infill masonry model: a) geometric support of the
strut diagonals; b) envelope and cyclic curves of the uniaxial behaviour law
(Combescure and Pegon, 1996) ... 316 Figure 5.24 – Model of the plane infilled frame ... 318 Figure 5.25 – Typical diagrams for a device: a) schematic, and b) typical diagram for a
device tested at ELSA in the framework of the project REEDS (Molina et
al., 2000.a) ... 319
Figure 5.27 – Bracing system in the shorter-external bay: device details and general
layout ...320 Figure 5.28 – Vulnerability functions: a) top-displacement; b) base-shear...321 Figure 5.29 – Evolution of energy dissipation ...321 Figure 5.30 – Loading and modelling sequence for the SR numerical analyses ...323 Figure 5.31 – Natural first four modal frequencies and mode shapes numerically
evaluated for the BF and IN structures ...329 Figure 5.32 – BF: storey displacement time histories (4th, 3rd, 2nd and 1st storeys) ...333 Figure 5.33 – BF: inter-storey drift time histories (4th, 3rd, 2nd and 1st storeys) ...334 Figure 5.34 – BF: storey shear time histories (4th, 3rd, 2nd and 1st storeys)...335 Figure 5.35 – BF: storey shear versus inter-storey drift (4th, 3rd, 2nd and 1st storeys) ...336 Figure 5.36 – BF: dissipated energy at storey level (4th, 3rd, 2nd and 1st storeys) ...336 Figure 5.37 – BF: base-shear versus top-displacement...337 Figure 5.38 – BF: total dissipated energy...337 Figure 5.39 – BF: maximum drift profile ...337 Figure 5.40 – BF: maximum shear profile ...337 Figure 5.41 – SR: storey displacement time histories (4th, 3rd, 2nd and 1st storeys) ...339 Figure 5.42 – SR: inter-storey drift time histories (4th, 3rd, 2nd and 1st storeys) ...340 Figure 5.43 – SR: storey shear time histories (4th, 3rd, 2nd and 1st storeys) ...341 Figure 5.44 – SR: storey shear versus inter-storey drift (4th, 3rd, 2nd and 1st storeys) ...342 Figure 5.45 – SR: dissipated energy at storey level (4th, 3rd, 2nd and 1st storeys) ...342 Figure 5.46 – SR: base-shear versus top-displacement...343 Figure 5.47 – SR: total dissipated energy...343 Figure 5.48 – SR: maximum drift profile ...343 Figure 5.49 – SR: maximum shear profile ...343 Figure 5.50 – IN: storey displacement time histories (4th, 3rd, 2nd and 1st storeys)...345 Figure 5.51 – IN: inter-storey drift time histories (4th, 3rd, 2nd and 1st storeys)...346 Figure 5.52 – IN: storey shear time histories (4th, 3rd, 2nd and 1st storeys)...347
Figure 5.53 – IN: storey shear versus inter-storey drift (4th, 3rd, 2nd and 1st storeys)... 348 Figure 5.54 – IN: dissipated energy at storey level (4th, 3rd, 2nd and 1st storeys) ... 348 Figure 5.55 – IN: base-shear versus top-displacement ... 349 Figure 5.56 – IN: total dissipated energy... 349 Figure 5.57 – IN: maximum drift profile ... 349 Figure 5.58 – IN: maximum shear profile ... 349 Figure 5.59 – Equivalent storey damping (%) for the earthquake and cyclic tests on the
BF and SR structures... 352 Figure 5.60 – Equivalent global damping (%) versus global drift for the earthquake and
cyclic tests on the BF and SR structures... 354 Figure 5.61 – Pushover capacity curves for the BF and SR structures... 355 Figure 5.62 – BF structure: pushover capacity curve (blue), PsD tests (green), and cyclic
test (red) ... 357 Figure 5.63 – BF storey shear-drift curves: pushover (blue), PsD tests (green), and cyclic
test (red) ... 357 Figure 5.64 – SR structure: pushover capacity curve (blue) and PsD tests (green) ... 358 Figure 5.65 – BF response estimation with the CSM... 359 Figure 5.66 – SR response estimation with the CSM... 360 Figure 5.67 – ADRS: for the earthquake input motions and EC8 (5% damping) ... 362 Figure 5.68 – Assessment of the BF with the CSM (subsoil class A; response spectra
type I) for input motions: a) ag = 2.180 m/s2; b) ag = 2.884 m/s2... 362 Figure 5.69 – Assessment of the SR with the CSM (subsoil class A; response spectra
type I) for input motions: a) ag = 2.180 m/s2; b) ag = 2.884 m/s2;
c) ag = 3.728 m/s2... 363 Figure 5.71 – Assessment of the SR with the CSM (subsoil class A; response spectra
type I) for input motions: ag = 2.180 m/s2, ag = 2.884 m/s2
and ag = 3.728 m/s2... 364 Figure 5.72 – MDOF structural simplified model with concentrated masses at storey
levels being connected by shear beam elements: a) damping defined for
each storey, b) global first mode structural damping ... 367 Figure 5.73 – Reduced spectral seismic demand ... 370 Figure 5.74 – Inter-storey drift profile computed and PsD test results for the BF structure... 372 Figure 5.75 – Inter-storey drift profile computed and PsD test results for the SR structure... 372
Figure 5.76 – Vulnerability functions of the top-displacement and storey drift for the BF
structure calculated with the multi-mode model...374
Figure 5.77 – BF capacity curves: multi-mode method (black), pushover (blue), PsD tests (green) and cyclic test (red)...374
Figure 5.78 – Lateral storey shear versus inter-storey drift behaviour (exact and idealized
bilinear behaviour)...382 Figure 5.79 – Control variable: strength (yielding shear force - Fy)...383 Figure 5.80 – Problem I: a) yielding displacement constant; b) yielding stiffness constant ...384 Figure 5.81 – Control variable: pre-yielding stiffness (Ky) ...384 Figure 5.82 – Control variable: yielding force of the dissipator device...386 Figure 5.83 – Iterative optimization procedure ...388 Figure 5.84 – First order derivatives - Numerical evaluation ...389 Figure 5.85 – Storey Shear-drift curves adopted from the experimental tests...390 Figure 5.86 – Storey strength (N) ...392 Figure 5.87 – Objective function (N) ...392 Figure 5.88 – Storey displacements (m)...392 Figure 5.89 – Inter–storey drift (m) ...392 Figure 5.90 – Converged solution: shear-drift storey response...392 Figure 5.91 – Storey yielding strength of the existing structure and
optimum strengthening distribution...393 Figure 5.92 – Total additional strength ...394 Figure 5.93 – 1st storey additional strength ...395 Figure 5.94 – 2nd storey additional strength ...395 Figure 5.95 – 3rd storey additional strength ...396 Figure 5.96 – Vulnerability function of the structure designed for 2% drift and 2500-yrp...396
APPENDIX A – PHOTOGRAPHIC DOCUMENTATION AND STRENGHTENING DETAILS
Figure A.1 – Base foundation reinforcement (general view) and reinforcement of the
columns (lap-splice at the columns base) ... 423 Figure A.2 – Base foundation (detail): slender-column reinforcement and tubes to apply
the vertical jacks (for structure uplift) ... 423 Figure A.3 – General view of the base foundation (concrete casting) ... 423 Figure A.4 – Base foundation (concrete casting) and column longitudinal reinforcement
at the base with 180º bends ... 423 Figure A.5 – Slab reinforcement, reinforcement added in the attachment zone and plastic
tubes for connection to the steel loading frame ... 423 Figure A.6 – Joint detail... 423 Figure A.7 – Casting of the 1st floor (general view) ... 424 Figure A.8 – Casting of the 1st floor (general view): the 1st to 2nd floor transition without
lap–splice in the columns reinforcement. ... 424 Figure A.9 – Joints and columns reinforcement details ... 424 Figure A.10 – Construction at various phases (general views)... 425 Figure A.11 – Transport: vertical jacks ... 425 Figure A.12 – Transport: general view of the frames at the external area of the ELSA
laboratory ... 426 Figure A.13 – Frames transportation ... 426 Figure A.14 – Vertical connectors pre–stressing (to attach the actuators at the steel load
frame) ... 427 Figure A.15 – Steel frames: a) pined bars connecting the two frames and fixings to the
reaction-wall; b) frame to control out-of-plane deformation in the frame
extremity opposite to the reaction-wall ... 427 Figure A.16 – Fixings to the reaction-wall, steel pined bars connecting the two frames
and actuators... 427 Figure A.17 – Additional loads (2.7 ton concrete blocks and 1.2 ton steel plates) and
floor attachment steel bars system with pre–stressed connectors... 428 Figure A.18 – Actuators (double acting servo-hydraulic actuator linked at the extremity
to piezoresistive load cell)... 428 Figure A.19 – Displacement controllers (HEIDENHEIN optical transducers)... 428
Figure A.20 – Acquisition, control and monitoring system...428 Figure A.21 – Instrumentation: strong-column at 1st storey...429 Figure A.22 – Instrumentation: slab (below) ...429 Figure A.23 – Instrumentation: inclinometers ...429 Figure A.24 – 1st storey strong-column: selective retrofitting (ductility and shear
resistance improvement) and instrumentation (strong-column, slab, joint
and beam deformation) ...429 Figure A.25 – Strength improvement: connection of the steel bars to columns...429 Figure A.26 – Construction of the infill masonry walls: sequential phases and detail ...430 Figure A.27 – Four-storey full-scale reinforced concrete infilled frame: a) construction of
the masonry inf ill walls; b) general views of the structure...430 Figure A.28 – Infill strengthening construction: sequential operations and details of the
reinforcing steel mesh...431 Figure A.29 – Infills instrumentation installed for the IN and SC tests: panels and local
instrumentation at the panel corners of the short external panel...431 Figure A.30 – Concrete specimens extraction from the frame structure...432 Figure A.31 – Additional masses (water reservoirs)...432 Figure A.32 – Instrumentation in repaired external joints (relative displacement
transducer)...432 Figure A.33 – Instrumentation at the 1st storey strong-column for the final capacity cyclic
test...432 Figure A.34 – Storey displacement measurement systems: HEIDENHEIN and
PSITRONIX displacement transducers...432 Figure A.35 – K-bracing and shear-link: summary table ...433 Figure A.36 – K-bracing and shear-link: general layout ...433 Figure A.37 – K-bracing and shear-link: shear-link details ...434 Figure A.38 – K-bracing and shear-link: details of shear-link and adjacent connections ...434 Figure A.39 – K-bracing and shear-link: detail of braces...434 Figure A.40 – K-bracing and shear-link: detail of the bottom braces connection ...434 Figure A.41 – K-bracing and shear-link: detail of Pos. 8...435 Figure A.42 – K-bracing and shear-link: detail of Pos. 14 ...435
Figure A.43 – K-bracing and shear-link: detail of Pos. 15... 435 Figure A.44 – K-bracing and shear-link: detail of Pos. 16... 435 Figure A.45 – K-bracing and shear-link: detail of Pos. 17 and Pos. 2... 435 Figure A.46 – Columns drilling: strong-column (left) and weak column (right) ... 436 Figure A.47 – Anchoring of the top-beam to the existing RC frame ... 437 Figure A.48 – Bottom-beams: drilling ... 438 Figure A.49 – Shear-link with the surrounding beam and braces... 438 Figure A.50 – Bracing instrumentation (strain-gauges)... 438 Figure A.51 – Instrumentation: relative displacement transducer (detail of the zone
nearest to the shear-link)... 439 Figure A.52 – Repair operations (steps): 4 – remove concrete at the top of the damaged
column; 5 – relocation of the column; 6 – concreting of the column/joint;
7 – strengthening with carbon fibre ... 439 Figure A.53 – Repair intervention: frame B... 440 Figure A.54 – Repair intervention: frame A... 440 Figure A.55 – Damages on the first storey strong-column: frame A ... 440 Figure A.56 – Column repaired with carbon fibre materials ... 440 Figure A.57 – Strong-column (frame B) repair intervention (schematic sequential
operations): 1– longitudinal fibres; 2 – confinement of the column upper-part; 3 – confinement of the column low part (including bar termination
zone) ... 441 Figure A.58 – Joints repair intervention: schematic sequential operations ... 441 Figure A.59 – Sequential operation phases for the joints intervention ... 442
APPENDIX B – TESTS RESULTS AND PHYSICAL DAMAGE PATTERNS: Visual inspection and photographic documentation
Figure B.1 – Plots of the time-domain identified frequency and damping ratio for the first two vibration modes of BF475 (L05), BF975 (L06), SR475 (L10),
SR975 (L11) and SR2000 (L12) ... 445 Figure B.2 – Equivalent modal frequency and damping for the virgin bare frame (10%
Figure B.3 – Equivalent modal frequency and damping for the BF 475-yrp test...447 Figure B.4 – Equivalent modal frequency and damping for the BF 975-yrp test...448 Figure B.5 – Equivalent modal frequency and damping for the BF after 975-yrp
earthquake test (5% intensity of 475-yrp earthquake) ...449 Figure B.6 – Equivalent modal frequency and damping for the SR - 5% intensity of
475-yrp earthquake (before full-intensity earthquake tests)...450 Figure B.7 – Equivalent modal frequency and damping for the SR 475-yrp test...451 Figure B.8 – Equivalent modal frequency and damping for the SR 975-yrp test...452 Figure B.9 – Equivalent modal frequency and damping for the SR 2000-yrp test...453 Figure B.10 – Equivalent modal frequency and damping for the SR after 2000-yrp
earthquake test (5% intensity of 475-yrp earthquake) ...454 Figure B.11 – Damage pattern after the bare frame tests (general layout) ...455 Figure B.12 – Slab damage pattern after the bare frame tests...455 Figure B.13 – BF975: the horizontal storey displacement is evidenced (comparing the
relative position of the transversal beams of the two frames)...456 Figure B.14 – BF975: Damage (spalling) at the top of the 3rd storey strong-column
(beginning)...456 Figure B.15 – BF975: damage (spalling) at the bar termination zone of the 3rd storey
strong-column ...456 Figure B.16 – BF975: damage (spalling) at the top of the 3rd storey strong-column ...456 Figure B.17 – BF975: damage (spalling) at the bar termination zone of the 3rd storey
strong-column ...456 Figure B.18 – Damage pattern after the selective strengthened frame tests (general
layout) ...457 Figure B.19 – Damage pattern after the infill frame tests (general layout) ...457 Figure B.20 – Slab damage pattern after the infill frame tests...458 Figure B.21 – IN975: damages at the 1st storey infill panels and RC strong-column at the
base...458 Figure B.22 – Damage pattern after the infill strengthened frame tests (general layout) ...459 Figure B.23 – Damage on the reinforced concrete frame, infill and infill strengthened
panels after the SC earthquake tests ...459 Figure B.24 – KB-cyclic test: damage pattern in the shear-link ...460
Figure B.25 – KB-cyclic test: damaged external columns ('shear-out') ... 460 Figure B.26 – KB-cyclic test: details of the damaged external columns ('shear-out')... 460 Figure B.27 – Frame A (brick infilled frame): damaged joints after the PsD tests... 461 Figure B.28 – Frame B (brick infilled 2nd storey and K-bracing with shear-link in the
CHAPTER 2 – SEISMIC VULNERABILITY AND REHABILITATION OF EXISTING RC STRUCTURES
Table 2.1 – Earthquake hazard level (according to SEAOC, 1995) ...24 Table 2.2 – Earthquake hazard level (according to ATC-40, 1996) ...24 Table 2.3 – Definition of a performance objective (according to ATC-40, 1996) ...29
CHAPTER 3 – EXPERIMENTAL WORK - TESTS DESCRIPTION
Table 3.1 – Testing programme...87 Table 3.2 – EC8 and EC2 requirements in terms of transversal reinforcement spacing
(in mm) ...93 Table 3.3 – Volumetric ratio of the columns transversal reinforcement (%)...93 Table 3.4 – Volumetric ratio of the columns longitudinal reinforcement (%)...95 Table 3.5 – C16/20 (nominal strength values) ...98 Table 3.6 – Tests on concrete specimens (average compressive strength)...98 Table 3.7 – Fe B22k (nominal properties)...99 Table 3.8 – Test on steel specimens (mean mechanical properties) ... 100 Table 3.9 – Hazard curves for the moderate-high European scenario ... 102 Table 3.10 – Quantities used in masonry construction by meter square of wall (reference
values)... 109 Table 3.11 – Mortar used in the joints and plaster (proportioning) ... 109