A work Project, presented as part of the requirement for the award of a Master Degree in International Finance from the NOVA – School of Business and Economics
THE EFFECT OF BOARD CHACTERISTICS ON SHORT-TERM ACQUISITION RETURNS:
A NORTH-AMERICAN PERSPECTIVE
JORIS BROUNS – 29374
A project carried out as part on the Master of Finance Program, under the supervision of: Pedro Luis Francisco Carvalho
2
Abstract
This paper investigates the effect that experience and diversification board have on short-term acquisition returns for investors. Additionally, it assesses whether the crisis changed the effect that board characteristics have on the short-term acquisition returns. It is found that several board experience characteristic do result in higher short-term acquisition returns for investors when taking the crisis into account these returns mainly persist in the post-crisis era, but not anymore in the pre-crisis era. For board diversification on the other hand, not many effects are found. The main finding here is that more woman on a board improves the short-term acquisition returns.
Keywords: Board experience, board diversification, acquisition announcements, short-term returns, financial crisis
3 Table of Contents 1. Introduction ... 4 2. Literature Review... 6 3. Research Design... 8 3.1 Methodology ... 8 3.2 Assumptions ... 9
3.3 Sample and Data Transformation ... 10
4. Empirical Results ... 14
4.1. Effect of Board Experience on short-term acquisition returns ... 14
4.2. Effect of Board Diversification on short-term acquisition returns ... 16
4.3. Effect of the Financial Crisis on relevance of board experience on returns ... 18
4.4. Effect of the Financial Crisis on relevance of board diversification on returns ... 20
5. Conclusion ... 22
6. Limitations and opportunities for future research ... 23
References ... 25
Appendix A ... 28
4
1. Introduction
Acquisitions have always been a vital part of the professional business environment. They make sure that bad performing companies are acquired and make a shift in performance. Additionally, they make sure that efficiencies are created by combining synergies and improving operation efficiency. It is therefore not surprising that in periods prior to the crisis a vast sum of money was spend on acquisitions, in 2007 in the US alone was more than $4 trillion spend on acquiring companies (Golubov, Petmezas and Travlos, 2012). The final decision in making these acquisitions lies with the board of a company. They in the end are responsible for the direction a company follows and especially with a major decision like an acquisition, they will be heavily involved. Hence, the board of directors should have a major impact on the acquisitions a company pursues. Another important stakeholder group that pays a large amount of interest to acquisitions are investors, who will benefit if acquisitions are performing well. Alternatively, they will refrain from investing in companies that are pursuing bad mergers.
Thus, the focus of this study is to analyze what board characteristics affects the gains, or returns, for investors when a company performs acquisitions. Due to the large nature of stock returns the focus of this paper solely lies on the short-term returns of a stock around the announcement date of an acquisition. This might not be as relevant for passive long-term investors, but is extremely important for active investors, since they heavily depend on such small fluctuations around announcement dates of acquisitions to improve their gains. Knowing what effect a board has on these gains might therefore provide them with extra information, thus the central research focus of this paper is: ‘What board characteristics generate short-term acquisition value?’
In order to assess the board characteristics they are subdivided into two categories of which the first is the board’s experience. It should be assumed that if the board has more experience, it will
5
manage to acquire companies which result in more synergies and higher operational gains. Therefore, the acquisitions of these companies should be met with a positive market perception and increase in the share price after the announcement of such an acquisition. The second category is the board’s diversification. It is assumed that the more diversified a board is, the more situations it has dealt with and total experience it has present, and therefore that this also has a positive impact on the engagement in better acquisitions. Thus, the first two sub-questions of this research are: ‘Does an experienced board generate short-term acquisition value?’ and ‘Does a diversified board
generate short-term acquisition value?’
There is however one important factor that should be taken into consideration when analyzing these effects, namely: the crisis. The crisis acted as a wake-up call to investors that the market functioning was anything but efficient and that there were vast amounts of information which were hidden from investors, too difficult to comprehend or just not taken into consideration. Given that investors experienced large amount of losses given these results it should be checked whether the crisis affected any of the abovementioned effects of board characteristics on short-term acquisition value. Therefore, the two remaining sub-questions are: ‘Did the Financial Crisis impact the effect
of an experienced board on short-term acquisition value?’ and ‘Did the Financial Crisis impact
the effect of a diversified board on short-term acquisition value?’
In the next section, existing literature regarding these topics is observed. This is followed by a deep dive into the methodology, assumptions, sample collection and the observations utilized to perform this research. In section four the empirical results are analyzed. The paper ends with a conclusion, in which the limitations and suggestions for future research are discussed.
6
2. Literature Review
This research is composed from several strands of literature. Namely, research on board governance and merger and acquisition research. There is a large amount of measures on which board quality can be measured and accordingly an even larger amount of factors, which are influenced by board governance. Some research tends to combine general board quality into one index, such as the MSCI quality index (MSCI, 2018); this however, results in a single number, of which few assumptions can be drawn. Other research tends to split up measures of board governance, such as the research of Nicolò, Laeven and Ueda (2008), where measures such as earnings smoothing, price synchronicity and changes in accounting standards are assessed, this results in the ability to analyze the results and their influence far further in depth. The problem remains that it is still hard to assess what good and what bad corporate governance characteristics are, especially with the large number of characteristics that are available. Van den Berghe and Levrau (2004) have evaluated the effectiveness of a large number of characteristics regarding board quality and found that the quantifiable research is far too traditional and that in practice there is a far higher importance on barely researched soft elements.
In recent years, several research has been performed on how to improve the board of directors. One of these strains of research argues that an increase in board diversity has a positive impact on the performance. Having more equal gender diversity presence improves the performance of a board (Brammer, Millington and Pavelin, 2009). This is in line with Ferrero, Izquierdo and Torres (2013) who argue for having more diversity in the ages of directors since it improves financial performance. Buse, Bernstein and Bilimoria (2014) argue that having a more international mixed board improved the effectiveness of board governance practices, thereby creating a better public image of the company. All this research combined hints that having a more diversified board on
7
several factors should most likely increase the overall performance, this is once again in line with previously conducted research by Brancato and Patterson (1999), where it is argues that overall board diversity improves shareholder value.
Luckily, there is a vast amount of literature present regarding whether managers conduct bad mergers and acquisitions in order to engage in ‘empire building’ (Shi, Hoskisson and Zhang, 2016). This shows that if governance is sub-optimal acquisitions are performed without having the shareholder in mind, but pure for personal gain. This is in line with the research by Qiu, Trapkov and Yakoub (2014) who argue that managers are even willing to pay premiums for mergers for their own personal gains, thereby foregoing shareholder gains. Moeler, Schlingemann and Stulz (2004) show the presence of merger waves and indicate that the merger wave of specifically 1990 resulted in a large amount of shareholder value destruction. This teaches us two things: firstly, that merger characteristics are prone to changes over time, which should be taken into consideration when analyzing them. Secondly, that mergers can decrease shareholder value by simple factors such as the period in which they took place. Combining these two strains of literature should result in a situation where shareholder value should not be destroyed when good board characteristics are present.
8
3. Research Design 3.1 Methodology
At the basis of this research lies the theory of Market Efficiency (Fama, 1970). When a company announces to acquire another company for a specific price, the market should react by valuing this deal with all available information. The change in the share price of a company around the acquisition date should therefore reflect the value that the market assigns to the acquisition. Given that the market is efficient, a deal is therefore immediately valued at the most accurate estimate, given the available information, and therefore there should be no reason to waste resources and re-evaluate the deal.
Given that deals will be valued at their correct price the aim of this research is to see if it is able to predict what the impact of board experience and diversification is on their ability to pick beneficial deals. Beneficial deals in this case are the deals which are deemed as valuable by the market, and which therefore result in a share price increase of the acquirer. An investors strategy, in which companies to invest, should change accordingly to board characteristics. If investors have knowledge on (sub-) optimal board characteristics they can predict which companies will make good (bad) deals, and should therefore be able to assign a higher (lower) value to the stock in their portfolio. The stock returns, which are the dependent variable in this research, are calculated as follows:
𝑅𝑒𝑡𝑢𝑟𝑛𝑠𝑆ℎ𝑜𝑟𝑡 =𝐴𝑐𝑞𝐶𝑙𝑜𝑠𝑖𝑛𝑔𝑃𝑟𝑖𝑐𝑒𝑡+1𝑑𝑎𝑦−𝐴𝑐𝑞𝐶𝑙𝑜𝑠𝑖𝑛𝑔𝑃𝑟𝑖𝑐𝑒𝑡−1𝑑𝑎𝑦
𝐴𝑐𝑞𝐶𝑙𝑜𝑠𝑖𝑛𝑔𝑃𝑟𝑖𝑐𝑒𝑡−1𝑑𝑎𝑦 (1)
𝑅𝑒𝑡𝑢𝑟𝑛𝑠𝐿𝑜𝑛𝑔 =𝐴𝑐𝑞𝐶𝑙𝑜𝑠𝑖𝑛𝑔𝑃𝑟𝑖𝑐𝑒𝑡+1𝑤𝑒𝑒𝑘−𝐴𝑐𝑞𝐶𝑙𝑜𝑠𝑖𝑛𝑔𝑃𝑟𝑖𝑐𝑒𝑡−1𝑑𝑎𝑦
𝐴𝑐𝑞𝐶𝑙𝑜𝑠𝑖𝑛𝑔𝑃𝑟𝑖𝑐𝑒𝑡−1𝑑𝑎𝑦 (2)
Where t is the acquisition announcement date. The reason why two different returns are assessed is in order to see if unexpected returns last beyond the initial shock of the announcement, or if they are relatively short term focused, and should be acted upon as soon as possible. Or alternatively,
9
if they tend to last for a longer period in time, and do not require the urgency to be reacted upon immediately after an acquisition announcement. There should caution heeded with the longer week returns, since with an increasing time period there will be more external factors incorporated.
3.2 Assumptions
As stated before, the main underlying assumption of this research is the perfect market hypothesis (Fama, 1970). While it might be extreme to believe that the stock market price contains all information, it is a safe to say that the average assumption regarding the stock price is included in this number. A danger arises when a prolonged period of a bull- or bear-market persists, this results in the overall market being over- or under-valued. This however is not the focus of this research, even if an overall tendency exists to over- or under-valuate stocks, the returns can still be predicted by board characteristics. Therefore, it is beneficial for shareholders to have knowledge on the effect of board characteristics on the ability of a board to find good acquisitions. While in the long run a severe mispricing of a stock might impact the actual result of an acquisition, it is unlikely for the short run result to be affected by this.
This research focuses solely on short-term returns and therefore day-traders. While according to the efficient market hypothesis the stock should be correctly priced after an acquisition, this does not take into consideration the inside information that the board might have on synergies of the stock. The market might consider these long-run expectations when valuing stocks, but these expectations will be inaccurate due to lack of information. It could be that in the long-run acquisitions could generate value by utilizing synergies unobservable by the market. Once again, this is not the focus of this research and additional research should be assessed in order to see if board characteristics on experience and diversification influence the performance of acquisitions in the long run.
10
3.3 Sample and Data Transformation
In this section, the sample sources and transformation thereof are discussed. The sample is constructed from the combination of two data sources. One regards acquisition information, the other contains information regarding the board composition.
The board composition data is drawn from the WRDS BoardEx database (BoardEx, 2018). This database contains information on individual board members of listed companies per annual report. From this database information for each director is drawn: sex, nationality, time in the current company, time in other companies, time on the board, time on other boards, time performing the current role, number of listed and unlisted boards currently sitting on and sat on and the network size of each director (number of overlaps through employment, other activities, and education). This data is then transformed in order to assess the boards: male ratio; defined as the proportion of directors which are male, nationality ratio; defined as the proportion of directors with different nationality with respect to the majority of the board, mean and standard deviation of the other variables and the total sum of the network size over the board per annual report.
The acquisition data is retrieved from the SDC platinum M&A database (SDC Platinum, 2018). The withdrawn information contains: the acquisition announcement date, the acquirers closing stock price one day pre-announcement, the acquirers closing stock price one day and one week post-announcement, the acquirers industry, the amount of equity involved and the amount in the deal and the enterprise value of the targeted company. Four requirements are imposed on the data withdrawal process for it to share similarities with the research of Masulis, Wang, and Xie (2007): First, the acquirer is a publicly traded company and has stock returns available from one day prior to the acquisition announcement up to one week after the announcement. Second, the acquisition has a value of more than 10 million. Third, the acquirer aims to acquire 100% of the target
11
company. Fourth, there is a match for the company present in the BoardEx database, this entails that the annual report in which the board information was published is not older than one year prior to the acquisition announcement. Because the resulting acquirers spread across 54 unique industries, they are reclassified according to the Global Industry Classification Standard (GICS), which is a global academic standard for industry sectors (MSCI, 2018), in order to control for industries. The entire real estate sector is removed at this point, since it only contains nine data points.
Since stock returns tend to show extreme outliers, it is important that these are ignored, since they might heavily interfere with the results of the research. Hence, the bottom and top 1% of both the short- and long-returns, calculated as shown in formula 1 and 2, are winsorized. A total of 1,857 acquisitions remains with announcements ranging from 2000 to 2016. Table 1 summarizes the boards and acquisition characteristics. The enterprise value and equity value offered inhabit extreme differences, but this is due to the fact that the enterprise value does not imply how much equity the actual company is worth, since a large part of it might be debt, which should not be paid for. This is in line with the Efficient Market Hypothesis (Fama, 1970 & Samuelson, 1965). Additionally, the mean of both the one day and one week post-announcement acquirer closing stock price seems to lie marginally below the mean of the one day pre-announcement acquirer closing stock price. This is in line with previous research that underlines that mergers generally do not generate sustainable growth (Marimuthu and Kolandaisamy, 2009), hence investors will have a certain degree of wariness towards acquisitions.
The board compositions share similarities with research utilizing the Investors Responsibility Research Center (Duchin, Matsusaka, and Ozbas, 2010). Male and nationality ratio both show extremely skewed results, therefore both are analyzed further in depth in graph 1 and 2 in order to
12
see whether these results are industry dependent. This does not seem the case however, the diversification of boards regarding either nationality or sex seems to be lackluster in all industries, in line with earlier research (Carter, D’Souza, Simkins & Simpson, 2010). According to Rao & Reddy (2015) the performance of acquisitions was severely impacted by the financial crisis. Consequent impact on the frequency, equity value and enterprise value of acquisitions can be observed in appendix B. After the start of the crisis, which is assessed as the start of the housing market fall (Claessens, Laeven, Igan and Dellaricia, 2010), it can be seen that all three variables drop.
Summary Statistics
Statistic Mean Standard
Deviation
25th Percentile Median 75th Percentile
Acquisition Statistics EnterpriseValueDeal 2,189.271 1,259.633 1,141.2 2,152 3,272.8 EquityValueDeal 1,987.042 5,877.416 91.576 330.816 1,384.163 AcqClosingPrice1DayPreAnn 38.840 56.649 14.415 28.498 46.127 AcqClosingPrice1DayPostAnn 38.973 57.073 14.569 28.445 46.987 AcqClosingPrice1WeekPostAnn 38.828 56.349 14.485 28.595 46.277 Board Statistics MaleRatio 0.886 0.094 0.818 0.889 1.000 NationalityRatio 0.105 0.173 0.000 0.000 0.200 NumberDire 10.287 3.168 8.000 10.000 12.000 NetworkSize_Mean 1,330.847 970.355 624.246 1,087.991 1,758.639 NetworkSize_SD 1,018.523 671.966 561.245 914.210 1,280.302 NetworkSize_sum 14,295.490 12,701.760 5,670.2 10,361 18,278.5 TimeBrd_Mean 7.674 3.630 5.129 7.500 9.985 TimeBrd_SD 5.312 3.198 2.978 5.041 7.297 TimeInCo_Mean 8.397 4.067 5.478 8.261 10.927 TimeInCo_SD 5.907 3.633 3.165 5.626 8.346 TimeRetire_Mean 8.271 4.108 5.578 7.958 10.672 TimeRetire_SD 7.394 2.267 5.857 7.077 8.701 TimeRole_Mean 6.127 2.946 4.035 5.975 7.779 TimeRole_SD 4.521 2.653 2.576 4.335 6.052 AvgTimeOth_Mean 3.651 1.999 2.281 3.546 4.900 AvgTimeOth_SD 3.798 2.142 2.443 3.443 4.745 TotCurrNoL_Mean 2.079 1.969 1.400 1.923 2.444 TotCurrNoL_SD 1.051 0.871 0.632 0.982 1.339 TotCurrNoU_Mean 2.121 1.039 1.500 1.875 2.426 TotCurrNoU_SD 1.429 1.316 0.699 1.113 1.732
13
TotNoLstdB_Mean 3.460 2.466 2.111 3.300 4.452
TotNoLstdB_SD 2.207 1.473 1.252 2.045 2.946
TotNoUnLst_Mean 4.865 2.245 3.400 4.500 5.875
TotNoUnLst_SD 3.840 2.550 2.193 3.314 4.690
Table 1: Summary Statistics. This table reports the results from the summary characteristics of the analyzed data. The data regards North-American data and ranges from 2000 to 2016. EnterpriseValueDeal is the multiplication of target actual shares outstanding by the offer price in addition to the cost to acquire convertible securities, short-term debt, straight debt, and preferred equity minus cash and marketable securities, stated in millions. EquityValueDeal is the multiplication of the target actual shares outstanding by the offer price. AcqClosingPrice1DayPreAnn is the acquirer’s closing price one day prior to the acquisition announcement. AcqClosingPrice1DayPostAnn is the acquirer’s closing price one day after the acquisition announcement. AcqClosingPrice1WeekPostAnn is the acquirer’s closing price one week after the acquisition announcement. The MaleRatio indicates the proportion of male directors. The NationalityRatio indicates the proportion of directors from different countries observed versus the biggest nationality group in a board. NumberDire shows the amount of directors in a board. The remaining characteristics are all calculated based upon the mean, standard deviation or sum of the entire board. Networksize is the network of a director (employment, other activities and education overlap). TimeBrd is the time the director has been sitting on the board. TimeInCo is the time the director has been in the company. TimeRetire is the assumed retiremed age of 70 minus the age of the director. TimeRole is the time the director has been performing their current role. AvgTimeOth is the average time a director has been on boards. TotCurrNoL is the amount of listed boards the director is currently in. TotCurrNoU is the amount of unlisted boards the director is currently in. TotNoLstdB is the amount of listed boards the director sat on in total. TotNoUnLst is the amount of unlisted boards the director sat on in total.
Figure 1: Average Male Board Ratio by Industry of the sample. Average Male Board Ratio indicates the average proportion of male directors.
Figure 2: Average Nationality Board Ratio by Industry of the Sample. Average Nationality Board Ratio indicates the average proportion of directors from different countries, observed versus the biggest nationality group in a board.
14
4. Empirical Results
4.1. Effect of Board Experience on short-term acquisition returns
In order to assess the effect of board experience on the capabilities of the board to pick acquisitions that are deemed well by the market, all the means are taken from the summary statistics as independent variables. Additionally, the effect of the number of directors is assessed since more directors imply that there is more experience present in the board. On top of this is the sum of all the networks of directors together observed, in order to see if a total larger circle of contacts has a positive effect on the board acquisition picking performance. Lastly, the entire model is controlled for the equity and enterprise value involved (Avery, Chevalier and Schaefer, 1998) and for the individual industries (Chon, Choi, Barnett, Danowski and Joo, 2003) the results of this model can be observed in table 2.
An interesting observation straight away is that no variables apart from the number of directors are significant anymore for the one-week returns. This is most likely because a large amount of noise arises after an acquisition announcement, and the board experience characteristics are too minor to provide any clear reasoning on performance given the amount of noise. The one-day returns however do show some interesting results. The average network size per director has a positive impact on the returns, implying that having more connections results in investors, which have more experience and ability to pick stocks. Surprisingly, the board’s sum of the total network shows almost exactly the opposite result. It might be because having a large total network for the board might cause so much noise that the board is actually misinformed (Kim, 2005). The last significant value here is the time to retirement; the negative sign here is quite surprising, since one would expect that directors who are closer to retirement to be less invested in the performance of the company, thus expecting a positive sign. There is however, some hidden information in this
15
variable, which is the average age of the director, since the variable only measures the expected retirement age of 70 minus the age of the director. Hence a negative sign also indicates that having older directors results in better returns. This is in line with the expectation that having more experience improves the ability to pick quality acquisitions (McIntyre and Murphy, 2008).
When the control variables are assessed, some interesting additional results show up. While it is not relevant for the current research focus, industry sectors do have a clear impact on short-term acquisition returns. Since all industry coefficients are negative or insignificant it seems to be that the consumer discretionary industry has higher short-term acquisition returns. Additionally, as expected according to Avery, Chevalier and Schaefer (1998) the enterprise value of a deal does not have an effect on the short term returns, the equity value however does, in line with the empire building theory. This indicates that boards might be targeting bigger firms for the sake of creating a bigger company, and not for shareholder benefits (Shi, Hoskisson and Zhang, 2016).
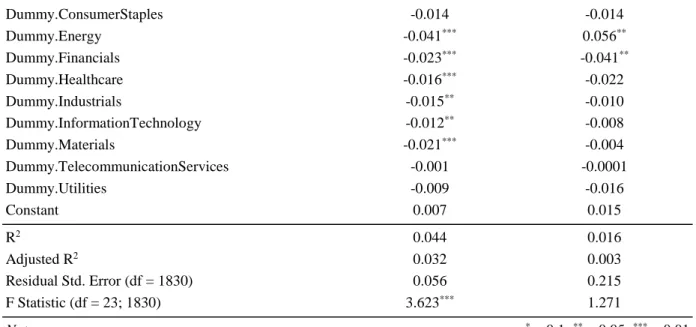
Experience-Governance Effects on short-term acquisition returns Dependent variable:
Returns ReturnsLong
Independent Experience Variables
NumberDire 0.001 0.005** TimeInCo_Mean -0.001 -0.007 TimeBrd_Mean 0.00001 0.006 TimeRole_Mean 0.001 0.004 NetworkSize_Mean 0.00001*** 0.00001 NetworkSize_Sum -0.00000** -0.00000 AvgTimeOth_Mean -0.0004 -0.003 TotNoLstdB_Mean -0.003 -0.003 TotCurrNoL_Mean 0.003 0.003 TotNoUnLst_Mean 0.001 -0.002 TotCurrNoU_Mean -0.002 -0.001 TimeRetire_Mean -0.001** -0.001 Control Variables DealEquityValue -0.00000*** -0.00000 DealEnterpriseValue -0.00000 -0.00001
16 Dummy.ConsumerStaples -0.014 -0.014 Dummy.Energy -0.041*** 0.056** Dummy.Financials -0.023*** -0.041** Dummy.Healthcare -0.016*** -0.022 Dummy.Industrials -0.015** -0.010 Dummy.InformationTechnology -0.012** -0.008 Dummy.Materials -0.021*** -0.004 Dummy.TelecommunicationServices -0.001 -0.0001 Dummy.Utilities -0.009 -0.016 Constant 0.007 0.015 R2 0.044 0.016 Adjusted R2 0.032 0.003 Residual Std. Error (df = 1830) 0.056 0.215 F Statistic (df = 23; 1830) 3.623*** 1.271 Note: *p<0.1; **p<0.05; ***p<0.01
Table 2: Experience-Governance Effects on short-term acquisition returns. NumberDire is the amount of directors in a board. For the further Experience Variables either the mean or the sum of a board is calculated. TimeBrd is the time the director has been sitting on the board. TimeInCo is the time the director has been in the company. TimeRetire is the assumed retiremed age of 70 minus the age of the director. TimeRole is the time the director has been performing their current role. AvgTimeOth is the average time a director has been on boards. TotCurrNoL is the amount of listed boards the director is currently in. TotCurrNoU is the amount of unlisted boards the director is currently in. TotNoLstdB is the amount of listed boards the director sat on in total. TotNoUnLst is the amount of unlisted boards the director sat on in total. The data is controlled for equity, enterprise and industries involved, the base industry is Consumer Discretionary.
4.2. Effect of Board Diversification on short-term acquisition returns
This section analyzes the effect of board diversification the capabilities of boards to pick acquisitions which result in positive post-announcement returns. In contrast to the previous section, here the standard deviation of the board characteristics is analyzed. It is important to keep in mind that this is not the standard deviation of previously stated means, but instead the standard deviation per board as an independent variable.
In order to assess the effect of board diversification on the capabilities of the board to pick acquisitions that are deemed well by the market all the standard deviations from individual boards are analyzed. Additionally, the effect of the ratio of males and nationality in measured, since both of these factors should result in a more heterogeneous board. Once again, the number of directors is added to the model, since a larger number of directors should result in more different characteristics in a board. Finally, the entire model is again controlled for the equity and enterprise
17
value involved and for the individual industries in a similar style as previous section. The results of this model can be observed in table 3.
Interestingly, the results of a diversified board do not seem very impactful on the ability of the board to pick beneficial acquisitions. The most important finding is the negative coefficient for male ratio, this indicates that the lower the male ratio, the better the performance, which is in line with Brammer, Millington and Pavelin (2009). As can be seen in figure 1, male ratio reaches close to 1 for every industry, therefore just adding more woman might reach a point of diminishing returns or even result in the opposite effect. Nevertheless, this point of adverse effects is seemingly not reached and more woman should certainly be beneficial given the large amount of males currently present in boards. As for the control variables, these are once again very similar to the board experience model used in the previous section. A higher equity value has once again a negative effect on the short-term acquisition returns. Whereas the consumer discretionary industry is again outperforming other industries on short-term acquisition returns.
Diversification-Governance Effects on short-term acquisition returns Dependent variable:
Returns ReturnsLong
Independent Diversification Variables
MaleRatio -0.038** -0.029 NationalityRatio -0.008 -0.020 NumberDire 0.0004 0.004* TimeInCo_SD -0.001 -0.003 TimeBrd_SD -0.001 0.001 TimeRole_SD 0.002 0.004 NetworkSize_SD 0.00000 -0.00001 AvgTimeOth_SD -0.0005 -0.001 TotNoLstdB_SD -0.001 -0.003 TotCurrNoL_SD -0.003 -0.011 TotNoUnLst_SD 0.001 -0.0003 TotCurrNoU_SD 0.001 0.002 TimeRetire_SD 0.001 0.002
18 Control Variables DealEquityValue -0.00000*** -0.00000 DealEnterpriseValue -0.00000 -0.00001 Dummy.ConsumerStaples -0.016* -0.017 Dummy.Energy -0.036*** 0.071*** Dummy.Financials -0.024*** -0.040** Dummy.Healthcare -0.013** -0.017 Dummy.Industrials -0.013* -0.010 Dummy.InformationTechnology -0.008 -0.004 Dummy.Materials -0.017*** 0.0001 Dummy.TelecommunicationServices -0.005 -0.006 Dummy.Utilities -0.010 -0.019 Constant 0.041** 0.029 R2 0.041 0.018 Adjusted R2 0.028 0.004 Residual Std. Error (df = 1785) 0.055 0.216 F Statistic (df = 24; 1785) 3.174*** 1.339 Note: *p<0.1; **p<0.05; ***p<0.01
Table 3: Diversification-Governance Effects on short-term acquisition returns. MaleRatio is the ratio of males on the board. NationalityRatio is the proportion of directors from different countries. NumberDire is the amount of directors in a board. For the further Diversification Variables the standard deviation of a board is calculated. TimeBrd is the time the director has been sitting on the board. TimeInCo is the time the director has been in the company. TimeRetire is the assumed retiremed age of 70 minus the age of the director. TimeRole is the time the director has been performing their current role. AvgTimeOth is the average time a director has been on boards. TotCurrNoL is the amount of listed boards the director is currently in. TotCurrNoU is the amount of unlisted boards the director is currently in. TotNoLstdB is the amount of listed boards the director sat on in total. TotNoUnLst is the amount of unlisted boards the director sat on in total. The data is controlled for equity, enterprise and industries involved, the base industry is Consumer Discretionary.
4.3. Effect of the Financial Crisis on relevance of board experience on returns
As already stated in the data description: the crisis had severe impact on the frequency of acquisitions, equity value and enterprise value. The crisis was probably far more impactful and it has likely influenced investors’ weariness on factors influencing their returns (Guiso, Sapienza and Zingales, 2013). Therefore a dummy variable is added in order to assess pre- and post-crisis returns. Additionally, interaction variables are added to assess the change of each independent variable. The Post-Crisis dummy is assigned to acquisitions when their announcement date is older than October 15, 2007, this is the point at which point banks started to report heavy losses due to the housing market crash (Wang and Zhang, 2014).
19
In table 4 the results of this model can be observed. As can be seen most of the pre-crisis coefficients are not significant, while five of the post-crisis interaction variables are significant. Possibly, there has been a shift within the boards after the crisis so that there is more importance upon these variables. This however seems unlikely, since there is no reason to believe that for example the time to retirement has a different internal effect on returns after the crisis. More likely however, is the fact that investors pay more attention to these variables and therefore inherently adjust the stock price of an acquisition based upon the board characteristics. The logic of the coefficients is still in line with the assumptions made in the assessment of the experience-governance variables without the post-crisis dummies, even though this logic now only mostly holds for the post-crisis part of the dataset.
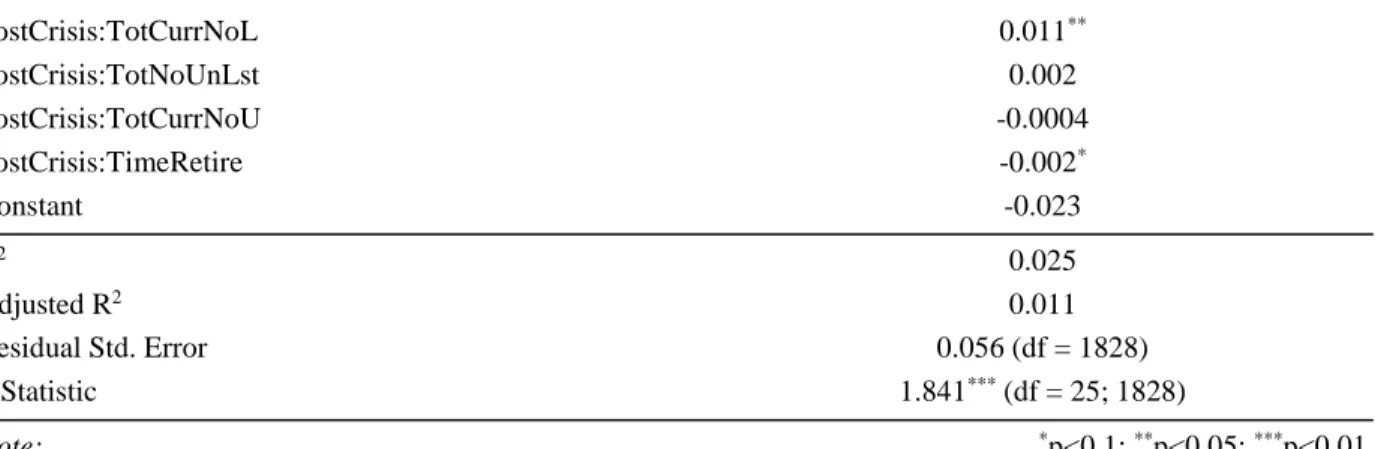
Experience-Governance Effects on short-term acquisition returns, adjusted for crisis Dependent variable: Returns NumberDire 0.0004 TimeInCo 0.001 TimeBrd -0.003 TimeRole 0.003* NetworkSize 0.00001 NetworkSize_sum -0.00000 AvgTimeOth 0.001 TotNoLstdB 0.003 TotCurrNoL -0.003 TotNoUnLst 0.0002 TotCurrNoU -0.003 TimeRetire 0.001 PostCrisis 0.004 PostCrisis:NumberDire 0.0003 PostCrisis:TimeInCo -0.004 PostCrisis:TimeBrd 0.007** PostCrisis:TimeRole -0.003 PostCrisis:NetworkSize 0.00001* PostCrisis:NetworkSize_sum -0.00000 PostCrisis:AvgTimeOth -0.001 PostCrisis:TotNoLstdB -0.009**
20 PostCrisis:TotCurrNoL 0.011** PostCrisis:TotNoUnLst 0.002 PostCrisis:TotCurrNoU -0.0004 PostCrisis:TimeRetire -0.002* Constant -0.023 R2 0.025 Adjusted R2 0.011 Residual Std. Error 0.056 (df = 1828) F Statistic 1.841*** (df = 25; 1828) Note: *p<0.1; **p<0.05; ***p<0.01
Table 4: Experience-Governance Effects on short-term acquisition returns, adjusted for crisis. NumberDire is the amount of directors in a board. For the further Experience Variables either the mean or the sum of a board is calculated. TimeBrd is the time the director has been sitting on the board. TimeInCo is the time the director has been in the company. TimeRetire is the assumed retiremed age of 70 minus the age of the director. TimeRole is the time the director has been performing their current role. AvgTimeOth is the average time a director has been on boards. TotCurrNoL is the amount of listed boards the director is currently in. TotCurrNoU is the amount of unlisted boards the director is currently in. TotNoLstdB is the amount of listed boards the director sat on in total. TotNoUnLst is the amount of unlisted boards the director sat on in total. The variables which have “PostCrisis:” in front of them are interaction variables to see how their coefficients respond post-crisis.
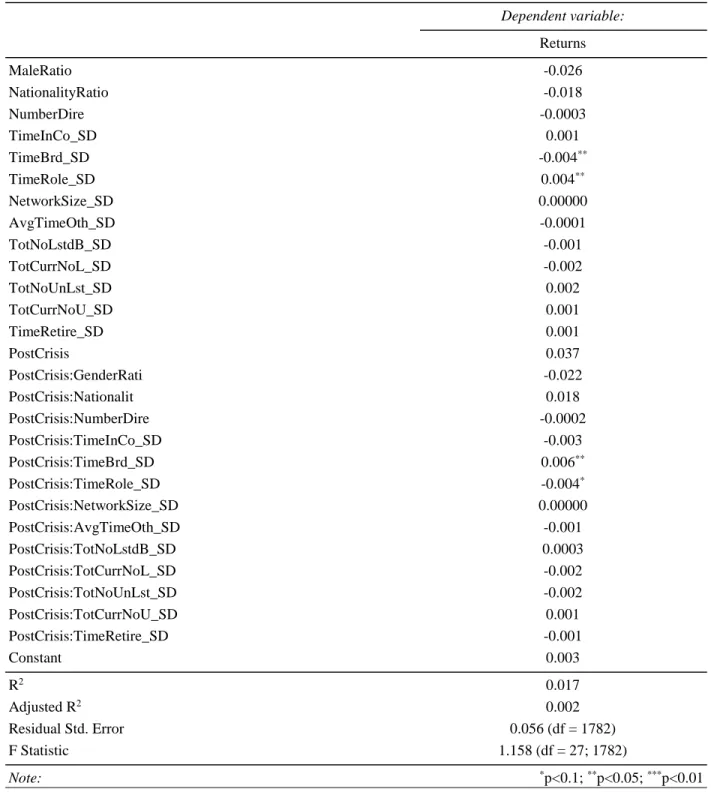
4.4. Effect of the Financial Crisis on relevance of board diversification on returns
Similarly, to the previous section in this section, there is also a Post-Crisis model generated for the diversification-board characteristics with similar reasoning, namely that the crisis most likely had an impact in how companies were managed and that investors started paying more attention. Table 5 shows the result of this model, but extremely similar to the diversification model without the Crisis dummy there are barely any significant coefficients in the model with the Post-Crisis dummy. The only interesting observation is that a higher diversification of board time has a negative impact on the returns and a higher diversification of role time has a positive impact on the returns. Surprisingly this only holds prior to the crisis, Post-Crisis both coefficients are offset by the Post-Crisis interaction variables. This might indicate that prior to the crisis there was a large focus on the diversification of board members on the time in board and time in role, but this was deemed less important post-crisis.
21
Diversification-Governance Effects on short-term acquisition returns, adjusted for crisis Dependent variable: Returns MaleRatio -0.026 NationalityRatio -0.018 NumberDire -0.0003 TimeInCo_SD 0.001 TimeBrd_SD -0.004** TimeRole_SD 0.004** NetworkSize_SD 0.00000 AvgTimeOth_SD -0.0001 TotNoLstdB_SD -0.001 TotCurrNoL_SD -0.002 TotNoUnLst_SD 0.002 TotCurrNoU_SD 0.001 TimeRetire_SD 0.001 PostCrisis 0.037 PostCrisis:GenderRati -0.022 PostCrisis:Nationalit 0.018 PostCrisis:NumberDire -0.0002 PostCrisis:TimeInCo_SD -0.003 PostCrisis:TimeBrd_SD 0.006** PostCrisis:TimeRole_SD -0.004* PostCrisis:NetworkSize_SD 0.00000 PostCrisis:AvgTimeOth_SD -0.001 PostCrisis:TotNoLstdB_SD 0.0003 PostCrisis:TotCurrNoL_SD -0.002 PostCrisis:TotNoUnLst_SD -0.002 PostCrisis:TotCurrNoU_SD 0.001 PostCrisis:TimeRetire_SD -0.001 Constant 0.003 R2 0.017 Adjusted R2 0.002 Residual Std. Error 0.056 (df = 1782) F Statistic 1.158 (df = 27; 1782) Note: *p<0.1; **p<0.05; ***p<0.01
Table 5: Diversification-Governance Effects on short-term acquisition returns, adjusted for crisis. MaleRatio is the ratio of males on the board. NationalityRatio is the proportion of directors from different countries. NumberDire is the amount of directors in a board. For the further Diversification Variables the standard deviation of a board is calculated. TimeBrd is the time the director has been sitting on the board. TimeInCo is the time the director has been in the company. TimeRetire is the assumed retiremed age of 70 minus the age of the director. TimeRole is the time the director has been performing their current role. AvgTimeOth is the average time a director has been on boards. TotCurrNoL is the amount of listed boards the director is currently in. TotCurrNoU is the amount of unlisted boards the director is currently in. TotNoLstdB is the amount of listed boards the director sat on in total. TotNoUnLst is the amount of unlisted boards the director sat on in total. The variables which have “PostCrisis:” in front of them are interaction variables to see how their coefficients respond post-crisis.
22
5. Conclusion
The results of this paper show that board governance certainly has a predictive factor in explaining the short-term returns on acquisition announcements of companies. This indicates that the board has an important role in how successful the market deems that the stock will be. If it is expected that a company will announce an acquisition, it might therefore be beneficial for investors to analyze the board composition in order to optimize the expected returns on the stock. Especially board experience has several integral factors that help explaining the short-term returns after an acquisition announcement. The main variables here being the network size of board members and the time to retirement, and inherently therefore also the age of the board members. Board diversification on the other hand can only be used to a marginal effect in order to predict short-term acquisition returns. The main predictor in question here is the male ratio of a board.
When these results are compared with the effect of the crisis, it can be observed that the crisis had a significant impact on the predictors of especially the governance experience. It turns out that post-crisis returns are far more impacted by board characteristics than pre-crisis returns. Indicating that board characteristics on their own might not indicate that companies can find better acquisitions, but that investors care about board characteristics post-crisis, and already incorporate this in valuing the acquisition itself post-crisis. This indicates the general weariness of investors in the post-crisis era to assess board characteristics with regards experience and diversification has increased over time.
23
6. Limitations and opportunities for future research
A few limitations should be taken into consideration when assessing this research; these could be improved and implemented in further research. Firstly, it is extremely important to keep in mind that this research only assesses the short-term results of board characteristics; this means that this research is far more important for active investors than passive investors. No conclusions should be drawn based upon this research that assesses the overall implication of board characteristics on the general performance of an acquisition or the long-term implications for the company. If one would want to assess the long-term effects of acquisitions, a dependent variable should be incorporated that assesses the effects over a longer period of time. Additionally, board characteristics over a longer period should be analyzed, since these there might be changes in the board.
Secondly, due to the limitations in the dataset several board characteristics are not considered in this research, but should be taken into consideration if they are available in datasets that are more complete. One of these characteristics is the amount of independent versus dependent board members (Ramos, Díaz and Ollalla, 2017), important hereby however is to keep consideration that there is a thin line between the these two categories, and more often than not they might fall in a grey area. Another characteristic is the importance of education; one could try to find a dataset that incorporates the level of education and years of education per director (Phan, 2016).
Lastly, does this research analyze the North-American market due to prevalence of data in this geographical area. Therefore, these results should be treated with caution when applied to other areas, since cultural differences might be present. In order to adjust for this a more complete dataset could be assembled where board and acquisition data is incorporated regarding the entire world. Alternatively, one could try to assemble a dataset of just two geographical areas and then try to
24
control it for cultural differences by utilizing a cultural framework like the Hofstede model (Hofstede, 1984).
25
References
Avery, C., Chevalier, J. A., & Schaefer, S. (1998). Why Do Managers Undertake Acquisitions? An Analysis of Internal and External Rewards for Acquisitiveness. Journal of Law,
Economics, and Organization,14(1), 24-43. doi:10.1093/oxfordjournals.jleo.a023398
BoardEx. (2018) Management Diagnostics Limited. [Online] Available at: Subscription Service (Accessed: February, 2018)
Brammer, S., Millington, A., & Pavelin, S. (2009). Corporate Reputation and Women on the Board. British Journal of Management,20(1), 17-29. doi:10.1111/j.1467-8551.2008.00600.x Brancato, Caroly Kay and Patterson, D. Jeanne, 1999, Board diversity in U.S corporations: Best
practices for broadening the profile of corporate boards. The Conference Board, Research
Report, 1230-99
Buse, K., Bernstein, R. S., & Bilimoria, D. (2014). The Influence of Board Diversity, Board Diversity Policies and Practices, and Board Inclusion Behaviors on Nonprofit Governance Practices. Journal of Business Ethics,133(1), 179-191. doi:10.1007/s10551-014-2352-z Carter, D. A., Dsouza, F., Simkins, B. J., & Simpson, W. G. (2010). The Gender and Ethnic
Diversity of US Boards and Board Committees and Firm Financial Performance. Corporate
Governance: An International Review,18(5), 396-414. doi:10.1111/j.1467-8683.2010.00809.x
Chon, B. S., Choi, J. H., Barnett, G. A., Danowski, J. A., & Joo, S. (2003). A Structural Analysis of Media Convergence: Cross-Industry Mergers and Acquisitions in the Information
Industries. Journal of Media Economics,16(3), 141-157. doi:10.1207/s15327736me1603_1 Claessens, S., Laeven, L., Igan, D., & Dellariccia, G. (2010). Lessons and Policy Implications
From the Global Financial Crisis. IMF Working Papers,10(44), 1. doi:10.5089/9781451963021.001
Fama, E. F. (1970). Efficient Capital Markets: A Review of Theory and Empirical Work. The
Journal of Finance,25(2), 383. doi:10.2307/2325486
Ferrero, I., Izquierdo, M. Á, & Torres, M. J. (2013). Integrating Sustainability into Corporate Governance: An Empirical Study on Board Diversity. Corporate Social Responsibility and
26
Guiso, L., Sapienza, P., & Zingales, L. (2013). Time Varying Risk Aversion. doi:10.3386/w19284
Hofstede, G. (1984). Cultural dimensions in management and planning. Asia Pacific Journal of
Management,1(2), 81-99. doi:10.1007/bf01733682
Kim, Y. (2005). Board Network Characteristics and Firm Performance in Korea. Corporate
Governance: An International Review,13(6), 800-808. doi:10.1111/j.1467-8683.2005.00471.x
L. A. A. Van Den Berghe, & Levrau, A. (2004). Evaluating Boards of Directors: What constitutes a good corporate board? Corporate Governance,12(4), 461-478.
doi:10.1111/j.1467-8683.2004.00387.x
Marimuthu, M., & Kolandaisamy, I. (2009). Ethnic and Gender Diversity in Boards of Directors and Their Relevance to Financial Performance of Malaysian Companies. Journal of
Sustainable Development,2(3). doi:10.5539/jsd.v2n3p139
Marimuthu, M., & Kolandaisamy, I. (2009). Ethnic and Gender Diversity in Boards of Directors and Their Relevance to Financial Performance of Malaysian Companies. Journal of
Sustainable Development,2(3). doi:10.5539/jsd.v2n3p139
Masulis, R. W., Wang, C., & Xie, F. (2005). Corporate Governance and Acquirer Returns. SSRN
Electronic Journal. doi:10.2139/ssrn.697501
Moeller, S., Schlingemann, F., & Stulz, R. (2004). Wealth Destruction on a Massive Scale? A Study of Acquiring-Firm Returns in the Recent Merger Wave. doi:10.3386/w10200
MSCI. (2018) Global Industry Classification Standard (CIGS) Sector Definitions. [online] Available at: http://www.msci.com/products/indices/sector/gics/ (accessed: March, 2018) Murphy, S. A., & Mcintyre, M. L. (2007). Board of director performance: A group dynamics
perspective. Corporate Governance: The International Journal of Business in Society,7(2), 209-224. doi:10.1108/14720700710739831
Nicolò, G. D., Laeven, L., & Ueda, K. (2008). Corporate governance quality: Trends and real effects. Journal of Financial Intermediation,17(2), 198-228. doi:10.1016/j.jfi.2007.10.002
27
Phan, H. (Spring, 2016) Board of Director Education and Firm Performance: A Dynamic Approach. Master’s Thesis: Aalto University School of Business
Qiu, Buhui and Trapkov, Svetoslav and Yakoub, Fadi, Do Target CEOs Trade Premiums for Personal Benefits? (January 14, 2014). Journal of Banking and Finance, 42, 23–41. Ramos, R., Díaz, B., & Olalla, M. (2016). Independent directors, large shareholders and firm
performance: The generational stage of family businesses and the socioemotional wealth approach. Review of Managerial Science,11(1), 157-158. doi:10.1007/s11846-015-0189-1 Samuelson, P. A., & Meade, J. E. (1965). Efficiency, Equality and the Ownership of
Property. The Economic Journal,75(300), 804. doi:10.2307/2229679
SDC Platinum. (2018) SDC Platinum. Thomson Reuters. [Online]. Available at: Subscription Service (Accessed: February, 2018)
Shi, W., Hoskisson, R. E., Zhang, Y. A. 2016. Independent director death and CEO acquisitiveness: Build an empire or pursue a quiet life? Strategic Management Journal. doi:10.1002/smj.2514
Wang, Z., & Zhang, Q. (2014). Fundamental factors in the housing markets of China. Journal of
Appendix A
Correlation Matrix
EnterpriseValueD
eal EquityValueDeal AvgTimeOth MaleRatio NationalityRatio NetworkSize NumberDire TimeBrd TimeInCo TimeRetire TimeRole TotCurrNoL TotCurrNoU TotNoLstdB TotNoUnLst EnterpriseValueDeal 1.000 EquityValueDeal 0.025 1.000 (0.280) AvgTimeOth -0.025 0.146* * * 1.000 (0.275) (0.000) MaleRatio 0.007 -0.129* * * -0.153* * * 1.000 (0.770) (0.000) (0.000) NationalityRatio -0.033 0.066* * 0.100* * * -0.034 1.000 (0.160) (0.005) (0.000) (0.138) NetworkSize -0.056* 0.215* * * 0.321* * * -0.325* * * 0.194* * * 1.000 (0.015) (0.000) (0.000) (0.000) (0.000) NumberDire 0.007 0.163* * * 0.116* * * -0.255* * * -0.001 0.157* * * 1.000 (0.749) (0.000) (0.000) (0.000) (0.955) (0.000) TimeBrd 0.041 -0.048* 0.078* * * 0.009 -0.115* * * -0.063* * 0.102* * * 1.000 (0.079) (0.037) (0.001) (0.683) (0.000) (0.006) (0.000) TimeInCo 0.029 -0.027 0.099* * * -0.024 -0.106* * * -0.002 0.120* * * 0.961* * * 1.000 (0.205) (0.239) (0.000) (0.300) (0.000) (0.927) (0.000) (0.000) TimeRetire -0.044 -0.062* * -0.318* * * 0.066* * 0.051* 0.043 -0.163* * * -0.389* * * -0.374* * * 1.000 (0.060) (0.007) (0.000) (0.005) (0.028) (0.065) (0.000) (0.000) (0.000) TimeRole 0.037 -0.040 0.081* * * -0.003 -0.115* * * -0.064* * 0.149* * * 0.912* * * 0.867* * * -0.381* * * 1.000 (0.107) (0.089) (0.001) (0.881) (0.000) (0.006) (0.000) (0.000) (0.000) (0.000) TotCurrNoL 0.003 0.044 0.224* * * -0.100* * * 0.089* * * 0.165* * * 0.009 -0.081* * * -0.070* * -0.003 -0.059* 1.000 (0.904) (0.060) (0.000) (0.000) (0.000) (0.000) (0.709) (0.001) (0.002) (0.898) (0.011) TotCurrNoU -0.030 0.000 0.048* 0.067* * 0.129* * * 0.082* * * -0.132* * * -0.080* * * -0.092* * * 0.190* * * -0.055* 0.093* * * 1.000 (0.197) (0.990) (0.039) (0.004) (0.000) (0.000) (0.000) (0.001) (0.000) (0.000) (0.017) (0.000) TotNoLstdB -0.015 0.114* * * 0.360* * * -0.146* * * 0.192* * * 0.354* * * -0.006 -0.114* * * -0.103* * * -0.066* * -0.096* * * 0.902* * * 0.149* * * 1.000 (0.520) (0.000) (0.000) (0.000) (0.000) (0.000) (0.786) (0.000) (0.000) (0.004) (0.000) (0.000) (0.000) TotNoUnLst -0.042 0.015 0.163* * * 0.088* * * 0.212* * * 0.147* * * -0.134* * * -0.135* * * -0.158* * * 0.131* * * -0.126* * * 0.153* * * 0.630* * * 0.337* * * 1.000 (0.070) (0.524) (0.000) (0.000) (0.000) (0.000) (0.000) (0.000) (0.000) (0.000) (0.000) (0.000) (0.000) (0.000)
Table 6: Summary Statistics. This table reports the correlations of the summary characteristics of the analyzed data. The data regards North-American data and ranges from 2000 to 2016. EnterpriseValueDeal is the multiplication of target actual shares outstanding by the offer price in addition to the cost to acquire convertible securities, short-term debt, straight debt, and preferred equity minus cash and marketable securities, stated in millions. EquityValueDeal is the multiplication of the target actual shares outstanding by the offer price. The MaleRatio indicates the proportion of male directors. The NationalityRatio indicates the proportion of directors from different countries observed versus the biggest nationality group in a board. NumberDire shows the amount of directors in a board. The remaining characteristics are all calculated based upon the mean. Networksize is the network of a director (employment, other activities and education overlap). TimeBrd is the time the director has been sitting on the board. TimeInCo is the time the director has been in the company. TimeRetire is the assumed retiremed age of 70 minus the age of the director. TimeRole is the time the director has been performing their current role. AvgTimeOth is the average time a director has been on boards. TotCurrNoL is the amount of listed boards the director is currently in. TotCurrNoU is the amount of unlisted boards the director is currently in. TotNoLstdB is the amount of listed boards the director sat on in total. TotNoUnLst is the amount of unlisted boards the director sat on in total.
Appendix B
Figure 3: Frequency of acquisitions per year of the analyzed sample.
Figure 4: Total equity value of all acquisitions combined per year of the analyzed sample.