Evaluation and Parametric Optimization of the Heating Load and
Comfort Conditions in a School Building
Ricardo Almeida, M.Sc. 1
Vasco Peixoto de Freitas, Professor 2
1
Escola Superior de Tecnologia e Gestão de Viseu, Civil Engineering Department, Viseu, Portugal 2
University of Porto, Faculty of Engineering, Civil Engineering Department, Laboratory of Building Physics, Porto, Portugal
KEYWORDS: Building simulation, energy efficiency, thermal comfort, artificial neural networks SUMMARY:
This paper presents a study on the performance of a school building and on how to improve it. For that five construction elements properties were analysed: the heat transfer coefficient of external walls, roof, and windows, the total solar energy transmittance of windows and the air change rate. The school building behaviour was evaluated by means of two performance functions, one related with the annual heating load and the other with the thermal discomfort due to overheating. Since the calculation of these functions involves the annual simulation of the buildings, and this is a very time consuming procedure, it is almost impossible to perform this type of study on a direct manner. To overlap this issue, Artificial Neural Networks were trained and then used to approximate the functions.
1.
Introduction
An education of excellence is today, a clear aim of any modern society. Several international studies have been carried to evaluate the student’s performance and the factors that most influence it, including the quality of the environment inside the classroom. This issue has gained particular importance in recent years and has been studied by several researchers (Mendell & Heath, 2005). School buildings have some singularities that difference them from others mainly linked with its profile of occupation, the occupancy can be up to four times more than in a typical office building and the occupants of school buildings tend to spend a large amount of their time inside the classroom, only exceeded by the time they spend in their homes (EPA, 1995).
Several countries, including Portugal, are undertaking a large campaign for school buildings retrofit. It is an exceptional opportunity, not only to increase the energy efficiency of the buildings, but also to improve the indoor learning environment in terms of thermal comfort and indoor air quality. These interventions must be prepared carefully and the technical decisions must be scientifically supported to guarantee the sustainability of buildings, often neglected during the design process. To technically support this decisions the Laboratory of Building Physics (LFC) of Faculty of Engineering of University of Porto (FEUP) is conducting a research project in order to achieve a methodology for optimization of constructive solutions. This paper presents the first results of this study.
The rehabilitation of a school building should be a process of combining a number of variables in the search for an "optimum solution". These variables include the energy efficiency, indoor environmental quality, costs (initial, operational and maintenance) and durability of the solutions adopted (Almeida & Freitas, 2010). So, the search for the best constructive solutions is a multi-objective optimization problem with conflicting objectives, since it seeks to ensure adequate conditions of comfort and indoor air quality, minimizing the energy use and the costs.
To properly evaluate the effect of a particular constructive solution in the building performance it is required the use of specific building simulation software such as EnergyPlus, TRANSYS, ESP-r... However, when simulating complex models over extended periods this procedure becomes very time consuming and computationally demanding. In the problem under study the objective is to evaluate and minimize the annual heating load while guaranteeing a good thermal comfort performance, thus the direct optimization process is almost impractical due to the number of simulations required. Several researchers proposed alternatives to overcome this difficulty using statistical methods such as time-series, Fourier series, regression models and Artificial Neural Networks (ANN). Statistical methods are prediction models that use functions to approximate the solutions and can be used both in continuum and discrete problems. For this research ANN were chosen for the calculation of the functions that characterize the buildings performance, making the process of evaluation and optimization of the constructive solutions much simpler and faster. ANN models are based on the central nervous system of the human brain. It is a network of interconnected neurons that have the capacity of self-learning, when properly trained, and from that can respond to stimulus (inputs). ANN are already programmed in a Matlab Toolbox, making it easy to use, and they tend to perform better than other statistical methods in this type of functions (Kawashima, et al., 1995).
In this research initially it was evaluated the current performance of a school building, considering three locations and different orientations. In the second part of the work was assessed the impact of varying the most relevant construction properties in the performance of the building. From there it was possible to accomplish a parametric optimization of the retrofit measures. The next step in this research will include the cost of the retrofit measures in a multi-objective optimization.
2.
Methodology
2.1 Model
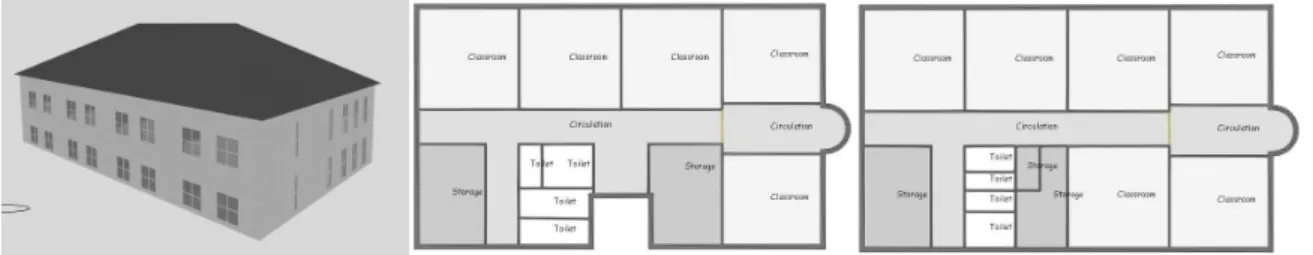
The school under study was build on the 90’s and has no insulation in the exterior walls and roof, the windows have single glass, there are no heating systems and the ventilation is natural, achieved from the window opening and infiltrations. The software chosen for the simulations was EnergyPlus with the model being created with DesignBuilder. Four types of zones were considered in the model, each with specific metabolic rates, occupation density and schedule: classroom, circulation, storage and toilet. For the classrooms zone was defined a metabolic rate of 94 W/person with an occupation density of 0.40 persons/m2. Figure 1 illustrates the geometry of the building and the zones considered. The simulations were performed on an annual base with hourly outputs and 10 time steps per hour. It was considered a summer holiday period of two months, July and August, and a two weeks break in Christmas.
FIG 1. School building model: tri-dimensional overview; ground floor; first floor
The values considered in the simulation for the most relevant construction elements properties, which are also the variables to optimize, are summarized in Table 1. These values were defined after a complete survey carried by the LFC in 20 school buildings. The air change rate value results from a complete experimental survey to assess the ventilation conditions of these classrooms. These measurements were performed by means of the tracer gas method and the decay technique,
considering different envelope conditions. The computer model was validated with in situ measurements, as stated in Almeida and Freitas (2010).
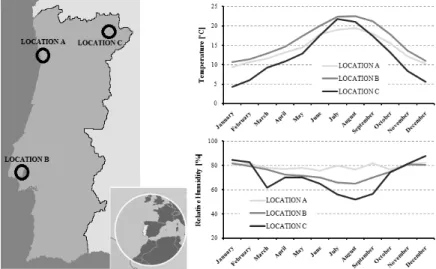
The school building performance was modeled and simulated in three locations, A, B and C, each with a weather that is considered characteristic of its region and that together represent the different climatic conditions in Portugal. Figure 2 shows the monthly average values of air temperature and relative humidity of those locations and its relative position in the country.
FIG 2. Weather data and location of the cities under study
2.2 Variables and performance functions
The properties under study and that constitute the variables to optimize represent typical measures in school buildings retrofit. These variables are the heat transfer coefficient of external walls (Uwall), roof (Uroof), and windows (Uwindow), the total solar energy transmittance of windows (Gwindow) and the air change rate (ACR). For each, it was considered a range of variation with the maximum and minimum values presented in Table 1. Note that the minimum value considered for the ACR, despite being far from guaranteeing a minimum indoor air quality, was considered given the current conditions of the building. The maximum values for the exterior walls, roof and windows were selected from the limits in the Portuguese regulations.
TABLE 1. Construction elements properties
Uwalls [W/(m2.K)] Uroof [W/(m2.K)] Uwindow [W/(m2.K)] Gwindow [-] ACR [h-1] Actual 0,96 2,51 6,10 0,81 0,25 Maximum 1,80 3,00 6,10 0,90 5,00 Minimum 0,25 0,25 1,00 0,20 0,10
Two performance functions were created to evaluate the building, the first is the annual heating load, defined as the necessary energy to guarantee a minimum temperature of 20ºC inside the classrooms during the period of occupation, and the second function intends to assess the discomfort in the classrooms due to overheating. These functions were computed for the ground floor and for the first floor separately, in order to better understand the differences inside the school. They depend on the five variables stated and were computed on an annual base, as defined in Equations (1) and (2).
(
)
T C S L H ACR G U U Uf wall roof window window year 20º
. . , , , , int 1 = ∧ ≥
∑
(1)(
)
(
)
C T S T ACR G U U Uf wall roof window window year 25º
25 , , , , int int 2 ∧ > − =
∑
(2)Where H.L. hourly heating load (kWh)
S net floor area of the building (m2)
Tint hourly average interior temperature (ºC)
The effect of different orientation of the building was also assessed. The orientation was defined in relation to the façade where are the highest number of classrooms (Figure 1).
2.3 Artificial Neural Networks
The calculation of the performance functions implies an annual simulation of the building. Since these simulations are time consuming and an optimization procedure requires numerous, it was decided to use ANN to predict the value of the functions. The ANN must be properly trained in order to have an adequate performance. For this study 1920 annual simulations of the building were carried with different values of the five input variables (160 for each location and for each orientation). The 160 cases were defined using the Latin Hypercube Sampling method to guarantee an effective distribution in the variables space. For each annual simulation the performance functions were automatically computed by means of a computer program in Visual Basic created for the effect, and then used to train and test the ANN. In the end 150 cases served to train the networks and the other 10 were applied in testing and validating. A total of 48 ANN were created has described in Figure 3.
LOCATION ORIENTATION FLOOR FUNCTION
A B C NORTH EAST SOUTH WEST GROUND FLOOR FIRST FLOOR f1 f2
FIG 3. Combinations for the ANN
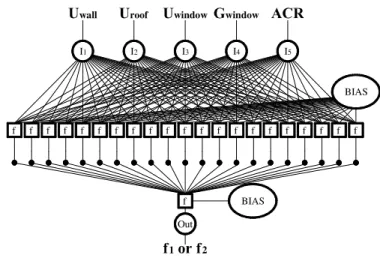
The architecture of the networks were of the multilayer feedforward type with backpropagation, 20 neurons, 5 inputs and 1 output, as schematically described in Figure 4. The chosen training algorithm was the Levenberg-Marquardt with Bayesian regulation.
wall Out 1 2 I1 BIAS f f
roof window window
I2 I3 I4 I5
f f f f f f f f f f f f f f f f f f f f
BIAS
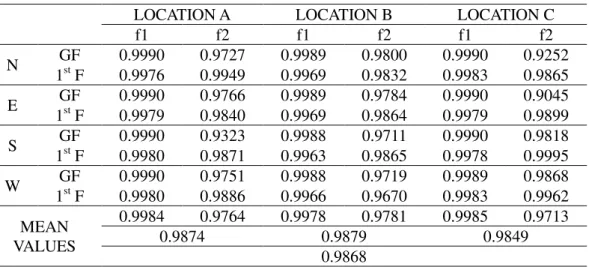
The 48 ANN were tested and validated with 10 cases and for each was computed the value of R2, with Equation (3), to evaluate its accuracy in predicting the functions. Table 2 shows the results obtained for R2. An overall mean value of 0.9868 for the R2 was achieved which is very satisfactory.
(
)
(
)
∑
∑
= =−
−
−
=
10 1 2 10 1 2 21
i i i i iy
y
p
y
R
(3)Where R2 coefficient of determination
yi exact value of the function computed from the simulation results
pi predicted value of the function with the ANN
y mean value of the yi
TABLE 2. R2 for validation of the ANN
LOCATION A LOCATION B LOCATION C
f1 f2 f1 f2 f1 f2 N GF 0.9990 0.9727 0.9989 0.9800 0.9990 0.9252 1st F 0.9976 0.9949 0.9969 0.9832 0.9983 0.9865 E GF 0.9990 0.9766 0.9989 0.9784 0.9990 0.9045 1st F 0.9979 0.9840 0.9969 0.9864 0.9979 0.9899 S GF 0.9990 0.9323 0.9988 0.9711 0.9990 0.9818 1st F 0.9980 0.9871 0.9963 0.9865 0.9978 0.9995 W GF 0.9990 0.9751 0.9988 0.9719 0.9989 0.9868 1st F 0.9980 0.9886 0.9966 0.9670 0.9983 0.9962 MEAN VALUES 0.9984 0.9764 0.9978 0.9781 0.9985 0.9713 0.9874 0.9879 0.9849 0.9868
3.
Results
Two types of analyses were performed. First it was evaluated the behaviour of the school building in the three locations and for different orientations. Secondly it was studied the effect of changing each of the five variables on the performance functions. The parametric results highlighted the most efficient retrofit measures for the minimization of the heating load and thermal discomfort due to overheating.
3.1 Evaluation of the school building performance
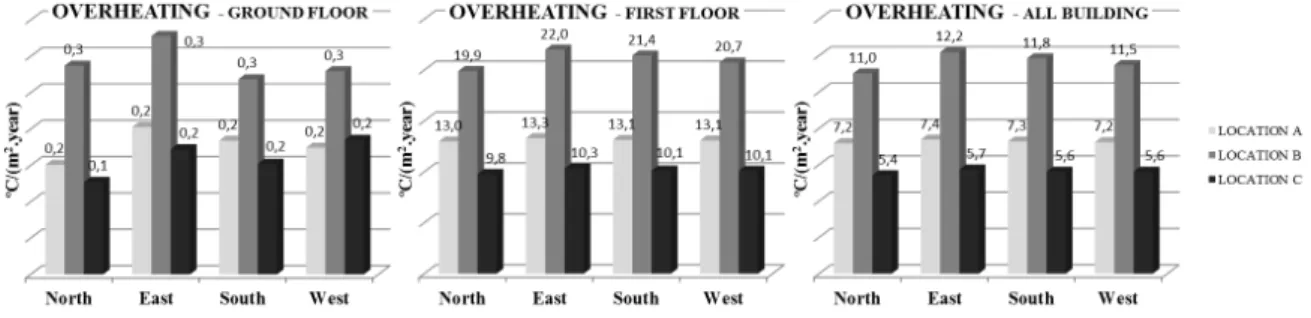
The results for the two performance functions are presented in Figure 5, for the ground floor, first floor and all building, for the three locations and different orientations.
FIG 5. Evaluation of the actual performance of the school building
3.2 Parametric optimization
The results of the evaluation of the actual conditions of the school building, presented in the previous point, demonstrated that the orientation of the building is responsible for some differences in the values of the performance functions. Even though for the parametric optimization the relative
importance of the orientation should be comparable, consequently it is expected that similar results to the ones presented here would be obtained for the other orientations. The following results were for the North orientation.
The parametric optimization consisted in computing the value of the performance functions for the range of variation of the variables. This way it was evaluated the impact of that change in the
performance of the whole building. To better assess this effect it was chosen to compute the values as a relative variation of the function in order to the actual value. Positive variations correspond to an improvement on the performance of the building. The results are presented in the following Figures.
FIG 6. Effect of varying the thermal coefficient of the external walls
10 0 -20 -10 -10 -10 0 0 1 1.5 2 2.5 3 3.5 4 4.5 5 5.5 6 Uwindow [W/(m2.K)] LOCATION B 0.2 0.4 0.6 0.8 G w in d o w
FIG 8. Effect of varying window properties: thermal coefficient and total solar energy transmittance
FIG 9. Effect of varying the air change rate
4.
Discussion
The use of statistical methods such as ANN to estimate the value of predefined performance
functions, which are dependent of complex simulation models, was implemented in this research. For this study each of the 48 ANN created was tested with 10 cases and validated by computing the respective R2. It was observed that the approximation to the performance function associated with the overheating discomfort although being quite good is more inaccurate than the function related to the annual heating load. The precision of the approximations is independent of the location considered. Overall the mean value of R2 was 0.9868, which indicates a good accuracy of the ANN.
After properly trained, the ANN were used to evaluate the behaviour of the school building under study by computing the value of the two performance functions individually for each floor and for the entire building. It was also assessed the impact of building orientation in its performance.
The results show that the heating load in the first floor is higher than in the ground floor indicating that the heat losses through the roof are very significant. So, the insulation of the roof should be an effective measure to improve the energy efficiency of this building. The overheating discomfort is irrelevant on the ground floor. Only the classrooms of the first floor have overheating problems. The differences observed in the performance of the building due to changes in the orientation are rather significant. For the all building performance the mean difference, in the three locations, for the heating load was 9.5% and for the overheating discomfort 6.4%. As it would be expected, the
situation that requires less energy for heating is with the higher number of classrooms facing south but for minimizing the overheating discomfort the ideal orientation would be north.
The last part of this study intended to assess the more effective measures in the building envelope in order to improve its performance. It was observed that varying the insulation of the roof could decrease the heating load from 73%, in location B, to 50%, in location C, and that in locations A and C this change also improve the summer comfort conditions of the building.
The wall insulation could guarantee a reduction of up to 45% in the heating load but will be responsible for a decrease in the summer comfort conditions.
The changes in windows are the most ineffective ones, although being possible to achieve a reduction of up to 30% in the heating load but the overheating problem will be amplified.
A value of 4.0 h-1 in the ACR, minimum necessary according to the Portuguese legislation, implies an increase on the heating load that goes from 310%, in location C, to 640%, in location B. Nevertheless the same change would decrease the overheating problem in 48%, in location B, and 80%, in location A.
5.
Conclusions and future work
From the research it was possible to conclude the following:
- Annual building simulation of complex models is a very time consuming procedure but necessary to understand the overall performance of the buildings.
- ANN are a good instrument to estimate complex functions and can be used to substitute computer simulations, even though they require a significant amount of input data for training in order to achieve accurate approximations.
- The orientation of the building is responsible for significant changes in its performance. - The most effective retrofit measure to decrease the heating load is the roof insulation. - The ACR is the most important variable in the performance of the building.
This research project intends to continue the optimization of the constructive solutions including its economic cost and the next step will be the use of evolutionary algorithms to perform a real multi-objective optimization.
6.
Acknowledgements
The authors would like to thank the FCT – Fundação para a Ciência e Tecnologia for their support to this project.
References
Almeida, R. & Freitas, V.P., 2010. Hygrothermal Performance of Portuguese Classrooms:
measurement and computer simulation. In: Proceedings of 1st Central European Symposium on
Building Physics. Cracow, Poland 13-15 September 2010.
EPA - U. S. Environmental Protection Agency, 1995. Indoor Air Quality Tools for Schools, IAQ
Coordinator’s Guide, EPA 402-K-95-001, Washington, D.C..
Kawashima, M., Dorgan, C.E. & Mitchell, J., 1995. Hourly Thermal Load Prediction for the Next 24 Hours by ARIMA, EWMA, LR, and an ANN. ASHRAE Transactions, 101 (1), pp.186-200. Mendell, M. & Heath, G.A., 2005. , Do indoor pollutants and thermal conditions in schools influence
student performance? A critical review of the literature. Indoor Air – International Journal of