i
SPATIOTEMPORAL ANALYSIS OF FOREST FIRE RISK
MODELS: A CASE STUDY FOR A GREEK ISLAND
ii
SPATIOTEMPORAL ANALYSIS OF FOREST FIRE RISK
MODELS: A CASE STUDY FOR A GREEK ISLAND
Dissertation supervised by
PhD Pedro da Costa Brito Cabral
Assistant Professor, Instituto Superior de Estatística e Gestão de Informação (ISEGI)
Universidade Nova de Lisboa (UNL), Lisbon, Portugal
Dissertation co-supervised by
PhD Mário Silvio Rochinha de Andrade Caetano
Associate Professor, Instituto Superior de Estatística e Gestão de Informação (ISEGI)
Universidade Nova de Lisboa (UNL), Lisbon, Portugal
Dissertation co-supervised by
PhD Filiberto Pla
Professor, Institute of New Imaging Technologies (INIT)
Universitat Jaume I (UJI), Castellón, Spain
iii
ACKNOWLEDGMENTS
Initially, I would like to thank the European Commission and the Consortium [1)
Universidade Nova de Lisboa, NOVA - Information Management School, Lisboa,
Portugal;
2)
Westfälische
Wilhelms-Universität
Münster,
Institute
for
Geoinformatics, Münster, Germany; 3) Universitat Jaume I, Castellón, Dept.
Lenguajes y Sistemas Informaticos, Castellón, Spain] for awarding me the Erasmus
Mundus scholarship.
I would like to express my gratitude to my supervisor Pedro da Costa Brito Cabral
for his recommendations, corrections and the continuing guidance for the
improvement and smooth completion of the thesis. In addition, I would like to thank
my co-supervisors, namely, Mário Silvio Rochinha de Andrade Caetano and
Filiberto Pla, for their valuable comments and suggestions and their contribution to
my thesis.
In addition, many thanks to Marco Octávio Trindade Painho for the collaboration
and his thoughtful suggestions during this Master program.
In the same context, I would like to thank all the staff of the Consortium and my
fellows for this wonderful experience.
Furthermore, I would like to thank my daughter Ekaterini-Barbara; my wife
Paraskevi; my parents, Panagiotis and Ekaterini; my brother Spyridon; my sister
Vasiliki; father Ioannis and all my relatives and friends from Greece for their
continuing support.
Most importantly, I am too grateful to Jesus Christ who supported me with any
means all these years to successfully complete the thesis and the entire Master
program.
iv
SPATIOTEMPORAL ANALYSIS OF FOREST FIRE RISK MODELS: A CASE
STUDY FOR A GREEK ISLAND
ABSTRACT
Forest fires are a natural phenomenon which might have severe implications on
natural and anthropogenic ecosystems. Consequently, the integrated protection of
these ecosystems from forest fires is of high priority. The aim of the project lies in
the development of two preventive models which will act in synergy in order to
effectively protect the most critical natural resource of the island, namely, the
abundant forests. Thus, fire risk modeling is combined with visibility analysis, so
that we may primarily protect the most susceptible territory of the study area. The
corner stone of the methodology is primarily relied on the multi-criteria decision
analysis. This framework applied not only for the fire risk estimation and the
corresponding evolution in a context of 20 years, but for visibility analysis as well,
determining the most suitable locations for the establishment of a minimum number
of watchtowers. The fire risk map for 2016 indicated that 34% of the entire study
area is covered by territory of low fire risk; 27% of moderate risk; 34% of high and
very high risk, while there is a 6% of the island which is characterized by extremely
fire risk. Similar conclusions can be drawn for 1996, since no significant changes
have been observed, especially on the land cover types and their spatial arrangement.
Based on the visibility results, more than 40% of the entire island is visible from the
selected location scheme consisting of just 8 watchtowers. The intense topography
constituted the most critical barrier in increasing this percentage. Some good
practices to counterbalance the relative small percentage of visibility could include;
the extensive patrols in unmonitored regions through the intense road network of the
island; the adoption of drones covering the aforementioned areas, especially when
extreme meteorological conditions are expected.
v
KEYWORDS
Forest fires
Multi criteria analysis
Fire risk
Spatiotemporal analysis
Visibility
Geographical Information Systems
Remote Sensing
Skiathos island
Greece
vi
ACRONYMS
AHP – Analytic Hierarchy Process
AUC – Area Under Curve
CLC – Corine Land Cover
DEM – Digital Elevation Model
DRGI – Dynamic Relative Greenness Index
GIS – Geographical Information Systems
GPS – Global Positioning System
IRS – Indian Remote Sensing
MCDA – Multi-Criteria Decision Analysis
MODIS – Moderate Resolution Imaging Spectroradiometer
NDVI – Normalized Difference Vegetation Index
NDMI – Normalized Difference Moisture Index
NIR – Near Infrared
NOOA – National Oceanic and Atmospheric Administration
SWIR – Shortwave Infrared
vii
INDEX OF THE TEXT
Pag.
ACKNOWLEDGMENTS ... iii
ABSTRACT ... iv
KEYWORDS ... v
ACRONYMS ... vi
INDEX OF TABLES ... ix
INDEX OF FIGURES ... x
1. INTRODUCTION ... 1
1.1 Motivation and rationale ... 1
1.2 Aim and specific objectives ... 1
2. THEORETICAL FRAMEWORK ... 3
2.1 GIS-based multi criteria decision analysis ... 3
2.2 Fire risk analysis ... 5
2.3 Visibility analysis ... 10
2.3.1 Visibility analysis in forest fires ... 11
3. Materials and Methods ... 13
3.1 Geographical location ... 13
3.2 Data ... 14
3.2.1 Elevation ... 14
3.2.2 Slope ... 15
3.2.3 Aspect ... 16
3.2.4 Climatic characteristics ... 17
3.2.5 NDVI 1990, 2016 ... 19
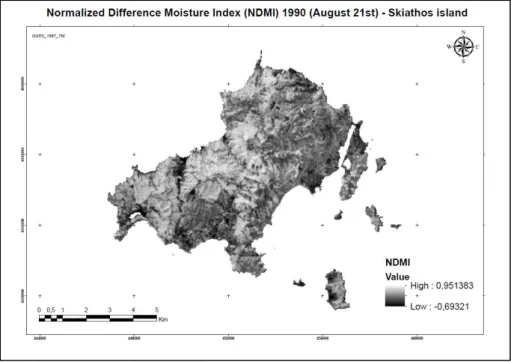
3.2.6 NDMI 1990, 2016 ... 24
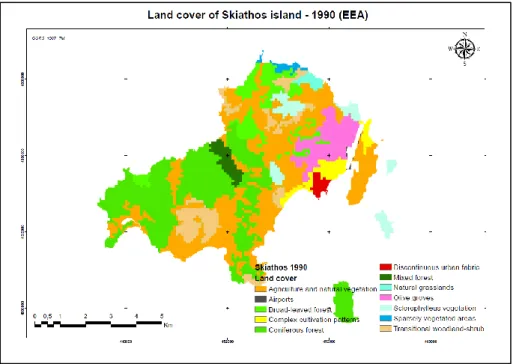
3.2.7 Land cover/use 1990, 2012 ... 25
3.2.8 Road network 1996, 2016 ... 29
3.2.9 Fire history ... 31
3.3 Methodology ... 32
3.3.1 Fire risk modelling ... 32
viii
4. RESULTS AND DISCUSSION ... 41
4.1 Fire risk modelling ... 41
4.1.1 Interrelation of fire risk and key factors - 2016 ... 41
4.1.2 Fire risk modeling – Development of the fire risk map for 2016 ... 49
4.1.3 Interrelation of fire risk and key factors – 1990/1996 ... 50
4.1.4 Fire risk modeling – Development of the fire risk map for 1996 ... 55
4.1.5 Spatiotemporal evolution of fire risk maps ... 57
4.2 Visibility analysis – Watchtowers establishment as a preventative measure .. 58
4.3 Limitations and future perspectives ... 62
5. CONCLUSIONS ... 64
ix
INDEX OF TABLES
Table 3.1. Elevation zones ... 14
Table 3.2. Temperature and humidity indices ... 18
Table 3.3. Precipitation and wind characteristics indices ... 19
Table 3.4. Area per NDVI interval (2016) ... 21
Table 3.5. Area per NDVI interval (1990) ... 24
Table 3.6. Area per land cover type (1990)... 26
Table 3.7. Area per land cover type (2012)... 27
Table 3.8. Per cent change of area per land cover type (1990 - 2012) ... 28
Table 3.9. Area per road network type (1996) ... 29
Table 3.10. Area per road network type (2016) ... 30
Table 3.11. Area burned per land cover type ... 31
Table 3.12. Knowledge-based ranking of the key factors to fire risk ... 34
Table 3.13. Appropriate criteria for the location of candidate watchtowers ... 38
Table 4.1. Area per elevation zone and the respective fire risk ... 42
Table 4.2. Area per slope level and the respective fire risk ... 43
Table 4.3. Area per aspect level and the respective fire risk ... 43
Table 4.4. Area per land cover type and the respective fire risk ... 45
Table 4.5. Area per NDVI interval and the respective fire risk ... 46
Table 4.6. Area per NDMI interval and the respective fire risk ... 47
Table 4.7. Area per road network buffer zone and the respective fire risk ... 48
Table 4.8. Area per artificial structure buffer zone and the respective fire risk ... .49
Table 4.9. Area per fire risk level ... 50
Table 4.10. Area per land cover type and the respective fire risk (1996) ... 51
Table 4.11. Area per NDVI interval and the respective fire risk (1996) ... 52
Table 4.12. Area per NDMI interval and the respective fire risk (1996) ... 53
Table 4.13. Area per road network buffer zone and the respective fire risk (1996) ... 54
Table 4.14. Area per artificial structure buffer zone and the respective fire risk (1996) ... 55
Table 4.15. Area per fire risk level (1996) ... 56
Table 4.16. Visibility analysis of the best candidate locations ... 60
x
INDEX OF FIGURES
Figure 3.1. Geographical location of Skiathos in a nationwide and worldwide perspective
... 13
Figure 3.2. Digital Elevation Model of Skiathos ... 14
Figure 3.3. Elevation levels of Skiathos ... 15
Graph 3.1. Slope levels ... 16
Figure 3.4. Slope levels of Skiathos ... 16
Graph 3.2. Aspect levels ... 17
Figure 3.5. Aspect levels of Skiathos ... 17
Figure 3.3. Mean temperature vs precipitation in Skiathos ... 19
Figure 3.6. NDVI of Skiathos (2016) ... 20
Figure 3.7. Reclassified NDVI of Skiathos (2016) ... 21
Figure 3.8. NDVI of Skiathos (1990) ... 23
Figure 3.9. Reclassified NDVI of Skiathos (1990) ... 23
Figure 3.10. Reclassified NDMI of Skiathos (2016) ... 24
Figure 3.11. NDMI of Skiathos (1990) ... 25
Figure 3.12. Land cover types of Skiathos (1990) ... 27
Figure 3.13. Land cover types of Skiathos (2012) ... 28
Figure 3.14. Road network of Skiathos (1996) ... 30
Figure 3.15. Road network of Skiathos (2016) ... 31
Graph 3.4. Flowchart of fire risk modeling (1996 - 2016) ... 39
Graph 3.5. Flowchart of visibility analysis ... 40
Figure 4.1. Interrelation of fire risk and altitude ... 41
Figure 4.2. Interrelation of fire risk and slope... 42
Figure 4.3. Interrelation of fire risk and aspect ... 43
Figure 4.4. Interrelation of fire risk and land cover ... 44
Figure 4.5. Interrelation of fire risk and NDVI ... 45
Figure 4.6. Interrelation of fire risk and NDMI ... 46
Figure 4.7. Interrelation of fire risk and road network proximity ... 47
Figure 4.8. Interrelation of fire risk and artificial structure’s proximity ... 48
Figure 4.9. Fire risk for the island of Skiathos (2016) ... 50
Figure 4.10. Interrelation of fire risk and land cover (1996) ... 51
Figure 4.11. Interrelation of fire risk and NDVI (1996) ... 52
xi
Figure 4.13. Interrelation of fire risk and road network proximity (1996) ... 54
Figure 4.14. Interrelation of fire risk and artificial structure’s proximity (1996) ... 55
Figure 4.15. Fire risk for the island of Skiathos (1996) ... 56
Figure 4.16. Percentage change of fire risk from 1996 to 2016 ... 57
Figure 4.17. Fire risk levels changed from 1996 to 2016 ... 58
Figure 4.18. Candidate locations across the entire study area (200 meters distance between
each other) ... .59
Figure 4.19. Cumulative ranking of suitability for watchtowers location ... .59
Figure 4.20. Selection of the most appropriate (efficient) locations ... 60
1
1. INTRODUCTION
1.1 Motivation and rationale
Forest fires are a natural phenomenon which might have severe implications on natural and anthropogenic ecosystems. The Mediterranean countries face such events almost every year. Indicatively, representative fire statistics highlight the significance of the phenomenon in one of them, namely, in Greece. For instance, 1.613 forest fires incidents have been recorded in Greece burning 29,144 ha of forest lands in just one year (2011). Cumulatively, in a timeframe of fifteen years (1983-2008), 1.361.312 ha of forest area has been affected by fires. The annual values reached 1.465 fire hotspots, leading to 52.358 ha of burned area (Tsagari et al. 2011). Translating the impacts of one of the most damaging fire incidents in the history of Greece in 2007 to quantitative terms, we observed that more than half a million people were affected, while the financial cost of these damages reached approximately three billion Euro (Mitsakis et al. 2014).
Islands can be considered quite susceptible environments where any critical change may drastically affect every perspective of this territory, from the natural and cultural environment to socioeconomic life and cohesion. The island of Skiathos in Greece constitutes a unique case due to the fact that it is a highly touristic island and preserves forests and landscapes of extraordinary beauty. Hence, this natural asset must be preserved and protected from one of the most damaging factors, namely, forest fires. Focusing on the main point of fires effects, Sakellariou et al. (2017) cited “destructive and recurrent forest fires (of high intensity) are one of the greatest hazards for the viability and sustainable development of forests, and have impacts on natural and cultural environments, and the economy and the quality of life of local and regional populations”.
Consequently, the integrated protection of the island from natural and anthropogenic factors which might heavily degrade the natural resources of the study area is of high priority. Due to the general difficulty to suppress effectively a destructive forest fire, special attention will be given to the prevention of such complicated phenomena, before they take enormous dimensions with unpredictable implications (loss of human lives; degradation of natural ecosystems; increased levels of erosion which may lead to flood events; economic loss from tangible and intangible forest products etc.).
1.2 Aim and specific objectives
The aim of the project lies in the development of two preventive models which will act in synergy in order to effectively protect the most critical natural resource of the island, namely, the abundant forests. Thus, fire risk modeling (based on the impact of natural and anthropogenic factors to fire risk) is combined with visibility analysis, so that we may primarily protect the most susceptible territory of the study area.
2
Specific objectives will support the implementation of fire risk modeling and visibility analysis. Specifically, these objectives consist of:
The exploration of individual natural and anthropogenic key factors that may heavily affect the fire risk. More specifically, the exploration of vegetation characteristics to the possible fire behavior (type of forest fuels); the determination of vegetation conditions and ground humidity through estimating the Normalized Difference Vegetation Index (NDVI) and the Normalized Difference Moisture Index respectively; the effect of topography, such as the elevation, slope and aspect, as estimated by the Digital Elevation Model (DEM); and the scalable influence of roads and towns proximity to forests (where most fire incidents take place).
The determination of fire risk for two reference years (1996 and 2016) through multi-criteria analysis in order to detect both the most vulnerable regions of the island and the potential spatiotemporal changes that could be resulted from the distinct effect of any critical factor. This fact will allow us to focus on specific prevention measures based on the influence of each contributing factor.
Final objective constitutes the establishment of optimal locations of watchtowers through visibility analysis. This analysis focuses on the covering of the most vulnerable areas (based on the fire risk map) for immediate detection and suppression of fire events.
Hence, the project is based on two distinct but interrelated pillars. Firstly, multi-criteria analysis takes place exploring the collective contribution of the key factors to fire risk. The final determination of fire risk is a knowledge-based approach integrating the variable influence of each natural and anthropogenic factor, such as: topography, land cover, vegetation indices, proximity to road and human settlements network. This process has been repeated for two reference years (1996, 2016) in order to determine the spatiotemporal evolution of fire risk and the potential causes that may lead to these changes. Afterwards, visibility analysis was combined with the fire risk modeling. Consequently, a second process of multi-criteria analysis was conducted in conjunction with viewshed analysis in order to determine the most appropriate locations for the establishment of watchtowers in terms of surface appropriateness (most susceptible areas, relatively high elevation, avoiding water surfaces etc.) and visibility potential. Thus, a synergistic prevention effect may increase the possibilities of early fire detection, especially on the most vulnerable territories.
3
2. THEORETICAL FRAMEWORK
Fire risk modeling itself constitutes a complex and multifaceted process since natural phenomena are characterized by a high degree of uncertainties. However, the inter-annual cumulative knowledge for the management of forest fires has allowed us to determine some specific aspects in order to deal with this phenomenon as efficiently as possible. To this end, sophisticated technologies have been a powerful tool in assisting rational and effective decision making. Hence, the interplay of key factors have been analyzed with the aid of GIS and remote sensing so that we can estimate the most vulnerable areas and apply appropriate measures such as the establishment of watchtowers. Thus, this chapter explores the GIS-based multi criteria analysis in a broad range of fields, followed by the specification of this methodology to fire risk. Finally, visibility analysis is described, applied to diverse fields, while a few studies focus on forest fires phenomenon.
2.1 GIS-based multi criteria decision analysis
There are many applications in the literature that use specific GIS and other multicriteria decision analysis (MCDA) techniques either for evaluation of land suitability for different reasons (fire risk, landslide vulnerability, land use planning) or for the finding of optimal locations based on the desired purpose (wind farm or industrial units locations).
Van Haaren and Fthenakis (2011) explored the optimal location of a wind farm, based on a specific number of criteria. Those criteria were related to economic (cost related to the acquirement of the supporting land and the road construction); planning (related to visual effect and noise pollution, interference with other critical land uses, e.g. airport etc.); topographical (slope) and ecological (proximity to birds’ habitat etc.) factors. In the same context, Villacreses et al. (2017) and Noorollahi et al. (2016) explored the most appropriate location for establishing a wind farm, relied on many interacting factors such as: wind characteristics; land surface suitability and proximity to road network and other crucial infrastructure.
Chen et al. (2010) implemented suitability analysis for irrigation purposes, relied on the interaction of some certain criteria (hydraulic properties of soil, slope, soil types, etc.). Emphasis was given on the importance of the weighting process and its impact (through sensitivity analysis) on the final results. Yalcin and Gul (2017) took advantage of GIS multi criteria decision framework along with Analytical Hierarchy Process (AHP) in order to discover new potential geothermal hotspots (indicative criteria: closeness to hot springs, extreme differences on land surface temperature etc.).
Hariz et al. (2017) explored the optimal location for a healthcare waste incinerator based on a range of factors. Specifically, they took into consideration economic (e.g. road and electric network accessibility), social (e.g. interaction of urban and rural regions) and environmental criteria (e.g. land use and soil type and characteristics). Hence, they integrated all the above dimensions into a GIS framework in conjunction with other multicriteria analysis techniques (e.g. AHP etc.).
4
On the other hand, Erener et al. (2012) examined the landside vulnerability through a series of cartographic products derived from the comparative assessment of three multicriteria methods, namely, GIS-based multi-criteria decision analysis, logistic regression, and association rule mining. Some of the most contributing factors to landslide susceptibility that were included in the above models are: land use and soil types characteristics, topography, proximity to infrastructure, faults etc. Sánchez-Lozano and Bernal-Conesa (2017) proceeded to effective environmental management of some critical natural regions that belonged to military agency. To this end, they used GIS and other multicriteria decision analysis techniques in order to achieve the best possible results. The effective environmental management may involve specific actions like forest fire protection, rehabilitation of areas suffered from any artificial process, official recording and protection of flora and fauna species, drastically dealing with regions suffered from severe pollution etc. In order to accomplish all the aforementioned objectives, they defined specific criteria such as: proximity to human settlements, road network and agricultural fields; topography (slope); proximity to ecological corridors; proximity to areas subject to severe pollution; desertification hazard etc. Finally, they used two techniques, namely AHP and Technique for Order of Preference by Similarity to Ideal Solution for the final ranking of the involved parameters. The combination of GIS and the other two MCDA techniques provided the hierarchy of areas that are considered of utmost importance for efficient and urgent environmental management.
In addition, Zhang et al. (2012) tried to implement a GIS multicriteria decision framework in order to better manage and solve the contradicting forces in land use planning between different types of land uses and the involved stakeholders.
Finally, such a GIS-based MCDA framework is widely used for finding the best location for industrial units. Rikalovic et al. (2014) implemented that model in order to determine the optimal location of an industrial facility taking into account all the vital economic factors related to this kind of problem. Some of these criteria (either as favorable or limiting factors) included the proximity to road network, the proximity to protected areas; and proximity to water bodies. Definitely, other substantial factors could be included in this model, for instance, monetary value of land, topographic characteristics etc. The integration of all these parameters yielded the best location for this specific industrial unit. Based on the above projects, it should be highlighted the high added value of GIS applied to a totally diverse domains (energy; environmental management; industry etc.), focusing on the interrelation of key factors and finding the most appropriate locations relied on specific objectives as determined in each scientific field. In the next section, the evaluation of forest fires risk modeling under a multicriteria decision framework is discussed in depth through the literature review of projects of similar nature.
5
2.2 Fire risk analysis
A significant aspect of the interplay between GIS and forest fires prevention constitutes the establishment of fire risk maps relied on the local characteristics of the study area.
In this context, Eugenio et al. (2016) estimated the fire risk of a study region in Brazil, not only based on the surface characteristics of the area, but also exploring another contributing factor; namely climatological features. In brief, the model included: i) the exploration of the precipitation influence, mapping this feature relied on the exponential kriging technique; ii) the potential evapotranspiration, water deficit and mean temperature influence, mapping those features based on the spherical kriging technique; iii) the influence of the surface factors such as elevation, slope and aspect derived from the Digital Elevation Model; and the contribution of land uses and road network (due to proximity to forested areas) to forest fires ignition. Finally, applying AHP techniques, specific weights were assigned for each and every variable. Map Algebra tool (integrated into GIS) combined all the above information, so that the final risk map to be created.
Sivrikaya et al. (2014) explored the fire risk potential based on the natural and anthropogenic dimensions. These inputs included: i) the influence of forest features such as the vegetation/fuel types, the crown closure as well as the age characteristics of the species; ii) the effect of geomorphology, such as the slope and aspect of the study area. Both characteristics may intensely contribute to fire propagation, and iii) the influence of human factor (socioeconomic activities; accidents etc.) which can be found on anthropogenic structures, such as the human settlements and the road network. Around these conceivable zones, the majority of fire ignitions take place. The interaction of all the aforementioned factors lead to a united fire risk map taking into advantage the analytical capabilities of GIS.
Amalina et al. (2016) developed a similar susceptibility map combining data and tools of remote sensing and GIS. Specifically, they created several thematic maps, each one representing the contribution of each variable to forest fire ignition and behavior. So, they combined: i) the land uses layer derived from satellite images after the classification through Maximum Likelihood algorithm; ii) vegetation and climatological indices such as the Normalized Difference Vegetation Index (NDVI), the Normalized Difference Moisture Index (NDMI) and the estimation of surface temperature along the study domain (exploiting the remote sensing techniques); iii) and the scalable distance from certain anthropogenic (towns, roads etc.) and natural structures (water surfaces; specific crop cultivations etc.). Next, they evaluated each factor based on their impact to forest fires phenomenon, assigning them with a distinct weight. Finally, they constructed an equation integrating all these factors. The final output was the fire risk map. Here, it should be noted that they assessed the natural and anthropogenic factors interchangeably as a dominant player to forest fires each time (10% vs 90% of contribution). However, there is no any concrete argument to provide a 90% weight to human factor and that is why, they rejected this hypothesis in the end.
6
Kant Sharma et al. (2012) used a similar multicriteria decision analysis framework in order to create the fire risk map. They combined remote sensing and GIS data and techniques, such as forest types characteristics, topography (elevation, slope and aspect) and the proximity zones to human structures. Finally, they integrated all these variables under three distinct techniques, namely, the knowledge-based, the crisp and fuzzy analytical hierarchy process (AHP) in order to cope with the uncertainties inherent into forest fires phenomenon. It should be noted that the last two methods (AHP) provided almost identical results and they were characterized with a certain degree of difference in relation to the first technique.
A comprehensive web-based decision support system for fire prevention exploiting remote sensing and GIS data and methods, was implemented by Roberto Barbosa et al. (2010). First of all, the majority of the data was derived from satellite sources, such as the acquirement of active fire hotspots file; the meteorological data and the corresponding images which were used for land use classification and the development of the Digital Elevation Model. The file with the active hotspots could be depicted immediately with the appropriate process of geocoding. At the same time, spatial interpolation techniques took place for the creation of the respective meteorological thematic maps. Following, they performed supervised classification of the satellite image in order to generate the thematic map of land uses. After that, they reclassified all the involved variables based on their contribution to forest fires ignition and propagation. These factors included: the maximum and minimum temperature; the level of precipitation; the unified layer of wind characteristics (velocity and direction) along with one element of topography (aspect) given that the vector of these three variables may have a significant impact (cumulatively); the maximum and minimum relative humidity; the land use and the slope layers. All the aforementioned factors were evaluated and ranked (knowledge-based) according to their distinct impact to forest fires. Finally, a specific equation integrated all these dimensions, giving an additional external weight to the general contribution of each factor to the under-study phenomenon. Hence, the magnitude of any hotspot could be estimated based on the location on the fire risk map. This process may prioritize and allocate the respective firefighting forces to different events based on the magnitude of the fire.
Vadrevu et al. (2010) developed a fire risk map using multi criteria decision analysis combining the AHP and the Fuzzy Set theory integrated into a GIS environment. Specifically, they created a structure of two kinds of criteria. One more general which included: the geomorphology; the vegetation characteristics; the climatic and socioeconomic/demographic variables. Under these categories, more specific criteria were adopted such as: Geomorphology: elevation, slope, aspect and a composite topographic index related to ground moisture; Vegetation characteristics: dry deciduous species, biomass density and an index which is related to the amount of energy released when the wood is burned; Climatic variables: mean temperature and rainfall in the hottest season and the amount of evapotranspiration; Socioeconomic/demographic variables: population density, literacy rate, number of staff employed on the primary sector of economy (especially agriculture) and nutritional density. All these specific variables were assigned distinct weights based on the fuzzy set
7
theory techniques, while the first level (more general categories) were subjected to AHP technique. Finally, these frameworks were integrated into a GIS environment and through map algebra, the final risk map was created. Here, it should be stressed that for some of these variables (especially the socioeconomic ones, e.g. nutritional density etc.), there is no any concrete theoretical background that explains with safety their inclusion (contribution) to the development of the fire risk map. You et al. (2017) evaluated the forest fire risk in a world heritage site and proceeded to the spatiotemporal analysis of risk in a timeframe of twelve years. They integrated geomorphological (slope, aspect and elevation through the DEM) and meteorological factors (temperature, level of rainfall and evapotranspiration); vegetation features (fuels types and humidity, development stage and canopy density) and human structures (closeness to towns, agricultural roads, water bodies and land uses). They assessed the special weight of all these variables based on AHP technique and developed the final risk map through map algebra which is an inherent component of GIS. Finally, the applied spatial statistics techniques (Exploratory Spatial Data Analysis, Spatial autocorrelation indices etc.) in order to reveal specific spatial patterns (e.g. different types of clustering) of fire risk evolving through the time.
Pradhan et al. (2007) created a susceptibility map based on the interrelation of fire events and the respective contributing factor. So, they collected the fire hot spots from NOAA satellites for five consecutive years. Afterwards, they classified the satellite image through unsupervised classification in order to form the land use map. At the same time, they calculated the NDVI and used other meteorological and topographic inputs such as soil features, slope, and aspect. Finally, they assessed the impact of each and every factor in relation to the fire hotspots. Based on this frequency ratio technique, they estimated the corresponding weights for all the variables and developed the final risk map.
Saglam et al. (2008) explored two forest fires interrelated indices, namely, forest fire risk and forest fire danger and proceeded to the spatiotemporal analysis from 1987 to 2000 with emphasis on forest fuels characteristics. Firstly, they created the forest types maps with the contribution of Landsat imagery, and ground truth information providing details about specific features of fuels. Thus, they implemented the supervised classification based on maximum likelihood algorithm. Next, they discriminated the terms of fire risk and danger, where the former indicates the “probability of ignition” based on the contributing factors, while the latter “refers to sum of constant and variable factors affecting the ignition, spread, and resistance to control, and subsequent fire damage”. Afterwards, for the first index, they estimated the contributing impact of fuel types, topography (slope and aspect) and the closeness to human structures and infrastructures where most activities take place (agricultural fields, inhabited areas). On the other hand, the fire danger index included the effect of vegetation characteristics (fuel types, age stage of species, crown closure) and topography. Even though they proceeded to knowledge based evaluation of the variables in relation to fire risk, different equations described the meaning of the above terms. Finally, they studied the spatiotemporal analysis
8
of fire risk solely relied on the specific forest fuels features, without taking into account the other factors. Definitely, vegetation characteristics is the key factor on fire risk determination, however, other variables have their added value to the composition of such indices.
Kalabokidis et al. (2013) developed an online application taking the advantage of GIS tools and methods as well as the acquirement and process of other geospatial information (satellite images; meteorological data etc.) for interactively manipulating forest fires in real time. The application consisted of several modules. The first one was related with the active management of forest fires using certain inputs and processes such as: satellite and aerial maps; thematic maps of elevation, road network, land cover, evacuation regions, fire observatories, and other human structures and infrastructure; a similar to geocoding process to locate firefighting vehicles and airtankers which are equipped with GPS trackers; real time valuable geoprocessing options (estimation of the optimal route to the nearest water tank etc.); The second module incorporated the design of the appropriate meteorological (thematic) maps (temperature; relative humidity; rainfall, wind features etc.). These maps represent the variables that are conducive to forest fires phenomena; the third module was responsible for the determination of fire risk through the Fire Ignition Index. This index integrated the key factors that may trigger and propagate forest fires phenomena. Specifically, it combined four sub-indices, namely, the Fire Weather Index (temperature, wind speed, level of rainfall and relative humidity); the Fire Hazard Index (fuels characteristics and topographic variables) and the Fire Risk Index (proximity to road network, inhabited areas, agricultural fields, and other infrastructure such as power lines). Finally, the application incorporated a fire propagation model for simulating forest fires phenomena based on the American FARSITE fire simulation model which is fed from the aforementioned inputs.
Carmel et al. (2009) estimated the fire risk of a mountainous region using a fire simulation model, namely, the American FARSITE. After a significant number of simulations, the fire risk was determined based on the results of this model such as the ignition and the burned area resulted from the simulations. Key variables were included in the model with the most significant one to be the fuel types, while a sub-model would determine the fire behavior per vegetation species. Other critical factors incorporated in the model were: topography; fuel characteristics (moisture and crown closure etc.); meteorological factors (wind velocity and direction, relative humidity, temperature); the location of ignition point which was a random process. However, the authors estimated that most fire events occur in proximity to road network. So, they created distinct buffer zones per type of road network and the majority of the random ignition points (approximately 80%) fell into these zones. The remaining 20% of the hotspots broke out in other places of the study domain; and the timeframe of burning was adjusted based on historical data (past records). Finally, based on all these simulations, a fire risk map was created and it was similar to the spatial structure of fuels. Nevertheless, the other critical factors (topography etc.) played their important role modifying the fire risk in many neighboring areas despite the existence of the same fuel types.
9
Gai et al. (2011) developed a forest fire risk based on the three interrelated factors. The first one is related to the physical features of the study area, the second is associated with socioeconomic variables and the last one is linked to the accessibility of the fire fighting forces and infrastructure. Specifically, they integrated: topography (elevation, slope and aspect), land use and meteorological information (temperature, moisture and wind speed); population density and worth of forested areas; and the proximity from fire agency premises, fire observatories and firefighting helicopter location. Beyond the distinct weighting of all these factors, they determined an external weight for each variable based on Grey Relativity Analysis. Finally, after they created the fire risk maps for each general category, they developed the united fire risk map integrating all the above key factors. However, it should be noted that Grey Relativity Analysis provided general weights that were almost identical for all factors (with slight differences), a fact that might be not true, especially when compared the impact of fuels with other less minor factor (such as elevation, or worth of forested area). In the same context, it should be highlighted that the distance from fire observatories might play absolutely no role in fire risk determination, but it might have crucial role in early detection of fire events which is of crucial importance.
One of the initial forest fires risk maps was implemented by Jaiswal et al. (2002). The authors created a forest types map through classification of remotely sensed data derived from IRS 1D satellite. Afterwards, they chose to explore and map other crucial factors, namely, slope, and proximity to human structures and infrastructure (towns and road network). After the weighting process to each variable and to the general category to which those variables belonged, they integrated all these inputs in order to create the final risk map. However, other vital factors were absent. In the following years, several additional contributing factors have enriched those fire risk models.
Gabban et al. (2006) estimated the fire risk for the Mediterranean countries relied on exclusively remotely sensed data. Specifically, they created this index based on the temporal evolution of NDVI values, derived from NOAA - Advanced Very High Resolution Radiometer data. The authors emphasized that the determination of fire risk based on NDVI index could effectively be calculated through a temporal evolution of this index. To this end, they created an index called Dynamic Relative Greenness Index (DRGI), which combined the NDVI value of each pixel in relation to the corresponding minimum and maximum NDVI values (retrieved by past records on daily basis). After the validation of this model, they concluded that there is a high correlation between this index and the number of fire events. Thus, the lower the DRGI the more possibilities to have greater number of fire hotspots.
Pourghasemi (2016) enriched the fire risk map with additional variables on the one hand, and on the other hand, he proceeded to a comparative analysis of two statistical methods for determining the specific weights per involved variable. The model incorporated the following key factors: topography (slope, aspect and elevation); topographic position and wetness indices (indices related to elevation and slope); plan curvature (all the above indices were being extracted from the DEM of the study
10
area); proximity to natural and anthropogenic elements (water bodies, inhabited areas and road network); land use; NDVI; soil types; and meteorological variables (rainfall, temperature and wind features). At the same time, he used 70% of the (historical) fire hotspots as a training dataset and 30% for validation purposes. This data was retrieved from MODIS platform and will be used for the validation of the following models. Next, he applied the evidential belief function in order to determine the special weight of each sub-class inside all variables in relation to the number of hot spots per sub class. Finally, they combined all the aforementioned factors, after the multiplication of each sub class with the respective weight, and created the first fire risk map. The second approach included the determination of the weights based on the binary logistic regression. After the comparison of the two methods based on the estimation of the area under curve (AUC), he concluded that the logistic regression approach was performed better than the evidential belief. Even though it might be a robust method, it should be highlighted the fact that some correction measures should have been taken based on the literature review and general knowledge of the phenomenon. One example consists of the high weight (evidential belief) on very high levels of elevation, where beyond a natural cause (e.g. a thunder), the possibility of a fire ignition is considered low due to multiple interrelated factors (distant from anthropogenic structures; high levels of ground moisture and lower temperatures).
Concluding, it should be stressed that fire risk modeling is estimated by different tools and methodologies aiming to achieving the most reliable results. The primary inputs are quite similar providing the framework for a detailed analysis of fire risk. GIS, AHP, Fuzzy logic, statistical techniques and remote sensing indices are widely used for the improvement of final result with very successful results.
However, in order to establish the validity and superiority of each method over the others, a comparative assessment of different methods in any study area with the same inputs could be a first indication of the robustness of different techniques, as it happens when comparing different classification algorithms in remote sensing. Definitely, beyond the same inputs, we should use the same validation method and data in order to compare the effectiveness of these techniques. In addition, it should be noted that there are very few studies exploring the spatiotemporal evolution of fire risk determining the capacity of each contributing factor to fire risk through time and suggesting the most appropriate measures.
2.3 Visibility analysis
Viewshed analysis has been used in many scientific and practical applications. The main purpose of this analysis can be considered multifaceted based on the specific objective of each project. Following, several examples are presented, so that we can formulate an idea about the added value of this tool.
11
Mouflis et al. (2008) explored the temporal visual pollution of marble quarry growth through time in a Greek island. This process (if not managed effectively) may have a severe impact on other crucial socioeconomic activities such as tourism, reducing attractiveness of the natural environment of the island.
Rød and van der Meer (2009) studied the visual influence of a significant proposed project which included the construction of a very tall building in the downtown. After they have implemented a viewshed analysis, the authors concluded that the new structure would not have severe visual effect from specific locations as determined by the local planning authorities.
Other applications include the visual effect analysis on natural environment, derived from certain economic activities of the primary sector of economy such as the mining industry (Zhou et al. 2011). Falconer et al. (2013) used the viewshed analysis in order to find an optimal location (with the least visual effect) for aquaculture activities, while Castro et al. (2011) exploited this tool to promote safety in the transportation sector (e.g. visible distance on motorways). Wróżyński et al. (2016) explored and studied the visual intrusion of wind generators, a key factor that definitely affects the final location of such investments. To this end, they combined visibility analysis and 3D models for more reliable results.
Visibility or viewshed analysis is a powerful tool in order to determine the visual pollution or intrusion of certain structures or economic activities. So, public acceptance can be guaranteed reducing or appropriately managing the visual impacts of any new investment.
2.3.1 Visibility analysis in forest fires
Pompa-García et al. (2010, 2012) designed a simple visibility model for early detection of forest fires. The primary data used were the Digital Elevation Model (DEM) of the study area and the corresponding land cover / forest types. Even though, these specific models could have their own added value covering most of the vulnerable forest fuels, there was no any concrete methodology or reasoning (except the aim of the project which was the maximum visibility coverage from the least possible observers) for selecting the specific locations of watchtowers.
A most integrated approach of visibility analysis in forest fires prevention is presented by Eugenio et al. (2016b). More concisely, they developed a coherent model taking into consideration multiple factors such as: i) the elevation and the geomorphology of the study area through the DEM; ii) the selection of the most appropriate land uses in terms of human resources accessibility and appropriate surface for locating the watchtowers, avoiding rocky, water or other inappropriate surfaces; iii) following, they created multiple ring buffers (100; 300; and 500 meters) along the road network, so that they may assure the proximity of roads and the towers (small walking distance); iv) next, they applied stratified unaligned systematic sampling for the creation of point database as potential positions of the proposed watchtowers; v) after the intersection of multiple ring buffers and their other respective characteristics as described above, they created grids with distinct dimensions (15x15 km;
12
17.5x17.5 km; 20x20 km) selecting all the highest positions within each division; vi) finally, the locations with higher altitudes were selected for each method and visibility analysis applied for all these candidate positions. Last, in order to examine the validity of their model, they overlaid the proposed method, in terms of visible area, with the areas of high - very high risk and conservation units as well as with the area where the most fire hot spots have outburst.
In the same context, Bao et al. (2015) explored the optimal locations of watchtowers for early detection of forest fires. The primary data used were a certain number of potential locations on the ridge and the DEM of the study domain. Subsequently, they combined spatial optimization techniques and viewshed analysis. Specifically, they implemented three models relied on basic assumptions such as: i) the coverage of the entire study area in terms of visibility in conjunction with the least cost of construction; ii) achieving maximum visible area coupled with the least cost of construction; and iii) accomplishing maximum visible area based on specific amount of funding for the construction of the watchtowers. For the implementation of all these objectives, they used programming techniques and genetic algorithms, concluding that after a certain percentage of visibility (after the optimization processes), the marginal added value of additional watchtowers is getting quite small in a cost-benefit analysis.
Concluding, it should be emphasized that visibility or viewshed analysis and applications for forest fires prevention are quite limited. So, there is fertile ground to apply this technique of high added value to forest fires field in order to detect any incident as soon as possible minimizing the extensive consequences of uncontrollable phenomena. The adoption of programming and optimization techniques (i.e. genetic algorithms) could improve the final result in terms of visibility effectiveness, reducing significantly the computation time.
Finally, it should be mentioned that even though fire risk modeling and viewshed analysis consist of two interrelated fire prevention measures, there are very few studies focusing on this interaction. Hence, the current study tries to bridge this research gap, not only exploring the spatiotemporal analysis of fire risk, but also putting the fire risk and viewshed analysis into the same framework maximizing the efficiency of forest fires prevention.
13
3. Materials and Methods
This chapter presents the exact geographic location of the study area as well as the primary inputs that will be used in fire risk modeling for the reference years. Some essential pre-processing techniques have been conducted so that we can use these factors directly into the fire risk framework. The primary inputs consist of topography (elevation, slope, aspect); land cover; vegetation indices (NDVI, NDMI); proximity to road and human settlements network. The analysis of these inputs leads to the justification of adopting the specific fire risk model.
3.1 Geographical location
The study area of the project constitutes a small Greek island, which is called Skiathos. The island of Skiathos is situated in the central area of Greece and belongs to the Prefecture of Sporades (Figure 3.1). The geographic coordinates of the study area are: 39°10′N 23°29′E (Wikipedia, 2017).
The population of the island remained almost stable in a timeframe of the last ten years. Specifically, a tiny population growth has observed (1,1%) and the exact population amount yielded to 6.160 people compared to 6.088 people in last inventory of 2001 (Hellenic Statistical Authority, 2017).
The highest altitude of the study domain is 433 meters (DEM). The total area amounts to 4.887,7 ha, while the length of the coast is 44 km (skiathosisland.com, 2017).
Figure 3.1. Geographical location of Skiathos in a nationwide and worldwide perspective
14
3.2 Data
First of all, it should be mentioned that the adopted projection system is the corresponding Greek Geodetic Reference System 1987, called GGRS_1987_Transcerse Mercator.
One of the influential factors of forest fires phenomena is the geomorphology of the study area. The topography consists of three main dimensions, namely, the elevation, slope, and aspect. The discussion about the impact and interrelationship of these factors to forest fires ignition and propagation is described in the subsequent section (fire risk).
3.2.1 Elevation
The elevation dimension is derived from the Digital Elevation Model (DEM) (Figure 3.2). The DEM depicts the scalable fluctuation of elevation across the island.
Figure 3.2. Digital Elevation Model of Skiathos
Source: NCMA, 2012; own processing
After the necessary geoprocessing and cartographic processes (reclassify; conversion from raster to polygon; dissolve; zonal geometry as table etc.), we created the following table (Table 3.1) which shows the elevation levels divided by distinct zones of 100 meters. As we may observe, the study domain is primarily occupied by lowland areas, followed by relatively small regions with higher altitudes. Specifically, the two first elevation zones (up to 200 m.) occupy 81% of the entire island, while the next two elevation zones (of medium height) occupy 18% of the study area.
Elevation levels (m) Area (ha) %
0 - 100 2872,2 58,8 101 - 200 1121,8 23,0
15
201 - 300 484,0 9,9 301 - 400 364,7 7,5 401 - 430 45,1 0,9
Total 4887,7 100,0
Table 3.1. Elevation zones
Source: NCMA, 2012; own processing
The Figure 3.3 presents the spatial allocation of all the aforementioned elevation zones.
Figure 3.3. Elevation levels of Skiathos
Source: NCMA, 2012; own processing
3.2.2 Slope
Slope is another crucial factor that may drastically affect the fire propagation. Slope is stem from DEM and expresses “the incline, or steepness, of a surface” (Support.esri.com, 2017a).
After the essential geoprocessing and cartographic processes (slope; reclassify; conversion from raster to polygon; dissolve, zonal geometry as table etc.) we developed the following graph (Graph 3.1) which presents the slope levels per five degrees. As we may see, there is a trend of increasing area with higher slope up to 30% (85% of the entire study area), while a percentage of 14,5% corresponds to surfaces with slopes more than 30%. Hence, we realize that the slope factor may play a crucial role in fire propagation.
16
Graph 3.1. Slope levels
Source: NCMA, 2012; own processing
The Figure 3.4 depicts the spatial allocation of all the distinct slope zones (per 5 degrees).
Figure 3.4. Slope levels of Skiathos
Source: NCMA, 2012; own processing
3.2.3 Aspect
Aspect is the last important topography factor that has distinct impact on forest fires events. By definition, aspect is “the compass direction that a topographic slope faces, usually measured in degrees from north” (Support.esri.com, 2017b).
After the essential geoprocessing and cartographic processes (aspect; reclassify; etc.) we created the following graph (Graph 3.2) which presents the aspect levels based on the surface direction. As we may observe, there is a relatively equal distribution among the different surface directions by almost
17
10% of the island on each direction. However, it should be noted that the most dangerous direction is related to south-facing surfaces. Consequently, we may see a total percentage of 38,1% of the study domain is covered by south-faced surfaces (including southwest and southeast aspect).
Graph 3.2. Aspect levels
Source: NCMA, 2012; own processing
The following map (Figure 3.5) depicts the spatial allocation of all the distinct aspect levels (based on different direction).
Figure 3.5. Aspect levels of Skiathos
Source: NCMA, 2012; own processing
3.2.4 Climatic characteristics
One of the most critical elements on forest fires phenomenon constitutes the climatic/meteorological conditions. When the climatic conditions are favorable to forest fires ignitions and spread, the fire risk
18
is getting higher and higher. Due to extremely small spatial scale of the study area, there is no any weather station on the surface of the island, hence, there is no updated and past records about the weather situation and evolution. However, due to the great significance of this dynamic variable, we adopted an alternative solution, taking the most crucial meteorological indices from the closest weather station. This station is located in the city of Volos which is the center of this administrative region. The exact geographic characteristics of the station are the following ones: Elevation: 52 m; Latitude: 39° 22' 31" N; Longitude: 22° 57' 32" E (Meteo, 2017a). The similarity of the weather conditions can be depicted from the small distance between the station and the study area, which amounts to 41 nautical miles (skiathosisland.com, 2017).
Even though we cannot directly include the climatic variables in the fire risk model because of the absence of any data or a reasonable allocation of a few weather stations (for spatial interpolation purposes), it is quite important to have a general image about the weather characteristics of the study area and their interrelation with forest fire events. In addition, we will try to adopt an indirect approach, estimating the situation of vegetation in terms of greenness and moisture for the month when most severe incidents take place.
The following tables present the main meteorological conditions for the fire season in Greece which is from June to September. In order to obtain a recent image and to get the vegetation indices in the riskiest month, we calculated the values for three consecutive years, namely, from 2015 to 2017. Thus, we get more reliable results decreasing the influence of any fluctuations in those years. The key variables examined were the mean and highest temperature per month; the maximum and minimum relative humidity (average values per month); the level of precipitation; and the wind characteristics (wind speed and direction).
As we can observe from the Tables 3.2 and 3.3, the riskiest months are July and August where the highest mean and high temperatures have been recorded; the lowest maximum and minimum relative humidity have been observed; the lowest level of precipitation has been noted and average wind speed took place. Therefore, we conclude that the riskiest month is August, when the lowest level of rainfall has been observed in conjunction with the lowest moisture. Hence, the combination of high temperatures and low levels of rainfall (and moisture subsequently) could easily lead to more frequent and severe forest fires phenomena.
Year Month Mean Temperature (Co) High Temperature (Co) Low Temperature (Co) Maximum Relative Humidity (%) Minimum Relative Humidity (%) Average 2015-2017 June 25,5 37,6 16,7 76,6 48,2 July 28,0 38,7 18,6 71,3 43,0 August 27,9 36,7 19,6 68,7 42,6 September 24,0 36,7 15,5 82,5 56,5
Table 3.2. Temperature and humidity indices
19
Year Month Rainfall (mm)
Mean wind speed (km/hr)
High wind speed (km/hr) Wind direction Average 2015-2017 June 60,5 4,8 57,9 NE July 46,4 4,9 52,0 NE August 9,6 4,8 52,6 NE September 117,6 3,7 44,3 NE
Table 3.3. Precipitation and wind characteristics indices
Source: Meteo, 2017b, Own processing
The next figure (Figure 3.3) depicts the interrelationship of mean temperature and precipitation in the examined four months, confirming the combination of high temperatures and low levels of rainfall in July and August and especially in August. This fact inevitably leads to lower levels of moisture and more favorable conditions for forest fires ignition and propagation.
Figure 3.3. Mean temperature vs precipitation in Skiathos
Source: Meteo, 2017b, Own processing
Finally, the above conclusion has been confirmed from the fire history in national level. Specifically, according to a study conducted by Tsagari et al. (2011) 62% of the total fire ignitions have occurred from July to September which destroyed 85% of the total burned areas in Greece. Based on the findings of this study, 24% of the total fire ignitions and 36% of the total burned areas have occurred in August, which are the highest percentages in Greece from a time span from 1983-2008 (Tsagari et al., 2011).
3.2.5 NDVI 1990, 2016
NDVI is considered as one of the most prevalent indices in characterizing the vegetation conditions. The classification of NDVI can produce valuable information about specific characteristics of vegetation and the land cover. Specifically, NDVI ranges from -1 to +1 and can reveal some certain
0 20 40 60 80 100 120 140 22 23 24 25 26 27 28 29
June July August September
mm Ce ls iu s d egre es
Mean temperature VS Precipitation - Skiathos island (2015-2017)
20
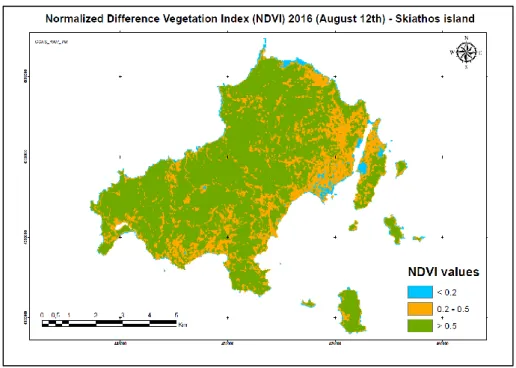
features based on remote sensing techniques. Generally, values below 0,1 may describe non-vegetated regions, sandy surface or water bodies. The next interval of the spectrum (0,2 – 0,5) can capture features of vegetation leading to not dense species (shrubs, grasslands) and some types of crop cultivations, while the last interval (> 0,5) usually reflects to dense and healthy forest species (USGS, 2017). This, type of information (along with humidity indices like NDMI) plays a critical role in fire risk estimation.
In order to calculate the NDVI index for 2016, we used the following equation (for Landsat 8), exploiting the information of Red (R) and Near Infrared (NIR) bands (4 and 5 respectively) reflectance:
NDVI = (NIR – R) / (NIR) + R): landsat.usgs.gov, 2017
So, after the retrieval and the processing of the corresponding bands (clip; projection; math algebra etc.), we created the NDVI map along the study area, as depicted in the next map (Figure 3.6). The most appropriate image taken on August 12th, 2016, without cloud interference. The selection of the month was based on the climatic information described in the previous section.
Figure 3.6. NDVI of Skiathos (2016)
Source: USGS - Earth Explorer 2017, own processing.
In order to make the image clearer (Figure 3.7), we adopted the classification as explained above. Thus, we may observe that the lowest interval of spectrum primarily includes the artificial structures (urban areas), sandy-arid surface and possibly water bodies. The next interval incorporates the agricultural land which thrives close to the inhabited areas and the easily accessible coastal regions, while the last interval includes many types of forest that dominate the majority of the island. Definitely, here we take advantage of the vegetation condition information (and not the discrimination of land cover), since this type of information is crucial in fire behavior.
21
Figure 3.7. Reclassified NDVI of Skiathos (2016)
Source: USGS - Earth Explorer 2017, own processing.
In the following table (Table 3.4), we see the area occupied by each predefined interval of the spectrum. Reasonably, most of the area belongs to the last class, since forested land is the dominant land cover on the island.
Interval Area (ha) %
< 0,2 176,67 4% 0,2 - 0,5 1.204,65 25%
> 0,5 3.507,21 72% Total 4.888,53 100%
Table 3.4. Area per NDVI interval (2016)
Source: USGS - Earth Explorer 2017, own processing
In the case of NDVI for 1990, the Landsat 5 Thematic Mapper sensor was used. In order to calculate this index, we used the following equation (for Landsat 5), exploiting the information of Red (R) and Near Infrared (NIR) bands (3 and 4 respectively) reflectance:
NDVI = (NIR – R) / (NIR) + R): landsat.usgs.gov, 2017
So, after the retrieval and the processing of the corresponding bands (clip; projection; etc.), we proceeded to another necessary procedure, namely, the radiometric calibration of the involved bands. Firstly, we transformed the Digital Number of each band to radiance through Gain and Bias Method adopted the following equation (Center for Earth Observation, 2017):
Li = gain * DN + bias, Where:
22
Li: is the cell value as radiance DN: is the cell value digital number Gain: is the gain value for a specific band Bias: is the bias value for a specific band
So, the first transformation that took place was (we computed the radiometric calibration for the 5th band as well because it will be need for the next index, called NDMI)1:
Li_Band 3: (1.043976 * DN) + (-2.21) Li_Band 4: (0.876024 * DN) + (-2.39) Li_Band 5: (0.120354 * DN) + (-0.49)
Following, we had to transform the radiance to Top of Atmosphere Reflectance, based on the following equation (Center for Earth Observation, 2017):
Ri = pi * Li * d2 / ESUNi * cos(thitas),
Where:
Ri: Unitless plantary reflectance Li: spectral radiance (from earlier step) d: Earth-Sun distance in astronmoical units ESUNi: mean solar exoatmospheric irradiances2 thitas: solar zenith angle
Hence, the respective equations applied to each band are the following ones:
Band 3: (3.14 * Li_Band3 * (1.0116265 * 1.0116265)) / 1551 * Cos(90-51.57122754) Band 4: (3.14 * Li_Band4 * (1.0116265 * 1.0116265)) / 1036 * Cos(90-51.57122754) Band 5: (3.14 * Li_Band5 * (1.0116265 * 1.0116265)) / 214.9 * Cos(90-51.57122754)
Finally, we proceeded to the math algebra of all these transformed bands based on the initial equation presented in the beginning of the current section. Thus, we created the NDVI map along the study area, as depicted in the next map (Figure 3.8). The most appropriate image taken on August 21st, 1990, without cloud interference. The selection of the month was based on the climatic information described in previous sections.
1 The gain and bias values were retrieved from Chander et al. (2009). 2
23
Figure 3.8. NDVI of Skiathos (1990)
Source: GloVis 2017, own processing
For comparison reasons, we adopted the same classification scheme as we did for the same index in 2016 (Figure 3.9).
Figure 3.9. Reclassified NDVI of Skiathos (1990)
Source: GloVis 2017, own processing
As we observe from the above map (Figure 3.10), the majority of the island is covered by agricultural fields and shrubs as well as not dense forested areas. Here, it should be highlighted the fact that there is a possibility of some errors in the bands, since we expected to have more extensive regions of more