A Work Project, presented as part of the requirements for the Award of a Masters Degree in Management from the Faculdade de Economia da Universidade Nova de Lisboa.
The Consultancy Field in Europe:
a Comparative Approach
Isabel Maria Lopes Ribeiro Ramos Clementino mst15000298
A Project carried out on the Strategy Area, with the supervision of: Professor Doutor José Álvaro Ferreira da Silva
The Consultancy Field in Europe: a Comparative Approach
Acknowledgements
I would like to express my sincere gratitude to Professor Álvaro Ferreira da Silva for the enormous support during the execution of this work project. I would also like to thank Dr. Miguel Águas, Eng. António Bernardo and Dr. José Bom for the interviews and to Professora Graça Silva for her support.
Finally, a very special thank to all my friends, mainly to my parents and sister, who always helped me during the different stages of this work.
Abstract
This paper analyses the European consultancy industry and its evolution during the last decade. The current situation of the European consulting industry is compared with its long-term development since the 1980s, as well as with some perspective on its future evolution.
Former literature on the field suggested that consulting in Europe would become less diverse in the early twentieth century (“convergence hypothesis”) and dominated by global American firms (“Americanization hypothesis”). The main conclusions point in a different direction. The European consulting market still has much national diversity and there is not a clear convergence trend in the industry. On the contrary, there is evidence suggesting an increasing diversity between countries over the last decade. Finally, the “Americanization hypothesis” is not confirmed. The European firms increased their number among the largest consultancies operating in Europe.
1. Introduction
The main purpose of this work project is to analyse the European consultancy market and its recent evolution. Its main characteristics are assessed, as well as its most important changes overtime.
Consultancy as a business activity emerged at the end of the nineteenth century in the United States of America and was later introduced in Western Europe. In the last century this business activity presented great levels of growth and expansion and it is now practiced in most countries around the world.
Although there is no widely accepted definition of business consultancy, it can broadly be defined as “an advisory service contracted for and provided to organizations by specially trained and qualified persons who assist, in an objective and independent manner, the client organization to identify management problems, analyse such problems, recommend solutions to these problems, and help, when requested, in the implementation of solutions” (Greiner and Metzger, 1983: 7).
To achieve the objectives of this article, the market current situation will be characterised, in terms of importance, size, structure and concentration. The results coming from this analysis will be compared with its recent evolution, in order to weigh up the changes verified in the last decade.
Since this market is so dynamic and difficult to define and to limit boundaries, the following questions will guide this article:
• What are the main characteristics of the market?
• What is the weight of the consulting market in the global European market and in each country economy?
• Is there a convergence in the consultancy business around the World and in each European country?
First, a literature review is presented, highlighting the main conclusions published in the relevant contributions on the subject. Due to the lack of reliable information, there was the need to use not only the general data collected by international associations but also more specific information given by chosen consultancies. This is the subject of Section 3. The approach to the study of the European consultancy market is split in two sections: the first one focuses on the decades of 1980s and 1990s and it is based in two seminal papers (Keeble and Schwalbach, 1995; Kipping and Armbrüster, 1999). The second one analyses the last decade, stressing the following aspects: consultancy size and economic importance; industry structure and concentration; consulting services and clients. Finally, based on this analysis the main conclusions are stated. Then the main references are listed, followed by some annexes consisting of tables, calculations and definitions. At the end, the reader can find the interviews done within the scope of this project.
2. The birth and characteristics of a new field: a literature review
Consulting services represent today one of the fastest growing and dynamic industries, attaining yearly rates of growth of 20 per cent in the 1980s or 10-15 percent in late 1990s and early 2000s, considerably faster than global GDP (Keeble and Schwalbach, 1995; Armbrüster and Kipping, 2002-2003; Kipping and Kirkpatrick, 2005). Therefore, consultancy firms became the symbol of the shift to a services economy in advanced countries (Fincham and Clark, 2002).
However, studies on the consultancy business have been slow to recognize the economic importance of the industry. In fact, only during the last decades academic interest increased and several studies started to analyse its origins and role in the economy (Fincham
recent business activity, which may have deterred the development of these studies. In addition, it is a difficult industry to be analysed, due to the complexities in drawing its boundaries, as well as in collecting hard evidence on it.
The consulting industry has its roots in the late nineteenth century, when scientific management started to spread in large-scale mass-producing firms (Kipping, 1999; Kipping, 2002). These consultant engineers or efficiency experts were interested in rationalizing operations at the shop-floor level, integrating mass-production technology (continuous process, assembly line or the use of standardized and inter-changeable parts) and work force management through time-and-motion studies and wage incentives. It corresponds to the first wave in which Matthias Kipping (2002) characterizes the development of the consulting industry (table 1), linking its evolution with the key shifts verified in demand, the organization of the client companies and management theories.
Table 1: Characteristics of the consultancies in different waves
High junior to partner ratio Substantial partner group 'Top level advisors' MBA/Business graduates
IT skills plus in-house training 'Implementation specialists' Source of Reputation Background of consultants Hierarchy 'Efficiency experts' Experienced engineers Founder + equal consultants Pre-eminent consultancies Major expansion Overall durantion Key issues Wave Decentralization and portfolio planning Organization and Strategy
Big Five', EDS, CSC, Gemini 1990s-???? 1960s-???? Internal and external co-ordination Source: Kipping (2002). Scientific management Emerson, Bedaux, 'Big Four', Maynard 1930s-1950s 1900s-1980s Efficiency of workers and production IT-based networks Booz Allen, McKinsey, A.T. Kearney,BCG 1960s-1980s 1930s-20??
The emergence of the second wave was a consequence of market changes, with the rise of very large and diversified firms in the inter-war period (1920s-1930s), demanding a new type of organization. The introduction of the multidivisional structure and top-management advice on strategic issues became the critical components of this second wave, substituting shop-floor advice. Successful companies, as McKinsey or Arthur D. Little, were founded during this period of
time and became the most important representatives of this second wave, followed by the Boston Consulting Group and Bain & Company.
Today, this market, according to Kipping, is between the second and third waves, with the major expansion of the IT-based companies such as Capgemini and IBM Consulting Services (Armbrüster and Kipping, 2002-2003). The management consultancy firms focused on strategy and organization continued to be important players (see table). However, IT consulting firms prospered and in some cases moved to strategy and organization consulting (EDS and IBM acquired, respectively, A. T. Kearney and PwC). In the early 21st century, IBM became the world
largest consultancy, epitomizing this process (James, 2001).
This brief overview on the evolution of consultancy emphasizes the novelty of this business field. Other interpretations stress that its modernity is even greater. McKenna (1995, 2006) points up the 1930s as the critical period for the beginning of management consulting. Until then consulting was not a specialized field, being developed by a multitude of different agents. Management consulting in its modern form was institutionalized after the 1930s in the USA, the cradle of the consulting industry, as a minor by-product of the Glass-Steagall Act, which prevented commercial banks from engaging in non-banking activities, as management consulting. This is the reason why firms like McKinsey or Cresap, McCormick & Paget had their origin during this period of time, creating top-management advice as a distinctive practice regarding “management engineering”.
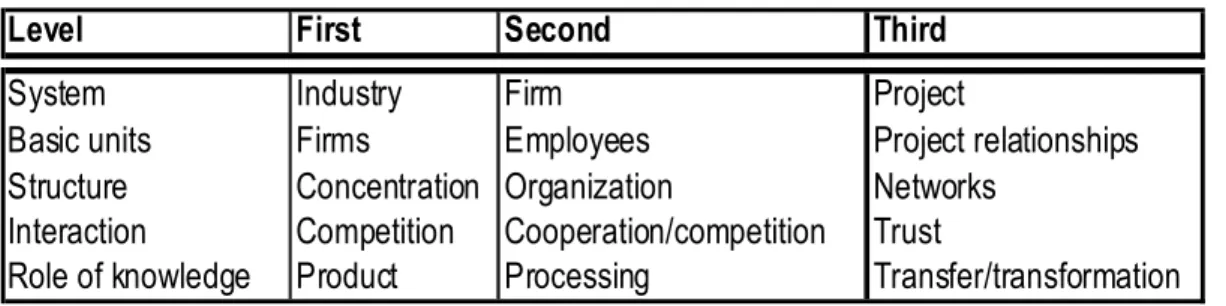
Besides being a “new profession” (McKenna), consulting practices have been difficult to characterize and circumscribe, overlapping other service activities. Classic references (Drucker, 1981) are much more interested in answering to the question “why do consultants exist” than to draw the boundaries and the specific characteristics of the field. Engwall and Kipping (2002) state that this market can be analysed at different levels of description and detail (table 2), which is
particularly helpful to the objectives of this study, focused on the first level of analysis, describing the industry, the firms operating in the market, and the levels of concentration and competition.
Table 2: Three levels of analysis
Level First Second Third
System Industry Firm Project
Basic units Firms Employees Project relationships
Structure Concentration Organization Networks
Interaction Competition Cooperation/competition Trust
Role of knowledge Product Processing Transfer/transformation
Sour ce: E ngwall and Kip ping [2002].
However, this does not solve the question on how to define the boundaries of the industry. It is difficult to circumscribe the activities and service providers and to have a clear and established definition of “management consulting” (Kipping and Armbrüster, 1999). The discussion about representing this service as a profession (Hyman, 1961; Drucker, 1981), an industry (Tisdall, 1982; Rassam, 2001; Kubr, 1986) or a field (Henry, 1992; Kipping and Armbrüster, 1999) is in this sense largely unsatisfactory and only contributes to evade the problem of defining the configuration of this activity. Therefore, in this study “field” and “industry” are used interchangeably. This approach to this service activity is more inclined to treat it as an industry rather than as a profession, taking into account recent trends in consulting activities for leaving partnership organization and becoming public companies. At least to put both at the same level, as it was proposed by Vernon Ellis, Accenture’s chairman, several years ago (Rassam, 2001: 31).
Definitions of management consultancy proliferate (Kubr, 1986; Keeble and Schwalbach, 1995; Fincham and Clark, 2002; Rassam, 2001; Curnow and Reuvid, 2003; Engwall and Kipping, 2002). Three characteristics are predominant: “identifying a problem”; “recommending a solution”; “helping with the implementation” (Rassam, 2001: 30). The latitude of services included in this advice industry is very large: strategy, information technology, operations, human resources,
finance administration, marketing and sales (Kipping and Armbrüster, 1999). The different functional areas of the firm are covered by these categories, as well as strategic and organizational issues. Moreover, this advice should be provided by independent agents and has the implicit attribute that it counsels and supports, but never manages solutions. When consulting firms are taking an outsourcing contract, there is a clear exception to this rule, which contributes to complicate the definition of the industry’s boundaries.
In contrast with traditional professions (lawyers, doctors, engineers), management consultants are characterized by low or non-existent barriers to entry (Amorim and Kipping, 1999). The asymmetry in the information available in the supply and demand side, the difficulty and uncertainty in attributing a value to the consultancy work explain the critical role played by reputation and perceived expertise (Dawes et al., 1992).
The approach to create taxonomies of consulting providers, according to size and organizational characteristics, contributes to increase the perceived complexity of the field (Kubr, 1986; Águas, 2008): global consulting firms (McKinsey & Company, The Boston Consulting Group or Roland Berger Strategy Consultants); management advisory services of major accounting firms (Deloitte or KPMG); small and medium-sized consulting firms, highly specialized in regional or sectoral markets; IT consulting services; sole practitioners; scholars and academic professionals acting as consultants; other suppliers of consulting services, such as Investment Banks.
The evolution of the industry is closely related to the state of the economy and the institutional framework of the different countries, as is stated by the Kennedy Information Report (2007). Economic development and growth, the level of integration in the world economy, the presence of multinationals or the rising number of mergers and acquisitions may affect, positively, consulting industry. Later on in this study, the analysis of the possible drivers to explain the
different levels of importance achieved by consulting in the European market will use a set of variables aligned with the analysis proposed in the Kennedy Information Report.
The next section will raise the most important problems associated with the sources of information, before moving on to the analysis of the European market.
3. Sources of information
The characteristics of the consulting business affect the data available on this economic activity. As it was stated before, the boundaries of the consulting activity are very fluid and the types of services are always changing. The diversity and fragmentation in the consultancy market also makes very hard to have reliable data. Moreover, there is very few public information on this market, since consultancy firms do not provide public information about revenues, number of consultants or percentage of their work in the consulting area or in other business lines (Águas, 2008). This market is not regulated by an official entity or self-regulated (as other professions, like lawyers or doctors) (Kipping, 1999), which prevent the easy collection and organization of data by a third entity. Being part of the services sector does not contribute to improve the situation, as the official statistics have much more detailed information on manufacturing or agricultural activities than on economic activities belonging to the tertiary sector.
Quantitative data for characterizing the European consulting market were collected in two main sources of information: the European Federation of Management Consultancies Association (FEACO) and the Kennedy Information. FEACO is a non-profit Association, whose main objective is to represent and promote the consultancy market in Europe. Their annual reports exist since 1997 and provide information on market volume, number of companies, and number of consultants, main business lines of these companies and its client sectors. These reports are based on surveys done to the consulting firms that are members of the National Associations that together compose FEACO. In 2006, those members are considered to represent 85% of the
European Market. The reliability and consistency of this information is different from country to country. Nevertheless, besides the aggregate and global perspective offered on the European market, the FEACO reports have the inestimable advantage of presenting consistent information over time. The report from Kennedy Information (2007) has data on 2006 and projections until 2010. It was used mostly to complement, validate and test the more detailed information provided by FEACO. Kennedy Information is a company that does market research and presents information on management and IT consulting. Its members are the biggest consultancy firms.
There are obvious differences in the volume of the European consultancy activity, the importance of each domestic market or business area in consulting, when these two sources information are compared. These discrepancies are inevitable, considering the characteristics of the consultancy business and the differences between the two sources. However, this is the price to be paid for analysing such a difficult business sector. In addition, this is positively the best information until now collected on the European consulting market in any available study, improving the evidence provided by Kipping and Armbrüster (1999), Kipping (2002) or Keeble and Schwalback (1995).
The problems with the available quantitative evidence prompted the resort to other sources of information, which might provide insight and deeper knowledge on this business activity. In-depth interviews were designed to consultants working on different firms operating in Portugal. Collecting this qualitative evidence is a very time consuming task. Therefore, a small number of cases were selected, trying to represent different market segments: top-management consultancy firms (American and European), a global firm providing operational consultancy services and an IT consultancy. The final result (see interviews in the appendix) does not represent all these segments, due to time constraint and access to all sources of information.
4. The European consultancy market in perspective (1980s and 1990s)
The expansion of “management engineering” consultancy market to Europe started in 1920s, but it was after World War II, and especially in the 1960s, that the biggest American management consulting firms established offices in Western Europe (Keeble and Schwalbach, 1995; McKenna, 2006; Kipping, 1996 and 1999). The expansion of American multinationals into Europe and the high rates of economic growth experienced by Western Europe during the 1960s explain the boom of the consultancy market. Therefore, management consultancies became “one of the most important carriers or channels for the dissemination of different waves of managerial expertise during the 20th century” in Europe (Kipping, 1996 and 1999). In the 1980s the
expansion of the large Anglo-American accountancies, such as KPMG and Andersen Consulting, also boosted the European consulting market, since they started to develop consultancy activities along with the initial audit services. The development of European integration contributed to a restructuring process within the European consulting market during the 1990s (Keeble and Schwalbach, 1995). Since then the European market experienced an extraordinary growth, both in number and size. Today it represents half of the American market. It has evolved in different times and speeds, but it covers now almost all the European countries (Kipping and Armbrüster, 1999).
In 1989 the European market totalled 15 billion ECU, was composed by 16,800 consultancy firms, employing of 176,190 workers. The United Kingdom and Germany were the most important domestic markets, concentrating more than 50% of the total turnover (Keeble and Schwalbach, 1995; see Annex I). At the end of the 1980s, the European countries consultancy markets were at different stages of development, with domestic turnovers varying greatly between countries. The top ten consultancies in Europe during this period illustrate the
pre-eminence of top-management consulting firms, such as McKinsey & Company and Booz-Allen & Hamilton. It was clearly the predominance of the second wave (see above).
The 1990s did not display different characteristics (Kipping and Armbrüster, 1999). There was still considerable diversity between domestic markets in terms of speed and extent of any convergence process across Europe. Their main findings suggest a North-South division. The two largest consulting markets in Europe, representing more than half of the market share, were Germany and the United Kingdom, in line with the findings presented by Keeble and Schwalbach for the late 1980s.In Northern Europe, the market volume represented a higher proportion of the GDP. The more concentrated markets were in the United Kingdom and Switzerland, where the top 10 consultancy firms dominated more than 50 percent of the total turnover. In the opposite position was the German market, much more dispersed, where the top 10 consultancy firms only had 15% of the market. Indeed, the presence and strong influence of medium and small-sized consultancies characterized the German market.
In terms of the kind of services provided by consulting firms in Europe, corporate strategy and organisation development, and information technology accounted for more than 35% of the total services, with important national variations too. Nordic countries, Germany and the Netherlands were more strategy and organisation oriented, and the UK and Spain had more IT consulting predominance. The reasons for these national differences are not straightforward, but they may be due to the kind of clients and the predominant economic structure in each country.
Kipping and Armbrüster also assess current changes in the European consulting market, trying to anticipate lines of future evolution. Considering the highly visible position acquired by the American consultancies in Western Europe, as well as the mergers and acquisitions trend in the late 1990s, they predict “an ever-increasing domination of European consultancy markets by
US-based service providers” (1999: 16). They already detained the largest share at the top of the market in 1997, even if strong national differences persist.
The next session will look at the European consultancy industry in the last decade, trying to disclose its more recent evolution in terms of size, market concentration, types of services provided and clients. The hypothesis of the ever-increasing “Americanization” proposed by Kipping and Armbrüster will be approached for the most recent period. Furthermore, the restructuring process within the European consulting market defined by Keeble and Schwalbach for the early 1990s should be ending after more than 10 years or at least revealing its main directions.
5. The European consultancy industry in the last decade: size and structure
5.1. Overview
The European consultancy market was characterised in 2006 by a market volume of €74 billion, according to FEACO, and almost €94 billion according to Kennedy Information. In terms of people working in this market, there are more than 500,000 employees in the sector, including consultants and other auxiliary staff (FEACO).
Figure 1: Evolution of the Market Volume, at market prices (in €billion, 1989-2007)
0 10 20 30 40 50 60 70 80 90 19891990199119921993 199419951996 199719981999 20002001 2002 20032004 2005 20062007e
It is depicted, in figure 1, the remarkable evolution of this market since 1989. This fact highlights the importance and relevance of this industry which is characterized by incredible growth rates in the last decade: in 2006 the market volume is almost seven times the 1994 value, which were, respectively, €74 billion and € 11 billion.
The first conclusion one may take from this figure is related to the overall performance of the sector over almost two decades: the consulting industry revenues in Europe have maintained a clear rising trend over time, with only one exception, between 1989 and 1994. The early 1990s financial crisis (Wright, 2008) may explain this negative evolution. After the early 1990s, three different phases are patent. From 1994 until 2001, and mainly since 1997, it is visible an impressive rhythm of growth, rising at almost 20% per year. The next years (2001-2004) were characterized by stagnation with the financial and dot.com crises affecting the consulting industry rate of growth. Finally, after 2004, a new boom emerged, mainly due to resuming economic growth and the enlargement of Europe to the Eastern countries.
It is important to analyse in detail the market volume and growth rate associated with those years because it is an average and hides differences between countries. In terms of market volume the biggest contributions are from the more mature markets. Indeed, together they gather more than half of the total turnover of this market in Europe, and so these two countries continue to represent the largest consultancy markets as in the 1980s and 1990s (Keeble and Schwalbach, 1995; Kipping, 1999). The Eastern European countries (Bulgaria, Hungary and Poland) display a lower market turnover. The evolution of the growth rate for certain countries (fig. 2) means that the Eastern European countries are those that present higher growth rates per year, when compared to the more mature markets.
Figure 2: Market Growth rates for European countries (1999-2006) -20,0% -10,0% 0,0% 10,0% 20,0% 30,0% 40,0% 1999 2000 2001 2002 2003 2004 2005 2006 Years G ro w th r a te s France Germany Hungary Portugal Romania Slovenia Spain Market
Source: FEACO Reports (1999-2006).
5.2. Consultancy size and economic importance
At the country level, table 3 reveals that the biggest markets of consultancy business are from Germany, United Kingdom, Spain and France, gathering almost 70% of the total revenue.
Table 3: Management Consultancy Volume Market by Country, 2006 and 2007
Country % in million € % in million € Germany 1 30,6% € 21.733,7 0,94% 1 25,3% € 23.737,1 0,98% United Kingdom 2 28,7% € 20.384,2 1,05% 2 23,6% € 22.176,1 1,08% Spain 3 10,7% € 7.570,0 0,77% 4 6,7% € 6.289,5 0,60% France 4 9,2% € 6.560,0 0,36% 3 14,1% € 13.260,0 0,70% The Netherlands 5 3,8% € 2.700,0 0,50% 6 6,0% € 5.655,6 1,00% Austria 6 3,7% € 2.627,9 1,02% 8 2,0% € 1.912,9 0,71% Italy 7 3,5% € 2.500,0 0,17% 4 6,7% € 6.250,9 0,40% Portugal 8 1,5% € 1.050,0 0,68% 12 0,3% € 308,7 0,19% Belgium 8 1,5% € 1.065,4 0,33% 10 1,4% € 1.331,6 0,40% Denmark 8 1,5% € 1.050,0 0,48% 9 1,9% € 1.778,4 0,79% Switzerland 11 1,0% € 710,3 0,23% 7 3,6% € 3.333,0 1,07% Norway 12 0,9% € 609,0 0,23% 11 1,3% € 1.183,1 0,42% Total 96,5% € 68.560,4 0,65% 92,9% € 87.217,0 0,78% Total Market 100,0% 71.025,0 100,0% € 93.862,0
Sources: FEACO Report 2006, Kennedy Information and EUROSTAT.
Market volume / GDP
Market volume / GDP
Market Volume Market Volume
Estimated total
market in Europe Rank Rank
FEACO 2006 Kennedy 2007
The importance of the industry in each country economy is represented by the market volume over GDP. It can be considered as a good indicator of the consultancy development level of each economy, as it is suggested in Bernardo (2009). Not surprisingly the countries where the consultancy weighs more in the economy are Germany and the United Kingdom, standing out
very clearly over the average values. Spain and Austria or the Netherlands, Switzerland and Denmark also diverge, according to the two sources, revealing some inconsistency between the two sources of information. At the bottom of the ranking are Norway, Italy and Portugal, the countries in which the consulting sector plays a smaller role in the economy. It is also possible to see in Annex II that the East European countries (Romania, Poland, Bulgaria and Hungary) also have a low value on the weight of the consulting sector in terms of GDP. The place of the consulting industry in the economy has been increasing over time. In 1999, consultancy represented 0,37% of the GDP. In 2006 it is more than 0,60%, almost the double, and in some countries it represents more than 1%.
Another important measure, still related with the structure and importance of the market, is the total turnover per consultant. This may be a good indicator on the kind of consultancies that dominate the market. As it is referred in Bernardo (2009), one way of segmenting this market is considering that measure: the total turnover per consultant. The top-management consultancies are those that request higher fees for their work (see Annex II). This measure is higher in the United Kingdom (€243,421), Switzerland, Netherlands, France and Denmark. The lowest value is from Romania, €16,400, which possible may be due to the small presence of top-management consultancies, who are currently expanding to Eastern Europe.
The convergence hypothesis in this industry, in the European region, can be tested looking at the weight of consulting over each country’s GDP. If there were any convergence process, the size of the consulting industry relative to GDP should be closer between countries over time. The dispersion index for 1999 and 2006 (see in Annex VI.A) indicates that the relative importance of the industry is more dispersed in 2006 than in 1999, which means that the countries are not converging in this aspect. This thematic of a possible convergence will be discussed later, focusing on other features.
To better characterise and classify the countries markets, cluster analysis is used. It groups the countries in three clusters, see Annex III. The first one consists of the mature markets: Germany, United Kingdom and Spain. In these countries the consultancy industry has a higher importance relative to the GDP, there are many firms belonging to the top European 500 and a higher number of staff is employed. On the opposite side, is the group with the less developed countries: Hungary, Poland, Czech Republic, Bulgaria, Romania, Greece, Slovenia and Portugal, which have other common trends: high average growth rates of the market, lowest GDP per capita and, excepting Romania, zero or almost none companies at the top 500. The remaining countries form the third cluster, Switzerland, Denmark, Netherlands, Belgium, Italy and France, have already consolidated consulting markets.
5.3. Industry structure and concentration
It is important to know the main consultancies operating in Europe. The table below ranks the top 25 firms in 2006.
The number one firm is the French Capgemini, which is an IT services and business consultancy company. This represents the market trend on the increasing of importance of IT consulting firms as suggested by Kipping (2002) and Armbrüster and Kipping (2003). Half of these firms are European, meaning that they have their headquarters in Europe. Indeed, European companies are powerful in this market and seem to be gaining market share to the American firms. When comparing this ranking with Kipping’s table, in Annex IV.A (the top 25 consulting firms in Europe in 1997), considerable differences are found. These changes may imply that the Americanization phenomenon of the European sector suggested by Kipping (1999) is not actually occurring, but instead an Europeanization is taking place.
Table 4: The Largest Consulting Companies in Western Europe by Revenue, 2006
1 Capgemini35 France France
2 Accenture USA USA
3 IBM Global Business Services USA USA
4 Atos Origin France/Belgium France
5 Deloitte USA UK
6 LogicaCMG UK UK
7 KPMG International Netherlands UK
8 T-Systems Germany Germany
9 CSC USA USA
10 PricewaterhouseCoopers USA UK
11 Altran France France
12 Siemens IT Solutions and Services36 Germany Germany
13 SAP Germany Germany
14 McKinsey & Co. USA USA
15 TictoEnator Finland/Sweden n.a.
16 Booz Allen Hamilton USA USA
17 Getronics Netherlands Netherlands
18 Mercer35,36 USA USA
19 HP Services USA USA
20 Ernst & Young USA USA
21 Oracle Consulting USA USA
22 Infosys India India
23 Boston Consulting Group USA USA
24 Indra Systemas Spain Spain
25 Steria France France
Source: Kennedy Information (2007).
36 Reflects a name change in 2007. 35
Reflects a recategorization of revenue for 2006.
Global Headquarters Firm
Rank Nationality
It is interesting to analyse the relative ranks of the companies along the decade 1997-2006. Andersen Consulting, today Accenture, had the top position in 1997 and it keeps nowadays a high rank. Still, many changes had occurred. Analysing the top positions, in 1997 they were occupied by the ‘Big Four’ (PwC, Deloitte & Touche, KPMG and Ernst & Young) and top-management consultancy firms. In 2006 the leading firms are the IT consultancies with the first of the ‘Big Four’ in the 5th position. It is also interesting to point out that among the top 25 companies
of 1997 only eleven companies figure in the top 25 of 2006, although all companies ranked in 1997 are still operating.
It is also important to stress the differences between the European ranking and the world ranking for 2007 (Annex IV.B). Globally, the ‘Big Four’ have the highest positions and are
supporting that, after the predominance of scientific management (early 20th century), and of
organization and strategy since the 1930s, it is time for IT-based networks. The 10 largest consultancy firms in the world also operate in the European market. However, only four among them occupy any of the ten top positions. After the 10th position in the “world league” only three
firms appear in the European market (Capgemini, CSC and Atos). This means that half of the 25 largest consultancy firms in the world are out of the European top-ranking. In contrast, when one looks to the largest European consultancy firms in Europe, only four can be considered global firms (KPMG, CapGemini, Atos and Roland Berger), occupying one place in the “world league”.
The market concentration indexes try to analyse whether the domination of few larger consultancies or the dispersion among small and medium-sized consultancy firms characterize the industry. The following table shows, on one hand, that the top-20 management consultancy firms retain more than 55% of the total turnover of the market, increasing more than 20% of proportion of revenue since 1999. Also the smaller firms are increasing its proportion of total turnover. On the other hand, the medium sized companies are loosing to those two segments of the market, gathering less 30% of proportion of revenues since 1999.
Table 5: Concentration of the Management Consultancy Market
1999 47,5% 42,2% 10,3% 2000 49,4% 22,8% 41,2% 15,1% 9,4% 8,1% 2001 51,0% 15,2% 40,5% 9,7% 8,5% 2,5% 2002 53,0% -2,2% 38,3% -2,0% 8,7% 0,2% 2003 56,0% 3,0% 28,6% 4,0% 15,4% 4,5% 2004 56,1% 3,8% 28,8% 4,2% 15,1% 2,3% 2005 57,7% 16,8% 31,7% 10,2% 16,3% 7,8% 2006 57,2% 9,3% 29,2% 15,1% 17,0% 4,4% Top-20 MC Firms
Average Growth Rate Proportion of the
total Turnover of MC-Firms in Europe
Source: FEACO Reports (1999-2006)
Small MC Firms (<500.000€ Turnover) Medium Sized MC Firms
Average Growth Rate Proportion of the
total Turnover of MC-Firms in Europe Average Growth Rate
Proportion of the total Turnover of
MC-Firms in Europe
This may indicate that this market is becoming dominated by the presence of big companies and by small ‘boutiques’, more oriented for the domestic markets and/or specialized in a precise segment of the market. This was also suggested by Águas (2008) and Bom (2009), as
a present facet, mainly in some countries such as the United Kingdom and Germany, but also in smaller countries as Portugal. The establishment of small ‘boutiques’ specialized in a specific line of service or sector of the economy, requesting for smaller fees when compared to the top-management worldwide renowned consultancies, may be a future trend in the market.
5.4. Consulting services and clients
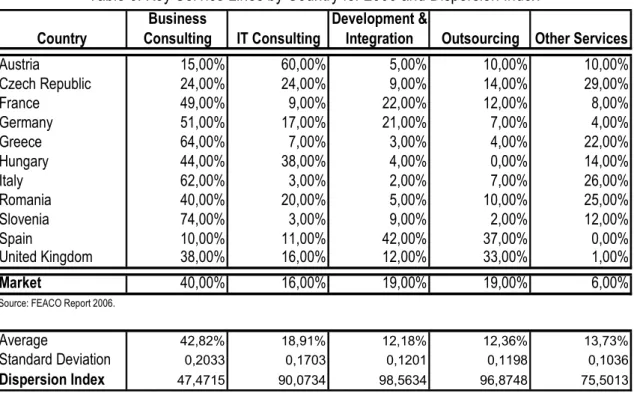
According to FEACO (2006), the main service lines of this industry are: Business Consulting, Information Technology Consulting, Development & Integration and Outsourcing. Next table presents the market share attained by these service lines in each country.
Table 6: Key Service Lines by Country for 2006 and Dispersion Index
Austria 15,00% 60,00% 5,00% 10,00% 10,00% Czech Republic 24,00% 24,00% 9,00% 14,00% 29,00% France 49,00% 9,00% 22,00% 12,00% 8,00% Germany 51,00% 17,00% 21,00% 7,00% 4,00% Greece 64,00% 7,00% 3,00% 4,00% 22,00% Hungary 44,00% 38,00% 4,00% 0,00% 14,00% Italy 62,00% 3,00% 2,00% 7,00% 26,00% Romania 40,00% 20,00% 5,00% 10,00% 25,00% Slovenia 74,00% 3,00% 9,00% 2,00% 12,00% Spain 10,00% 11,00% 42,00% 37,00% 0,00% United Kingdom 38,00% 16,00% 12,00% 33,00% 1,00% Market 40,00% 16,00% 19,00% 19,00% 6,00% Average 42,82% 18,91% 12,18% 12,36% 13,73% Standard Deviation 0,2033 0,1703 0,1201 0,1198 0,1036 Dispersion Index 47,4715 90,0734 98,5634 96,8748 75,5013
Source: FEACO Report 2006.
Country
Business
Consulting IT Consulting
Development &
Integration Outsourcing Other Services
The main service line in the European market is business consulting, which includes strategy consulting, organisation/operations management, project management, change management and human resources consulting. The other three service lines have similar market volumes: IT consulting, development & integration and outsourcing. The table also shows that they are not equally weighted in each country’s market. The markets more IT oriented are
Austria, Czech Republic and Hungary. Business consulting is the main consulting service in Slovenia, Italy and Denmark.
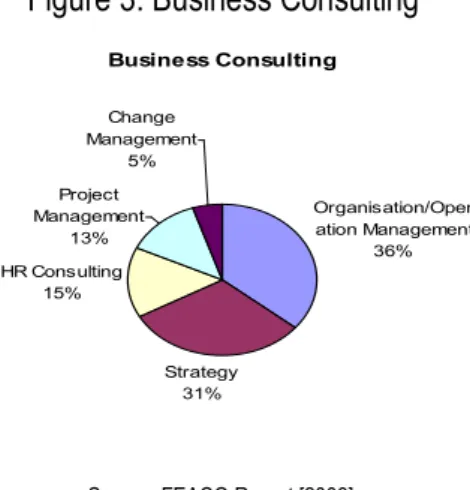
Since the business consulting service line concentrates the largest share of the total turnover, it is important to analyse the different kind of services it includes. The sectors of organisation/operation management and strategy are the most important (see figure 3).
Figure 3: Business Consulting Business Consulting Organisation/Oper ation Management 36% Strategy 31% HR Consulting 15% Project Management 13% Change Management 5%
Source: FEACO Report [2006].
Taking into account the previous assessments of the predominance of IT Consulting, it is surprising that IT comprises only 16% of the total services provided. It is possible that in development & integration and outsourcing some IT services are included. The high value of outsourcing services may reflect the fact that companies prefer to sub-contract the consultancy companies to perform certain operations rather than having a permanent department dedicated to that sector, for instance, to perform the role of the human resources department, as well as IT management.
Kennedy Information (2007) presents the service lines using a different taxonomy: IT consulting, human resources, business advisory services, strategy consulting and operations management consulting.
Figure 4: Share of Western Europe Consulting Market by Service Line, 2007 Business Advisory Service 15% Strategy Consulting 8% Operations Management Consulting 18% Information Technology Consulting 53% Human Resources 6%
Source: Kennedy Information [2007].
According to these results, information technology consulting is largely dominant (53%), followed by operations management consulting (18%) and business advisory service (15%). These conclusions revalidate the predominance of IT services in this region of the industry. Among the top 25 consulting companies in Europe, the first ones are all IT services related: Capgemini, Accenture and IBM Business Global Services.
There is hardly any information available about the types of clients. It is important, in the definition of types of clients, to characterise them according to two features: their type of activity and size. Since the type of clients in each market is changing over time, it is more meaningful and interesting to relate it to the domestic economy than to analyse the evolution over the last years of the types of clients’ weight in each countries economy.
Table 7 regroups the clients in seven main sectors: Banking & Insurance, Manufacturing, Telecoms & Media, Wholesale & Retail, Energy & Utilities, Transport & Travel and Public Sector.
Table 7: Client Sector by Country for 2006 Czech Republic 18,00% 51,00% 6,00% 1,00% 4,00% 8,00% 7,00% 5,00% Denmark 9,00% 42,00% 7,00% 4,00% 4,00% 2,00% 26,00% 6,00% France 31,00% 27,00% 9,00% 6,00% 13,00% 3,00% 10,00% 1,00% Germany 24,00% 39,00% 8,00% 4,00% 7,00% 6,00% 9,00% 3,00% Greece 6,00% 28,00% 3,00% 4,00% 5,00% 4,00% 44,00% 6,00% Hungary 21,00% 10,00% 17,00% 3,00% 11,00% 1,00% 33,00% 4,00% Italy 21,00% 40,00% 8,00% 3,00% 6,00% 2,00% 17,00% 3,00% Poland 2,00% 9,00% 5,00% 3,00% 13,00% 1,00% 54,00% 13,00% Romania 10,00% 16,00% 2,00% 2,00% 25,00% - 45,00% -Slovenia 10,00% 36,00% 18,00% 8,00% 9,00% 4,00% 13,00% 2,00% Spain 26,00% 18,00% 16,00% 4,00% 8,00% 5,00% 17,00% 6,00% Switzerland 32,00% 37,00% 7,00% 4,00% 5,00% 4,00% 8,00% 3,00% United Kingdom 18,00% 27,00% 8,00% 6,00% 9,00% 5,00% 25,00% 2,00% Market 22,00% 32,00% 9,00% 5,00% 8,00% 5,00% 16,00% 3,00% Average 17,54% 29,23% 8,77% 4,00% 9,15% 3,75% 23,69% 4,50% Standard Deviation 0,0953 0,1306 0,0512 0,0183 0,0568 0,0209 0,1584 0,0318 Dispersion Index 54,3223 44,6740 58,3614 45,6435 62,0940 55,8497 66,8561 70,5915 Other Services Energy & Utilities Transport & Travel
Source: FEACO Report 2006
Country Banking & Insurance Manufacturing Telecoms & Media Wholesail &
Retail Public Sector
In Europe the most important consulting clients are banking & insurance, manufacturing and the public sector, accounting together more than 65% of the market. The countries where manufacturing gathers the largest size of clients are Czech Republic, Denmark, Germany, Italy, Slovenia and Switzerland. The Public Sector is the main sector in Eastern European countries like Greece, Poland or Romania and, also, in Denmark. The Banking & Insurance sector, a vital sector especially in the most recent years due to the financial crisis that the global economy is facing, has a bigger weight mainly in Western European countries like Switzerland, France, Spain, Germany and the United Kingdom.
It is more difficult to evaluate the size of the clients although this seems to be closely related to the concentration of the market. In a less concentrated market, with a lot of small and medium size-consultancies operating on it, the clients will probably be more varied. The less concentrated market also reflects the presence of more varied fees practiced by the consultants.
The dispersion indexes for service lines and client sectors, lead to conclusions about the standardization of this industry among European countries. Although they differ from 1998 to 2006, service lines are much dispersed among countries; with business consulting having a relative smaller dispersion index. In the clients sector, there is some convergence: the distribution
of clients between sectors is more similar among countries. The main sectors that seem to have a lower level of dispersion are the biggest ones as manufacturing, financial and public sector.
5.5. The consulting industry at the dawn of the 21st century: some conclusions
The previous characterization of the activity of consultancy in Europe reveals some relevant facts that are worth to highlight.
In each European country, consultancy is at different stages of development and size. Germany and the United Kingdom remain the most mature regions, with the highest turnover values, followed by France, Spain and Italy. The Eastern Europe region is characterised by the higher growth rates.
Kipping and Armbrüster (1999) suggested that consulting industry would follow a trend for increasing standardization, convergence and “Americanization” (meaning the predominance of companies from American origin). However, the previous analysis contradicts this perspective. Not only the European market is still very different among the domestic economies, but also does not display a tendency for convergence. On the contrary, it has become more diverse over the last 10 years. In addition, there has been a process of “Europeanization” when we look to the top consultancy firms. The rising importance of European big firms may have been the result of the mergers and acquisitions in the last decade, as well as the increasing integration of the European market, which may have benefited these firms. Nevertheless, many of these large European firms are absent from the “world league of top consultancy firms”. This is important in several senses. For the sake of brevity, it emphasizes the diversity of the European consulting market, not only in aggregate terms, but also looking at the national diversity within it.
The table below depicts the Kennedy Information (2007) projections for the following years, with the United Kingdom and Germany remaining the main players of the industry and
Table 8: Market Volume (in € Million) and Growth Rate (2006-2010) 2006 2007 2008 2009 2010 United Kingdom Ireland Germany Austria Switzerland France France 12.441,0 13.260,0 14.177,0 15.082,0 15.918,0 6,4% 14,0% Belgium The Netherlands Luxembourg Denmark Finland Iceland Norway Sweden Italy Spain Portugal 87.066,0 93.862,0 100.423,0 107.037,0 113.513,0 100,0%
Sour ce: Kennedy Informatio n [200 7].
14.538,0 15.406,0 6,3% Total Southern Europe 12.069,0 12.862,0 13.703,0 8.731,0 9.251,0 8,2% 8,1% Nordic Region 6.745,0 7.441,0 8.088,0 7.159,0 6.644,0 Benelux 7.622,0 8.127,0 8.630,0 6,8% 7,6% 13,6% 33.323,0 35.386,0 7,2% 31,2% German-Speaking Europe 26.809,0 28.983,0 31.139,0 Region The United Kingdom
& Ireland 22.358,0 24.157,0 25.694,0 27.236,0 28.922,0 6,6% 25,5%
Market Volume 2006-2010
CAGR
Market Share in 2010
6. Conclusion and prospective analysis
In the short term, the future economic conditions may affect the growth trend of this sector. However, the consultancy firms tend to adapt themselves to the specificities of the region and its conditions. As Bernardo (2009) mentioned, there are some sorts of projects that are more specific on a crises scenario such as the strategic reorganization of a company or a merger & acquisition considerations.
In the future, it seems that the most mature European economies are stabilizing and the most growing countries are from Central and Eastern Europe. The major companies enforce [see Águas (2008) and Bernardo (2009)] also that trend in their investment and expansion decisions. They also suggest that the future investments, in a worldwide perspective, will be focused on South America, Brazil, and in Asia, especially China, India and Japan. This may affect the employment market, forcing European skilled workforce to emigrate and work in those countries, since, at least nowadays; they do not have enough human capital available.
The consulting industry will remain very fragmented and dispersed with possible emergence of more specialized ‘boutiques’. As Águas (2009) also mentions, this new era of consulting will favour the raise of network ‘groups’ of consultants, formed by a low number of consultants that share experiences and know-how and work individually in the consultancy projects.
Finally, another possible tendency is the rising importance of internal consulting departments in big companies such are the cases, in Portugal, of Sonae and EDP, although some authors would not consider these services as a substitute for (external) consulting, since they lack the impartial, outside viewpoint, as well as the multiple experiences gained in dealing with similar consulting projects.
References:
Águas, Miguel. 2008. Interview about the management consulting market made by Isabel Clementino in 3 December 2008.
Amorim, Celeste and Kipping, Matthias. 1999. “Selling Consultancy Services: The Portuguese Case in Historical and Comparative Perspective”, Business and Economic History, Volume twenty-eight, no. 2, Fall 1999.
Armbrüster, Thomas and Kipping, Matthias. 2002-03. “Strategy Consulting at the Crossroads”, International Studies of Management and Organization, 32(4): 19-42.
Bernardo, António. 2009. Interview about the management consulting market made by Isabel Clementino in 13 May 2009.
Bom, José. 2009. Interview about the management consulting market made by Isabel Clementino in 14 April 2009.
Curnow, Barry and Jonathan Reuvid. 2003. “The international consulting industry today” in The International Guide to Management Consultancy, eds. Barry Curnow and Jonathan Beuvid, pp. 9-20. London, Kogan Page.
Czerniawska, Fiona. 2002. Management Consultancy: What Next? Palgrave Macmillan.
Dawes, P. L., G. R. Dowling, and P. G. Peterson. 1992. “Criteria used to select management consultants”. Industrial Marketing Management, 21: 187-93.
Drucker, Peter F. 1981. “Why Management Consultants” in The evolving science of management, ed. Melvin Zimet and Ronald G. Greenwood. New York: American Management Association.
Engwall, Lars; Alvarez, José Luis; Amdam, Rolv Petter and Kipping, Matthias (Executive Committee). 2001 (December). The Creation of European Management Practice. CEMP Final Report.
Engwall, Lars and Kipping, Matthias. 2002. “Introduction: Management Consulting as a Knowledge Industry” in Management Consulting: Emergence and Dynamics of a Knowledge Industry, ed. Matthias Kipping and Lars Engwall, 1-16. Oxford University Press.
EUROSTAT Home Page: ec.europa.eu/eurostat
FEACO. Annual reports of the Management Consultancy Market (1997-2006). FEACO Home Page: www.feaco.org.
Fincham, Robin and Clark, Timothy. 2002. “Introduction: The Emergence of Critical Perspectives on Consulting” in Critical Consulting: New Perspectives on the Management Advice Industry, ed. Timothy Clark and Robin Fincham, 1-18. Blackwell Business.
Hair, Joseph F. Jr, Rolph E. Anderson, Ronald L. Tatham and William C. Black. 1998. Multivariate Data Analysis. Prentice Hall, 5th Edition.
Henry, O. 1992. “Entre savoir et pouvoir. Les professionnels de l'expertise et du conseil”, Actes de la recherche en sciences sociales, 95 (December), pp. 37-54.
James, M. 2001. “Multinational management consultancies: World market leaders” in The International Guide to Management Consultancy, eds. Barry Curnow and Jonathan Beuvid, pp. 33-41. London, Kogan Page.
Keeble, D. and Schwalbach, J. 1995. Management Consultancy in Europe. ESRC Centre for Business Research, University of Cambridge.
Kennedy Information, Inc. 2007. Western Europe Consulting Marketplace 2007-2010: Key Trends, Profiles & Forecasts.
Kennedy Information, Inc. 2008. Global Consulting Marketplace 2008-2011.
Kipping, Matthias. 1996. “The U.S. Influence on the Evolution of Management Consultancies in Britain, France, and Germany Since 1945”, Business and Economic History, 25(1).
Kipping, Matthias and Armbrüster, Thomas. 1999.The Consultancy Field in Western Europe. CEMP Report no 6.
Kipping, Matthias. 1999. “American Management Consulting Companies in Western Europe, 1920-1999: Products, Reputation, and Relationship”, The Business History Review, 73(2): 190-222.
Kipping, Matthias. 2002. “Trapped in Their Wave: The Evolution of Management Consultancies” in Critical Consulting: New Perspectives on the Management Advice Industry, ed. Timothy Clark and Robin Fincham, 28-49. Blackwell Business.
Kipping, Matthias and Kirkpatrick, Ian. 2005. “The Development of the Management Consultancy Business: A Co-Evolution Perspective”. Paper presented at the 4th Critical
Management Studies Conference, Cambridge.
Kubr, Milan. 1986. “Nature and Purpose of Management Consulting” in Management Consulting: a Guide to the Profession, 3-20. 2nd Edition, Geneva: International Labour Office.
Kubr, Milan. 1986. “Range and Scope” in Management Consulting: a Guide to the Profession, 3-20. 2nd Edition, Geneva: International Labour Office.
McKenna, Christopher D. 1995. “The Origins of Modern Management Consulting”, Business and Economic History, 24(1).
McKenna, Christopher D. 2006. The World’s Newest Profession: Management Consulting in the Twentieth Century. Cambridge University Press.
McLarty, Roy and Robinson, Terry. 1998. “The Practice of Consultancy and a Professional Development Strategy”, Leadership & Organization Development Journal, 19/5: 256-263.
Rassam, Clive. 2001. “The management consultancy industry” in Management Consultancy, ed. Philip Sadler, pp. 29-59. London, Kogan Page.
Tisdall, P. 1982. Agents of Change: The Development and Practice of Management Consultancy. London: Heunemann.
Top500. 2009. DatenbankKlaus Gebhardt e. K. http://www.top500.de/g0030800.htm (accessed June 2, 2009).
Wright, Robert E. 2008. “Financial crisis and reform: looking back for clues to the future”. The McKinsey Quarterly. December.
Annexes
Annex I: Management Consultancy Market in 1989 – Enterprises, Employees and Turnover
Denmark 367 2,2% n.a. 1.400 n.a. 180,0 1,1%
France 2.600 15,5% 15.100 8.300 6.800 1.310,0 8,3%
Germany 5.900 35,1% 56.400 35.400 21.000 4.300,0 27,3%
Greece 80 0,5% 800 500 300 30,0 0,2%
Ireland 250 1,5% 1.130 680 450 112,0 0,7%
Italy 300 1,8% n.a. n.a. n.a. 600,0 3,8%
Netherlands 200 1,2% 3.400 2.200 1.200 270,0 1,7%
Portugal 170 1,0% 2.550 1.600 950 124,0 0,8%
Spain 246 1,5% 18.000 n.a. n.a. 790,0 5,0%
24,4% 0,0% EEC 11.922 71,0% 130.930 73.130 41.200 11.805,0 74,9% Austria 1.100 6,5% 10.550 6.100 4.450 697,1 4,4% Finland 160 1,0% 1.550 920 630 112,1 0,7% Norway 520 3,1% 4.100 3.000 1.100 374,0 2,4% Sweden 900 5,4% 11.600 9.500 2.100 1.000,0 6,3% Switzerland 2.200 13,1% 17.460 11.490 5.970 1.767,4 11,2% Europe 16.802 100,0% 176.190 104.140 55.450 15.755,6 100,0%
Source: Keeble and Schwalbach (1995). 1.529 United Kingdom 21.400 9.800 3.840,0 Share 31.200 9,1% Number Belgium/ Luxembourg 280 1,7% 2.350 1.650 700 249,0 1,6% Country
Enterprises Employees Turnover
Share Total (in Mill ECU) Supporting
Staff Consultants
Total
Annex II: Statistical Overview of 2006
Austria 2.600 3,51% 26.900 96.654 4,5% 257.294,5 3,4% 1,01%
Belgium 1.050 1,42% 8.700 120.690 10,5% 318.223,0 3,0% 0,33%
Bosnia 50 0,07% n.a. n.a. 11,1% n.a. n.a. n.a.
Bulgaria 60 0,08% 3.000 20.000 7,1% 25.238,2 6,3% 0,24% Czech Republic 407 0,55% 9.200 44.239 4,3% 113.458,5 6,8% 0,36% Denmark 1.993 2,69% 13.100 152.137 22,5% 218.341,4 3,3% 0,91% France 6.560 8,86% 38.500 170.390 12,0% 1.807.462,0 2,2% 0,36% Germany 21.700 29,32% 157.000 138.217 10,2% 2.321.500,0 3,0% 0,93% Greece 202 0,27% 1.800 112.222 11,9% 213.206,7 4,5% 0,09% Hungary 270 0,36% 4.800 56.250 7,6% 90.007,0 4,1% 0,30% Italy 2.500 3,38% 38.000 65.789 12,0% 1.485.377,3 1,8% 0,17% Netherlands 2.700 3,65% 15.000 180.000 18,4% 539.929,0 3,4% 0,50%
Norway 609 0,82% n.a. n.a. 10,7% 268.363,3 2,3% 0,23%
Poland 260 0,35% 6.000 43.333 8,3% 272.088,9 6,2% 0,10% Portugal 1.050 1,42% 15.000 70.000 -4,8% 155.446,3 1,4% 0,68% Romania 260 0,35% 6.500 40.000 30,0% 97.751,0 8,2% 0,27% Slovenia 142 0,19% 2.100 67.619 18,0% 31.013,6 5,9% 0,46% Spain 7.570 10,23% 90.000 84.111 9,8% 982.303,0 3,9% 0,77% Switzerland 744 1,01% 4.000 186.000 9,0% 309.645,3 3,4% 0,24% United Kingdom 20.406 27,58% 95.000 214.800 10,4% 1.938.978,8 2,8% 1,05% Rest of Europe 2.867 3,87% Total 74.000 100,00% 534.600 138.421 11.445.627,8 0,62% Turnover per Employee Country
Sources: FEACO Report 2006 and Eurostat
Market Growth Rate GDP (in Mill €) GDP real growth rate Market Volume / GDP Market Volume (in Mill €) Market
Annex III: Cluster Analysis
Annex III.A: Table for the Cluster Analysis
1 Belgium 0,33 5,3328 30274,14 10,5263 21 8700 2 Bulgaria 0,2377 8,2881 3269,7 2,3264 1 3000 3 Czech Republic 0,3587 8,7313 11067,96 0,58 5 9200 4 Denmark 0,9128 5,2923 40229,03 29,08 2 13100 5 France 0,3629 2,8739 28690,43 3,5978 105 38500 6 Germany 0,9347 1,6404 28160,56 17,8731 136 157000 7 Greece 0,0947 4,6835 19164,34 1,7068 2 1800 8 Hungary 0,3 3,0558 8932,3 6,2659 2 4800 9 Italy 0,1683 2,1993 25282,28 8,6347 21 38000 10 Netherlands 0,5001 3,2042 33055,1 10,5209 21 15000 11 Poland 0,0956 11,3202 7130,76 8,3333 8 6000 12 Portugal 0,6755 2,552 14706,93 0,9709 0 15000 13 Romania 0,266 16,9802 4523,37 34,44 13 6500 14 Slovenia 0,4579 4,5527 15480,81 16,4167 0 2100 15 Spain 0,7706 5,3115 22448,41 39,309 32 90000 16 Switzerland 0,2403 1,9306 41512,27 -12,7461 24 4000 17 United Kingdom 1,0524 3,1042 32105,97 12,7808 107 95000 Country
Source: FEACO Reports (2004, 2005, 2006), EUROSTAT and Top-500.
GDP Average Growth Rate
(2004-06)
# Firms from Top-500 European companies Total Staff in 2006 Market Volume/GDP in 2006 Market Volume Average Growth Rate (2004-06) GDP per capita in 2006 at current prices
Annex IV: Ranking of top consulting firms in Europe in 1997 and in the World in 2007 Table IV.A: The Top 30 Consulting Firms Table IV.B: The Largest Consulting Practice in Europe by Revenue, 1997 in the World by Revenue, 2007
1 2 Andersen Consulting USA
1 2 Andersen Consulting1 USA 1 10 3 PriceWaterhouseCoopers USA/UK
2 - Sema Group F/UK 2 5 9 Deloitte USA/UK
3 10 PricewaterhouseCoopers USA/UK 3 7 6 KPMG USA/UK/NL 4 9 CSC Computer Sciences USA 4 20 8 Ernst & Young USA/UK 5 14 McKinsey & Co. USA 5 14 5 McKinsey & Co. USA 6 7 KPMG International USA/UK/NL 6 2 1 Accenture USA 7 1 Gemini Consulting2 F/USA
7 18 14 Mercer USA
8 20 Ernst & Young USA/UK 8 3 21 IBM GS USA
9 5 Deloitte & Touche (DTT) USA/UK 9 16 - Booz Allen Hamilton USA 10 - A. T. Kearney USA 10 23 12 The Boston Consulting Group USA
11 - CMG UK 11 - 19 Bain & Co. USA
12 23 Boston Consulting Group USA 12 - 24 Towers Perrin USA 13 - PA Consulting Group UK 13 - - Oliver Wyman Group USA 14 18 Mercer Consulting Group USA 14 - 20 Watson Wyatt USA 15 - Roland Berger & Partner D 15 - - Bearing Point n.a.
16 - Arthur D. Little USA 16 - - Aon USA
17 - Sedgwick Noble Lowndes UK 17 - - Grant Thornton USA
18 - AMS USA 18 1 7 Capgemini France
19 - Bain & Co. USA 19 9 4 CSC USA
20 - Watson Wyatt Worldwide USA 20 19 - HP Services USA 21 3 IBM Consulting Group USA 21 4 - Atos Origin France 22 - DMR Consulting Group USA/Japan 22 - 15 Roland Berger Strategy ConsultantsGermany
23 - CEGOS Group F 23 - - FTI USA
24 - Towers Perrin USA 24 - 10 A. T. Kearney USA
25 - Mummert & Partner D 25 - - Navigant USA
1
Accenture is the new name of Andersen Consulting.
2 Capgemini is the new name of Gemini Consulting. Rank
2006 Firm Country of Origin
Source: "Global Consulting Marketplace 2008-2011", from Kennedy Information
Rank 1997 Rank 2007 World Rank 2006 Europe Rank 1997
Europe Firm Country of Origin
Source: Management Consultant International, August 1998.
Annex V: Main definitions From FEACO:
European management consultancy market: EU27, Norway, Switzerland and Bosnia & Herzegovina.
Service Lines Definition:
Business Consulting: services that help organisations to analyse and redefine their strategies, to improve the efficiency of their business operations and to optimize their technical and human resources. It includes: strategy consulting, organisation/operations management, project management, change management and human resource consulting.
Information Technology Consulting: services that help organisations to evaluate their IT strategies with the objective of aligning technology with the business process.
Development and Integration: this service line includes the development of applications (excluding software) and also the deployment and integration of these new applications.
Outsourcing: this service line consists of three main types of activities: IT management services; applied management services; and, business process outsourcing.
Other services: this line includes services as training, studies, recruitment or executive selection. Segmentation of Key Client Industry Sector:
Manufacturing Sector • Consumer Products • Pharmaceuticals • Healthcare
• Automotive Products
• Aerospace and Defense Products • High Tech Products
• Not for Profit Private Sector Banking and Insurance
• All Banking and Financial services • Insurance
Wholesale & Retail Sector Transport & Travel Sector Telecoms and Media Sector Energy & Utilities Sector Public Sector
From Kennedy Information: Service Lines Definition:
Business Advisory Services: consulting services resulting in business recommendations based on financial analysis and alternative decision scenarios. This consulting segment is distinguished within the overall consulting market by its use of rigorous financial analytical processes that measure the effects of economics, tax, investment, risk, competitive and business decision dynamics.
Strategy Consulting: consulting services aimed at improving the long-term growth prospects of a company and the capabilities to enable that growth. These services include mainly strategic planning; organisation strategy; marketing, sales and branding strategy; and financial strategy. Kennedy Information’s definition of strategy consulting also includes portions of IT strategy and planning.
Operations Management Consulting: consulting services that improve the effectiveness of the value chain, including major processes such as researching and designing products and services. Information Technology Consulting – IT consulting – Includes design and construction of IT – related business functions (finance, HR, CRM, supply chain and industry-specific functions); construction, installation and testing of enterprise applications that support those business functions; and infrastructure services that support enterprise applications.
Human Resource Consulting: consulting services aimed at managing employee “lifecycle”, consulting around the people component of change management, and improving the effectiveness of the HR function.
Annex VI: Dispersion Indexes in 1998 for the key service lines and type of clients
µ
σ
= Index DispersionWhere: σ is the standard deviation and µ is the average.
Table VI.A: Dispersion Index of the Market Volume/GDP in 1999 and 2006, in Europe
1999 2006 Austria 0,24% 1,01% Belgium 0,22% 0,33% Bulgaria 0,40% 0,24% Denmark 0,37% 0,91% France 0,22% 0,36% Germany 0,54% 0,93% Greece 0,08% 0,09% Hungary 0,44% 0,30% Italy 0,15% 0,17% Netherlands 0,28% 0,50% Norway 0,48% 0,23% Poland 0,07% 0,10% Portugal 0,42% 0,68% Romania 0,12% 0,27% Slovenia 0,18% 0,46% Spain 0,24% 0,77% Switzerland 0,22% 0,24% United Kingdom 0,66% 1,05% Market 0,37% 0,62% Average 0,30% 0,48% Standard Deviation 0,00166 0,00327 Dispersion Index 0,55903 0,68093
Source: FEACO Reports 1999 and 2006 and GDP from EUROSTAT. Country
Table VI.B: Dispersion Index of Service Lines in 1998, in Europe Austria 34,00% 10,00% 16,00% 12,00% 13,00% 15,00% Belgium 5,81% 47,53% 2,79% 29,35% 2,60% 11,92% Cyprus 6,00% 18,20% 26,30% 7,40% 6,30% 35,80% Denmark 21,20% 24,10% 13,60% 3,30% 9,50% 28,30% Finland 29,00% 26,00% 12,00% 13,00% 6,00% 14,00% Germany 29,70% 26,30% 9,00% 11,00% 13,60% 10,40% Greece 16,61% 11,03% 3,07% 12,18% 17,21% 39,90% Hungary 16,00% 13,00% 11,00% 30,00% 7,00% 23,00% Italy 18,00% 26,00% 9,00% 15,00% 18,00% 14,00% Russia 10,00% 20,00% 15,00% 15,00% 5,00% 35,00% Slovenia 19,61% 17,69% 10,02% 26,18% 16,86% 9,64% Spain 5,50% 73,10% 4,30% 6,40% 5,70% 5,00% Switzerland 25,00% 27,00% 13,00% 8,00% 14,00% 13,00% United Kingdom 17,50% 46,20% 3,70% 11,60% 9,40% 11,60% Market 20,77% 37,45% 6,96% 12,05% 11,06% 11,71% Average 18,14% 27,58% 10,63% 14,32% 10,30% 19,04% Standard Deviation 0,0918 0,1726 0,0634 0,0839 0,0509 0,1124 Dispersion Index 50,5880 62,5916 59,6466 58,6217 49,4649 59,0262 Production management Other Country Strategy & Organisation IT Human Resources Financial/admi n systems
Source: FEACO Report 1998.
Table VI.C: Dispersion Index of the Client Sector in 1998
Austria 8,00% 44,00% 9,00% 2,00% 8,00% 29,00% Belgium 6,89% 12,59% 1,08% 16,73% 17,79% 44,92% Cyprus 2,25% 32,90% 12,80% 10,40% 20,15% 21,50% Denmark 1,33% 12,36% 2,20% 1,20% 47,70% 35,21% Finland 12,00% 13,00% 4,00% 18,00% 7,00% 46,00% Germany 6,60% 32,10% 8,60% 19,30% 10,60% 22,80% Greece 15,61% 9,37% 3,46% 6,15% 57,34% 8,07% Hungary 31,00% 15,00% 15,00% 14,00% 8,00% 17,00% Italy 17,00% 23,00% 6,00% 26,00% 6,50% 21,50% Russia 26,00% 30,00% 10,00% 5,00% 12,00% 17,00% Slovenia 11,55% 39,56% 10,83% 7,69% 13,47% 16,90% Spain 11,85% 22,01% 1,36% 41,63% 3,67% 19,48% Switzerland 14,00% 25,00% 11,00% 21,00% 12,00% 17,00% United Kingdom 24,30% 11,70% 4,90% 31,70% 9,80% 17,60% Market 15,37% 21,87% 6,13% 25,13% 9,95% 21,55% Average 13,46% 23,04% 7,16% 15,77% 16,72% 23,86% Standard Deviation 0,0878 0,1126 0,0448 0,1170 0,1589 0,1109 Dispersion Índex 65,2157 48,8791 62,5084 74,2054 95,0895 46,4831
Country Resources Manufacturing Retail
Financial
Services Public Sector Other Services
Resources: Agriculture, energy&water supplies, mining, metal and chemicals. Source: FEACO Report 1998
Public Sector: EU Commission, national and regional governments, state-owned industries. Services: Transport and communication, health, professional services.