Relationship between Life
Satisfaction and Education in
Portugal
Carlota Sousa Gomes
Dissertation written under the supervision of Pedro Raposo
Dissertation submitted in partial fulfilment of requirements for the MSc in
Economics, at the Universidade Católica Portuguesa, June 2020.
Relationship Between Life Satisfaction and Education in Portugal
Abstract
In this study, we analyze the impact of education on life satisfaction in Portugal.
Our focus is 2018, and we compare it with 2013. We use individual-level data
from the ICOR survey, a panel that was implemented to ensure the Portuguese
participation in the European database called European Statistics on Income and
Living conditions (EU-SILC).
The main conclusions are: Firstly, the education level of each individual has a
positive and significant effect on life satisfaction.
Secondly, this effect of education on life satisfaction had a greater impact on the
older generation (Baby Boomers cohort, individuals born between 1938-1970)
than it has on more recent generations (Generation X cohort, individuals born
between 1971-1979 and Millennials cohort, individuals born between
1980-2000).
Thirdly, it is difficult to distinguish whether the effect comes from the year or
cohort. The ideal exercise would be to compare individuals throughout their lives
and see their satisfaction each year. However, we don’t have data for this. Despite
that, comparing mutual ages caught in different generations (in different years)
we can say that the effect comes from cohort.
Furthermore, after controlling for income and working hours, and after
disentangling the relationship between life satisfaction and education, considering
gender, activity status, civil status, and region, we still find that education has a
positive (and direct) impact on life satisfaction. We interpret this result as
evidence of a ‘‘self-confidence’’ effect from acquiring knowledge or as proof of
how education can strengthen relationships, which is the most important
mechanism that keeps us happy.
Keywords: Life Satisfaction; Education; Portugal; Birth Year Cohort.
Author: Carlota Sousa Gomes
Relação entre a Satisfação com a Vida e a Educação em Portugal
Resumo
Neste estudo, analisamos o impacto da educação na satisfação com a vida em
Portugal. O nosso foco é 2018, e comparamo-lo com 2013. Utilizamos dados
individuais do ICOR, um painel implementado para garantir a participação
portuguesa na base de dados europeia denominada EU-SILC.
As principais conclusões são: Em primeiro lugar, o nível de educação de cada
indivíduo tem um efeito positivo e significativo na satisfação da vida.
Em segundo lugar, esse efeito da educação na satisfação com a vida tinha um
impacto maior na geração mais antiga (Baby Boomers, indivíduos nascidos entre
1938-1970) do que nas gerações mais recentes (Geração X, indivíduos nascidos
entre 1971-1979 e Millennials, nascidos entre 1980-2000).
Em terceiro lugar, é difícil distinguir se o efeito vem do ano ou da geração. O
exercício ideal seria comparar indivíduos ao longo das suas vidas e ver a sua
satisfação a cada ano. No entanto, não temos dados para isso. Apesar disto,
comparando idades mútuas capturadas em gerações diferentes, podemos dizer que
o efeito vem da geração.
Além disso, depois de controlar a renda e o horário de trabalho, e de desembaraçar
a relação entre educação e satisfação com a vida, considerando género, estado de
atividade, estado civil e região, ainda descobrimos que a educação tem um
impacto positivo (e direto) na satisfação com a vida. Podemos interpretar esse
resultado como evidência de um efeito de 'autoconfiança' na aquisição de
conhecimento ou como prova de como a educação pode fortalecer
relacionamentos, o mecanismo mais importante que nos mantém felizes.
Palavras-Chave: Satisfação com a Vida; Educação; Portugal; Coorte do Ano de
Nascimento.
Autor: Carlota Sousa Gomes
Acknowledgements
I would like to thank my master thesis supervisor Pedro Raposo for the
commitment and dedication provided during the process of writing this
dissertation. This would not have been possible without his feedback and
assistance.
I further want to express my deepest gratitude to my parents, grandmother, and
brother for the dinner discussions on the topic of this dissertation and all
motivation.
Finally, I must thank my friends for all the support and encouragement throughout
the entire process.
Table of Contents
Abstract ...i Resumo ... ii Acknowledgements ... iii 1. Introduction ... 1 2. Literature Review ... 42.1. Why study Happiness ... 4
2.2. Education and Life Satisfaction... 5
2.3. The Portuguese Educational System ... 6
3. Is it really Education? ... 8 4. Data ... 10 4.1. Sample Selection ... 10 5. Empirical Analysis ... 15 5.1. Methodology ... 15 5.2. Empirical Model ... 15 6. Results ... 16 6.1. Main Results ... 16 6.2. Age/Year or Cohort? ... 18
6.3. Education or Income/Working Hours? ... 20
6.4. Disentangle the Impact of Education ... 21
6.4.1. Gender ... 21 6.4.2. Activity Status ... 23 6.4.3. Civil Status ... 26 6.4.4. Region ... 28 7. Conclusion ... 29 References ... 32 Appendix ... 34
List of Figures
Figure 1: Mean Life Satisfaction by Education Level ... 3
Figure 2: Changes in the structure of the Portuguese Education System ... 8
List of Tables
Table 4.1: Descriptive Statistics ... 11Table 6.1: Empirical Findings ... 17
Table 6.1.1: Effect of education on same ages (39-42 years old) in 2013 and 2018 for the Generation X cohort (individuals born between 1971-1979) ... 19
Table 6.1.2: Mutual ages in the Generation X cohort and in the Millennials cohort (33-38 years old)... 19
Table 6.1.3: Mutual ages in the Generation X cohort and in the Baby Boomers cohort (42-47 years old)... 20
Table 6.2: Gender ... 22
Table 6.3: Activity Status ... 24
Table 6.4: Civil Status ... 27
Table 6.5: Region ... 28
List of Appendix
Figure A.1. Main Portuguese Legislation concerning the Evolution of the Education System ... 34Figure A.2. Portuguese Legislation concerning the evolution of the Minimum Working Age ... 34
Figure A.3. Portuguese Legislation concerning the evolution of Retirement Age ... 35
Figure A.4. Population Distribution of Our Sample and Censos 2011 ... 36
Table A.1 Empirical Findings 2018 ... 37
Table A.2 Empirical Findings 2013 ... 38
Table A.3: Activity Status by Birth Year Cohort ... 40
1 1. Introduction
In recent years, there has been an increase in interest in the economics of happiness. Life Satisfaction is generally considered an ultimate goal of life, everybody wants to be happy (Frey & Stutzer, 2002). Education gives a relative position in society, but it includes much more (knowledge, income, personal and professional fulfillment, etc.). In this study, we want to understand the mechanism by which the education level affects satisfaction with life.
Blanchflower & Oswald (2004) explored the economics of happiness, through the estimation of micro-econometric well-being equations. The authors studied what people in the US (GSS data) and Great Britain (Eurobarometer Survey series) reported when asked questions about how happy they feel and how satisfied they are with life.
In their paper, they found a positive relationship between each additional education level and life satisfaction. An economist might have predicted that this would occur because schooling would act as a proxy for earnings. To explore this, the authors dropped income and replaced with year dummies, to pick up the nominal price level. Their analysis revealed that it couldn’t be an earnings effect. The non-economic variables in happiness equations enter with large coefficients, relative to that on income. One of these variables is education, which was playing a role independently of income. They also concluded that reported well-being is greatest among women, married people, and it is low among the unemployed.
While economists since Adam Smith recognized the importance of education as a type of private or social investment, only recently have economists undertaken a rigorous conceptual and statistical examination of the evidence on costs, returns, and rates of return to education (Mincer, 1984). The author found that costs of education consisted not merely of tuition and other school expenditures, but also of foregone earnings: the loss of what the student could have earned if he had spent the school years in paid employment instead. Beyond early schooling, foregone earnings are the largest component (over a half) of schooling costs. Further schooling is encouraged if the internal rate of return on schooling exceeds the rate of alternative investments.
Employers pay higher wages to more educated workers because their skill and productivity are seen and experienced as greater than those of less educated workers. Increases in demand favoring more educated workers raise the rate of return on schooling. Despite this, education
2 itself may be attractive and it may enhance future enjoyment of life, apart from the monetary gain (Mincer, 1984).
Psacharopoulos & Patrinos (2004) argued that the earnings of educated individuals do not reflect the external benefits that affect society. These benefits are known as externalities or spillover benefits since they spill over to other members of the community. In the case of education, some studies (Haveman & Wolfe 1984) have succeeded in identifying positive externalities.
The sheer provision of education to groups, mainly in the form of basic education, is bound to improve their social position. Thus, efforts to include subordinated groups in formal schooling can result in ‘social mobility’ for participating individuals (Psacharopoulos, 1993).
Education has been recognized as one of the most important means of determining and improving one’s social and economic position (Mincer, 1974).
Our research intends to find the correlation between life satisfaction and education in Portugal and its variation between 2013 and 2018. Our focus is 2018, and we compare it with 2013. We want to know if education is related with life satisfaction, as it is in Blanchflower & Oswald (2004) and Mincer (1984) studies.
As the educational system in Portugal has suffered several changes over the years,1 it is
important to understand how the education level in each birth year cohort affects the satisfaction level with life. Each birth year cohort includes differences in the education system but also includes much more: in 2013 and 2018 different ages, therefore, different stages of life but also other specificities (some lived under a dictatorship, others lived under the fastest-growing phase). Hence, we want to realize the different impacts of this correlation by cohort.
We distinguish three birth year cohorts, each of them has a different number of years of compulsory education:2 Baby Boomers cohort (individuals born between 1938-1970);
Generation X cohort (individuals born between 1971-1979) and Millennials cohort (individuals born between 1980-2000).
A birth year cohort is a group of individuals born in the same year or period. The technique is labeled a “synthetic” cohort technique to distinguish it from a “panel” study in which an
1See Chapter 2.3: The Portuguese Education System.
3 identical group of individuals is followed over their life course (Easterlin, 2000b). The author concluded that over the life course, happiness appeared to be remarkably constant in the population. There were, however, persistent differences among population groups – more educated people happier than less educated.
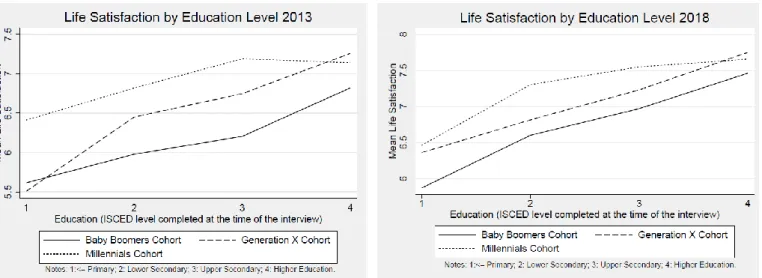
To motivate our research, Figure 1 shows the mean life satisfaction3 by education level in 2013
and 2018, respectively. As we can see from the figure, different birth year cohorts, have different education levels, and report different levels of life satisfaction.
The dataset used for this study is the ICOR survey, which is a panel that was implemented to ensure the Portuguese participation in the European database called European Statistics on Income and Living conditions (EU-SILC). The Portuguese participation is assured by INE (Instituto Nacional de Estatística) since 2004 (one of the oldest), on an annual basis.
This thesis is organized as follows. In chapter 2, we have the literature review where we will cover all the theoretical lessons about the main issues raised from the research question. In chapter 3, we will question whether the relationship comes from the effect of education level. Following, in chapter 4 and 5, we will present the data and the methodology used throughout this project to collect the necessary data. This data will be analyzed in chapter 6, where the major results will be presented. Finally, in the last section we will be able to find the major conclusions and limitations of this study.
3 Life Satisfaction: Is measured on a scale of 0 (“not satisfied at all”) to 10 (“fully satisfied”), from the answer to
the following question ‘All things considered, how satisfied you say you are with your life?’ (see Chapter 4.1).
Figure 1: Mean Life Satisfaction by Education Level in 2013 and in 2018.
4 2. Literature Review
2.1. Why Study Happiness?
For the last years, neoclassical economists have inferred that the utility individuals derive from goods and services comes from the decisions they make in their market behavior. If individuals are rational, fully informed and seek to maximize utility, then the choices they make are those that maximize expected utility. However, economists and psychologists have become increasingly concerned that preferences are often not a very good guide of the well-being associated with the consequences of choices and are turning to alternative ways of thinking about and measuring utility (Dolan et al. 2008).
The economics of happiness is the study of a country’s quality of life, which combines the techniques typically used by economists with those more commonly used by psychologists. The level of happiness reported by people depends on its actual context, and on each conception and dimension of happiness.
The subject of happiness has become increasingly popular among economists after the paper by Easterlin (1974) suggested how the main objective function to be maximized by policymakers should be happiness rather than economic growth, income, or consumption. If so, then it will not always be enough to guarantee the satisfaction of preferences. The sense of happiness adapts itself to changes in the level of income, along the life cycle course, but it depends on factors like socioeconomic status or the educational level (Easterlin, 1974).
Clark et al. (2008) developed the idea that the growing economics of happiness literature is proof of the fact that an increasing number of economists believe that self-reported well-being data contain valuable information that can complement our understanding of individual behavior.
With this self-reported well-being data, it is possible to get indications of individuals’ evaluation of their life satisfaction or happiness. One might ask the definition of happiness, Veenhoven (1991) recognize it as the degree to which an individual judge the overall quality of his or her life as favorable. It refers to satisfaction with life-as-a-whole, covers past, present, and anticipated experiences. All things ever experienced are not given equal weight in the evaluation.
5 In several studies (Frey & Stutzer 2002; Clark, Frijters & Shields 2008), concerning the main findings of the economics of happiness in different countries and time periods, the authors have addressed the determinants of life satisfaction and have considered socio-demographic characteristics such as age, gender, education, health, being part of a couple and other sources of life satisfaction perception.
The conclusions seemed to point out that younger and older people were happier than middle-aged people (Frijters & Beatton 2012); women were slightly happier than men (Alesina & MacCulloch 2004); couples with and without children were happier than single individuals (Frey & Stutzer 2002); people with worse health tended to be more unhappy (Frey & Stutzer 2002); unemployed and inactive people were on average the least satisfied compared with full-time employed (Blanchflower & Oswald 2004); and people with higher education levels, reported the highest rates of life satisfaction (Blanchflower & Oswald 2004; Putman 2001).
2.2. Education and Life Satisfaction
“Education is a service that transforms fixed quantities of inputs (individuals) into individuals with different qualities.” (Hanushek, 1986). Education is not only an economic resource enabling people to get satisfying and better paid jobs, it has value in itself.
However, scientific studies have diverse opinions. Some researchers found a positive relationship between educational attainment and life satisfaction on an individual level (Blanchflower & Oswald, 2004; Becker, 2009), others found a negative relationship (Clark and Oswald,1994).
Clark and Oswald (1994) argued that people with high education experience a larger decrease in their subjective well-being due to unemployment than employees with low education. Education may interfere with subjective well-being if it leads to expectations that cannot be met.
Education has both immediate and long-term positive effects on self-reported happiness. Blanchflower & Oswald (2004) estimated “happiness equations”, in regressions that relate self-reported well-being to individual characteristics. They found that an individual’s education may
6 have a positive effect on the happiness of others, in which case self-interested individuals may tend to under-invest in education, from a social point of view.
For Becker (2009), education is a way of investing in human capital. It should be seen as an investment decision, where current income opportunities are renounced in exchange for improved future income. Considering the Human Capital Theory, education is not a personal benefit (increase in wages) but is a way of creating social benefit due to the positive externalities associated with it.
2.3. The Portuguese Educational System
Over the years, the educational system in Portugal has suffered several changes. The number of years of compulsory schooling increased. That explains why individuals born in different generations have different education levels. Thus, the education level in each generation has a different impact on satisfaction levels.
In 1960, compulsory primary schooling was extended from three to four years4 (via a
differentiated procedure for boys and girls, in two distinct phases) for individuals aged 7 to 12 years old.
In 1964, it was extended to six years,5 targeting the entire school population up to the age of
14, with Primary School attendance (4 years) followed by Lyceum 1st level (2 years).
For those wanting to pursue their studies at the secondary level two tracks were available: General Education, which consisted of a first cycle of five years (3 years of Lyceum 2nd level
and 2 years of General Secondary), after which students could apply for universities. And Vocational Education, which had a first cycle of three years (Vocational 2nd level) and 2 years
of Vocational Secondary.
General Education was mainly available in urban areas thus accessible by privileged social classes and was largely oriented towards higher education. Vocational Education targeted mostly students leaned to learn an occupation and was seen as less prestigious given the lower social status of its students (Oliveira, 2014).
In 1973, the Veiga Simão’s Reform6 introduced the idea that education should be made
accessible for everyone on a meritocratic basis, hence regardless of one’s socioeconomic
4Decree-Law no. 42/994, from May 28th,1960. 5 Decree-Law no. 45/810, from July 9th, 1964. 6 Law no. 5/73, from July 25th,1973.
7 background, fulfilled a function of social improvement. Although this reform had not been fully enforced due to the Revolution of April 25th, 1974, it promoted a turning point in education policy in the seventies (Stoer, 1982).
In 1975 the distinction between general and vocational secondary education was abolished to reduce social differences and favor equal opportunities. Lyceum 2nd level7 and General Upper
Secondary were created (3 years). As is typical for revolutions, this was a chaotic period. In practice, a student may have started in the unified system and finished in the dual system (Hartog, Raposo & Reis 2018).
Secondary graduates had 3 years of general education (Lyceum 2nd level) and 3 years of upper
secondary education, and the last year, set up in 1977, was called the introductory year.8 It takes
12 years of schooling to graduate, but the labor market entry age was still 18, as school started one year earlier, at age 6.
Two attempts to reintroduce vocational studies in the system were made in the eighties. The first took place in 1980 when the introductory year was replaced by the creation of the 12th grade,9 which completed the final cycle of secondary education and functioned as the
foundation year before entering higher education.
The second was in 1983. The need for qualified workers and an employment policy for young adults led to the creation of technical-professional courses, which were taught after the 9th year (Seabra’s Reform)10. Those three-year courses correspond to 10th, 11th and 12th years and
grant certificates that offer access to higher education and certificates of technical-professional training that allow students to enter the labor market.
In 1986,11 the year Portugal entered the European Economic Community, the Education Act
established a new general framework for the Portuguese education system. Compulsory education lasted 9 years, with the obligation to attend until 15. The goal was to provide basic education divided in three connected cycles and a post-compulsory education which, on one hand, was the continuation of the 3rd cycle and, on the other, offered the transition to higher education or the labor market. An overview of the Portuguese legislation in education matters can be found in Figure A.1 (Appendix).
7 Decree-Law no. 260-B/75, from May 26th,1975. 8 Decree-Law no. 491/77, from November 23rd,1977. 9 Decree-Law no. 240/80, from July 19th,1980.
10 Despacho Normativo no. 194 194 A/83, from October 21st, 1983. 11 Law no. 46/86, from October 14th, 1986.
8 We can see in Figure 2 the changes in the structure of the Portuguese educational system, based on its legal and institutional arrangements. We distinguish the evolution of the educational school system in three cohorts, during the period of our sample:
We can conclude that having a secondary education in 2000 is not comparable to having it in 1938, for example. This clarifies why an individual with higher education and born between 1938-1970 (Baby Boomers cohort) has a higher satisfaction level than an individual with primary education and born between 1980-2000 (Millennials cohort).
3. Is it really Education?
The coefficient on education is receptive to the inclusion of other variables within the model. Given the amount of time people spend at work, when asked to answer the question ‘All things considered, how satisfied you say you are with your life?’, work has a great weight in the answer to this question. Therefore, it is important to realize if the effect of education level on life satisfaction, is really direct, or if it could be through control for the average number of hours worked per week or income.
Clark (2005) used cross-section (the ISSP) and panel data (the BHPS) to analyze the job values and job outcomes over the 1990s in OECD countries, to see the change in overall job satisfaction. The author utilized multivariate analysis, regressing the job outcome variables in
9 both datasets on standard demographic controls, including year dummies. Job outcomes were measured using self-reports from workers. Five job satisfaction questions were asked of those in employment: Satisfaction with Pay, Hours, Work Itself, and Job Security, followed by a question regarding overall job satisfaction.
The main findings are that there has been no decline in overall job satisfaction for the highly educated, despite favorable movements in hours, wages, and job security. The author found that people are happier if they work fewer hours.
Based on the first wave of data of the GSOEP collected in East Germany, using ordinary least squares estimation with individual fixed effects, Meier and Stutzer (2008) found an inverse U-shaped curve between life satisfaction and working hours (including when fixed effects are controlled for) suggesting that well-being rises as working hours rise, and increases significantly according to years of education, however, only up to a point before it starts to drop, as working hours become excessive.
Therefore, we want to analyze whether it is, in fact, the education level that influences the satisfaction level in Portugal or whether it is an indirect effect, after we control for one of these measures of job outcomes: working hours. We use a self-report number of actual hours usually worked per week in the main job.
The relationship between income and happiness has been one of the most discussed and debated topics in the literature on subjective well-being since the early 1970s. While there is a firm consensus based on both cross-sectional and longitudinal data that unemployment leads to a substantial loss of life satisfaction regardless of the exact definition of life satisfaction, the relationship between income and satisfaction is less clear.
Frijters et al. (2004) contributed to this literature by investigating how life satisfaction changed as a result of a large-scale exogenous shock, the German reunification. The authors established the role of the increased real household income in improving life satisfaction, by applying a conditional fixed-effect ordinal estimator to their measure of life satisfaction using data from the German Socio-Economic Panel (GSOEP) over the period 1991 to 2001.
As with previous studies for other countries, Frijters et al. (2004) found that income was a very important predictor of life satisfaction. Their decomposition results suggested that around 35– 40 percent of the increase in life satisfaction in East Germany was attributable to the large
10 increase in real household incomes. Due to this increase, the more highly educated saw greater satisfaction growth over the decade than the less educated.
Clark and Oswald (1996) used the British Household Panel Study (BHPS) to calculate income levels using a standard form of the Mincer earnings equation. The authors found that workers’ reported satisfaction levels are negatively related, in ordered probits, to their earnings levels. Also, they found that holding income constant, satisfaction was declining in the education level. This result makes sense since highly educated people have higher job expectations, which are more difficult to fulfill. Individuals are called “over-schooled” when they hold a job that does not require the level of schooling they have attained. Also, in comparison with people who have the same education level, but higher salaries can produce a negative effect.
Therefore, in this context, it is relevant to investigate whether it is, in fact, the education level that influences the satisfaction level or whether it is through controlling income.
4. Data
4.1. Sample Selection
The dataset used for this study is the ICOR survey, which is a panel that was implemented to ensure the Portuguese participation in the European database called European Statistics on Income and Living conditions (EU-SILC). This database was created with the aim of obtaining indicators on income, living conditions, and social exclusion, comparable between various European Union countries. The Portuguese participation is assured by INE (Instituto Nacional de Estatística) since 2004 (one of the oldest), on an annual basis. ICOR has the particularity of being a rotating panel.
Two ad hoc collections on well-being were carried out: a cross-sectional data for the years 2013 and 2018 in Portugal, concerning individual characteristics such as life satisfaction, gender, birth year, region, education, civil status, and activity status. Our focus is the year 2018, and we compare it with the year 2013.
The sample under analysis includes 5,007,688 individuals (7,854 observations) in 2013 and 5,629,903 individuals in 2018 (18,495 observations). Individuals are between 18-80 years old, are employed (working full-time and part-time, self-employed full-time and part-time), retired,
11 unemployed or inactive. The last group includes students (older than 18), permanently disabled, in the compulsory military, fulfilling domestic tasks, and other inactive people.
Although not all the inhabitants of Portugal are included, when compared to the 2011 Census,12
from a regional point of view, our sample has more people in Alentejo and Lisbon. From the educational point of view, our sample has more people with lower or primary education and upper secondary in both years and higher education in 2018. We can argue that this sample is representative based on the 2011 Census.
The descriptive statistics of our variables are as follows:
Life Satisfaction: Is the dependent variable in regressions and is measured on a scale of 0 (“not satisfied at all”) to 10 (“fully satisfied”), from the answer to the following question ‘All things considered, how satisfied you say you are with your life?’. Represents a report of how a respondent evaluates his or her life taken as a whole. The term ‘life’ is intended here as all areas
12 See Figure A.6 in the Appendix (Population Distribution of Our Sample and Censos 2011).
2013 2018
Variable Mean Std.Dev. Mean Std.Dev.
Life Satisfaction 6.210 2.388 6.670 2.244 Generation X Cohort (1971-1979) 0.203 0.402 0.179 0.383 Millennials Cohort (1980-2000) 0.177 0.381 0.186 0.389 Lower Education 0.202 0.402 0.179 0.384 Upper Education 0.183 0.386 0.180 0.385 Higher Education 0.166 0.372 0.199 0.399 Income 24847.6 21858.88 25928.15 23107.52
Part-time work hours 0.044 0.206 0.039 0.195
Full-time work hours 0.345 0.475 0.341 0.474
Over-time work hours 0.134 0.340 0.131 0.337
Female 0.543 0.498 0.566 0.496 Male 0.457 0.498 0.434 0.496 Algarve - - 0.411 0.199 Azores - - 0.188 0.136 Centro - - 0.217 0.412 Lisbon - - 0.301 0.459 Madeira - - 0.022 0.146 North - - 0.319 0.466 Unemployed 0.159 0.365 0.071 0.257 In retirement 0.197 0.398 0.315 0.465 Other inactive 0.109 0.311 0.096 0.294 Married 0.638 0.480 0.582 0.493 Widowed 0.049 0.218 0.112 0.316 Divorced 0.084 0.277 0.100 0.300 Observations 5,007,688 5,007,688 5,629,902 5,629,902 Source: ICOR.
12 of a person’s life at a point in time. The variable focuses on how people are feeling "these days" rather than specifying a longer or shorter period. The intent is not to obtain the emotional state of the respondent at the given moment but for them to make a reflective judgment on their level of satisfaction.
The mean life satisfaction of the individuals in our sample was 6.670 in 2018, an increase compared with 6.210 in 2013. It is important to note that 5% of the individuals reported 2 or less, and 5% reported 10. 50% of individuals reported above 7.
Among Member States for which 2018 data were available, the mean life satisfaction increased in 19 Member States since 2013. One of the highest increases was recorded in Portugal (Eurostat 2015).
Throughout this study, we use the terms happiness, subjective well-being, and life satisfaction interchangeably (Easterlin, 2001a).
Education: The educational attainment level of an individual is the highest ISCED level successfully completed, which means being validated by an official qualification recognized by the relevant national education authorities. The education variable presents the following four alternative categories: <= Primary, Lower Secondary, Upper Secondary and Higher Education. In line with international practice, we refer to Primary and Lyceum 1st level as "Primary" and to the next two cycles as "Secondary"; the lower of these two cycles (Lyceum 2nd level and Vocational 2nd level) as "Lower Secondary" and the higher of the two (General Secondary and Vocational Secondary) as "Upper Secondary". We also consider individuals who obtain an advanced degree or post-secondary education: "Higher Education".
School systems usually differentiate among vocational and general tracks. In this study, we do not distinguish between the 2 types of education, only on how these changed over the years. Individuals may have gone straight to work after obtaining their secondary degree or to higher education.
Birth Year Cohort: Is a group of individuals born in the same year or period. We distinguish three birth year cohort, according to mandatory schooling: the 1st group is born between 1938-1970, where six years were the mandatory years of schooling and the entry age was 7.13 We use
13Between 1938 and 1959, compulsory education was three years. In 1960 it became four years and in 1964 six
13 the term Baby Boomers14 for this cohort. The second group corresponds to the individuals born
between 1971 and 1979, with six years of mandatory schooling and 6 as the entry age. It is called: Generation X.15The last group corresponds to the period between 1980-2000 with nine
years of mandatory schooling and six years as the entry age, called Millennials.16The period
under consideration goes up until 2000 because the youngest individuals we have in our sample are at the age of 18 in 2018, meaning that they were born in 2000.
Working Hours: The number of working hours corresponds to the number of hours the person normally works in his/her main job. This covers all hours including extra hours, either paid or unpaid, that the person normally works, but excludes the travel time between home and their workplace as well as the main meal breaks. In this study, we categorized the total hours worked per week into 4 categories: 0 hours (Those who don’t work: students, in retirement, unemployed, other inactive people, absence from work, seasonal workers, etc.), 1 to 30 hours (part-time), 31-40 hours (standard full-time) and 41-99 hours (over-time).
If the total absence from work has exceeded three months, then the person is considered to have a job only if he/she continues to receive 50% of their wage or salary from their employer, otherwise, it is considered as unemployed (0 weekly working hours). If seasonal workers are not at work during the off-season, is also considered as unemployed (0 weekly working hours). A lay–off is classified as unemployed if the person receives less than 50% of their wage or salary from their employer, doesn’t have an assurance of a return to work or has an agreed date of the return for which the date of the return falls after three months. People who work on their own small agriculture farm, who do not sell their products, but produce only for their own consumption are also considered as unemployed (0 weekly working hours).
In 2018, we had 2,747,079 individuals reporting 0 hours of weekly working. 34,676 of which corresponded to seasonal workers, people whose period absence from work exceeded three months and received less than 50% of their wages, people who work on their small agriculture farm and people in a lay–off which received less than 50% of their wage. 2,712,403 corresponded to students, people in retirement, unemployed and other inactive people, 225,999
14 Dates are approximate and there is some overlap because there are no standard definitions for when a generation
begins and ends.
15 16 Dates are approximate and there is some overlap because there are no standard definitions for when a
14 of which never worked in their lives. In 2013 we had 2,384,334 individuals reporting 0 hours of weekly hours.
Total Gross Household Income: Is the aggregate gross income for all household members. Includes the gross employee cash (a monetary component of the compensation of employees in cash payable by an employer to an employee which includes the value of any social contributions and income taxes payable by an employee or by the employer on behalf of the employee to social insurance schemes or tax authorities); the company car; the gross cash benefits or losses from self-employment; pensions received from individual private plans; unemployment benefits; old-age benefits; housing allowances, among others. The mean of gross income in 2018 was EUR 25928.15 and in 2013 was EUR 24847.6.
Activity Status: Is a self-declared current main activity status: The concept of ‘current’ implies
that any definitive change in the activity situation is considered. For instance, if a person has lost a job or has retired recently, or the activity status has otherwise changed definitively, then the situation as of the time of the interview should be reported. This variable presents the following four alternative categories: At work, Unemployed, In retirement, and Other inactive people.
Individuals are considered as workers if they did any work for pay or profit or if they were not working but had a job or business from which they were absent during the reference week. Self-employed individuals with businesses, farms, or professional practices are also considered as workers, even if the company does not make a profit or any sales, does not provide any professional services, or produces anything. People on maternity leave should always be considered as workers.
Civil Status: Is the marital status of each individual concerning the marriage laws of the country. Therefore, it does not necessarily correspond with the actual situation of the household in terms of cohabitation, arrangements, etc. This variable presents the following four alternative categories: Never married; Married; Separated; Widowed and Divorced.
Region: Refers to the Portuguese region of the residence of the household at the date of the interview, according to NUTS II: Alentejo, Algarve, Azores, Centro, Lisbon, Madeira, and North.
Gender: Refers to the sex of individuals. Whether the individual is male or female. In our sample we have 5,905,088 women and 4,732,503 men.
15 5. Empirical Analysis
5.1. Methodology
This study aims to find out the correlation between education level and the reported level of life satisfaction in Portugal, and its variation between 2013 and 2018. Our focus is 2018, and we compare it with 2013. We also want to understand the different impacts of this correlation by cohort. Furthermore, we want to know if education is playing a role independent in reported satisfaction levels, through controlling for income and working hours. To disentangle this relationship between life satisfaction and education, we consider gender, region, civil status, and activity status.
5.2. Empirical Model
This study estimates a model of the following form:
𝑃𝑟[𝑦𝑖 = 0|x] = 𝑃𝑟[𝑦𝑖∗≤ α1] = 𝑃𝑟[xi′β + μi ≤ α1|x] = Λ(α1 − xi′β)
𝑃𝑟[𝑦𝑖 = 1|x] = 𝑃𝑟[α1 < 𝑦𝑖∗ ≤ α2] = Λ(α2 − xi′β) − Λ(α1 − xi′β)
𝑃𝑟[𝑦𝑖 = 10|x] = 𝑃𝑟[𝑦𝑖∗ > α10]
= 1 − Λ(α10 − educationβ1 − birthyear2 ∗ educationβ2 − birthyear3 ∗ educationβ3 − birthyear2β4 − birthyear3β5 − γxi)
The dependent variable yi is Life Satisfaction in 2013 and Life Satisfaction in 2018. It is the level of satisfaction with life, from 0 (‘Not at all satisfied’) to 10 (‘Completely satisfied’). The independent variables are: Education, a discrete variable which takes the following values: 1 (<= Primary), 2 (Lower Secondary), 3 (Upper Secondary) and 4 (Higher Education); Birth Year, a discrete variable which takes the following values: 1 (Baby Boomers cohort, individuals born between 1938-1970), 2 (Generation X cohort, individuals born between 1971-1979) and 3 (Millennials cohort, individuals born between 1980-2000).
The interactions represent existent differences in education level by birth year cohort. The variable xi corresponds to all the additional controls: Income, Working Hours, Gender, Region, Activity Status and Civil Status.
Firstly, we estimated model 1 by OLS. Results are shown in column (1) of Table 6.1. Then, we estimated model 1 by Odds Ratio, results are shown in column (2) of Table 6.1. The estimates resulting from the inclusion of additional variables are presented in columns (3) through (6).
16 Column (3) shows the result of including another variable in our model: Income, which is a continuous variable, xi=Income.
In column (4) the model is added Working Hours, a discrete variable equal to 0 if not working, 1 if part-time work hours, 2 if full-time work hours and 3 if over-time work hours, xi= Working Hours.
Column (5) includes the variable Income and column (6) includes the variable Working Hours. Also, both columns (5) and (6) include all the other variables: Gender, a binary variable equal to 1 if male and 2 if female; Civil Status, a discrete variable which takes the values: 1 (Never married), 2 (Married), 3 (Separated), 4 (Widowed) and 5 (Divorced); Activity Status, a discrete variable which takes the values: 1 (At work), 2 (Unemployed), 3 (In Retirement) and 4 (Other inactive people); and Region:17 Portugal regions where the individual lives (NUTS II): 1
(Alentejo), 2 (Algarve), 3 (Azores), 4 (Centro), 5 (Lisbon), 6 (Madeira) and 7 (North).
6. Results
6.1. Main Results
In this section, we present our main results, concerning the influence of the education level on life satisfaction. In column (1) of Table 6.1, we estimated the model by OLS with separate regressions for 2013 and 2018. Our focus is 2018, and we compare it with 2013. Therefore, we begin the analysis with 2018.
In 2018, the coefficient of Education is positive and statistically significant, thus suggesting that an average increase of 1 unit in the education level leads to an average increase of 0,53 units in life satisfaction, everything else constant. Also, the younger the individuals are, the higher the mean satisfaction levels (see Appendix Table A.1).
However, the negative coefficients of the interactions reveal that the impact of education on satisfaction level is higher for individuals born in the Baby Boomers cohort (1938-1970) than it is for individuals born in the most recent cohorts (Generation X and Millennials). It is negative 0,10) for individuals born in the Generation X cohort (1971-1979) and even more negative (-0,26) for individuals born in the Millennials cohort (1980-2000). The effect of education on
17 satisfaction level for individuals born in a more recent generation has a smaller impact than for individuals born in an older generation.
Notes: Standard errors in parentheses*** p<0.01, ** p<0.05, * p<0.1. Source: ICOR. (1) OLS; (2)-(6) Ordered Logit. (2) Odds Ratio without controls; (3) Odds Ratio controlled for Income; (4) Odds Ratio controlled for Working Hours; (5) Odds Ratio controlled for Income, Gender, Region, Activity Status and Civil Status; (6) Odds Ratio controlled for Working Hours, Gender, Region, Activity Status and Civil Status.
Baby Boomers cohort: individuals born between 1938-1970; Generation X cohort: individuals born between 1971-1979; Millennials cohort: individuals born between 1980-2000.
Then, in column (2) we estimated the model by Odds Ratio18 without controls. The likelihood
of reporting higher satisfaction level increases by 57,4% with each additional unit increase in
18In Table A.1 (Appendix), we have the cut-off points, statistically different from each other, which means that
the ten categories should not be combined. We can say that above 3,64 individuals are extremely satisfied, and between 2,79 and 3,64 individuals are very satisfied. The difference on the left side of the scale (less positive satisfaction level) is smaller, which means that individuals move more quickly to lower satisfaction levels.
(1) (2) (3) (4) (5) (6)
2018 OLS Odds Ratio Odds Ratio Odds Ratio Odds Ratio Odds Ratio
Life Satisfaction Education 0.526*** 1.574*** 1.310*** 1.492*** 1.339*** 1.538*** (0.00103) (0.00136) (0.00127) (0.00134) (0.00137) (0.00143) GenerationX#Education -0.103*** 0.905*** 0.965*** 0.937*** 0.954*** 0.912*** (0.00213) (0.00159) (0.00170) (0.00166) (0.00170) (0.00162) Millennials#Education -0.255*** 0.769*** 0.835*** 0.794*** 0.806*** 0.754*** (0.00242) (0.00157) (0.00172) (0.00163) (0.00168) (0.00156) Constant 5.347*** (0.00213)
Controls NO NO YES YES YES YES
Income NO NO YES NO YES NO
Working Hours NO NO NO YES NO YES
Observations 5,629,902 5,629,902 5,629,902 5,629,902 5,629,902 5,629,902 R-squared 0.108 2013 (1) (2) (3) (4) (5) (6) Life Satisfaction Education 0.381*** 1.350*** 1.126*** 1.280*** 1.176*** 1.352*** (0.00125) (0.00128) (0.0012) (0.00124) (0.00126) (0.00133) GenerationX#Education 0.220*** 1.160*** 1.248*** 1.194*** 1.189*** 1.125*** (0.00243) (0.00212) (0.00229) (0.00218) (0.00220) (0.00207) Millennials#Education -0.160*** 0.847*** 0.938*** 0.872*** 0.879*** 0.819*** (0.00279) (0.00181) (0.00203) (0.00187) (0.00191) (0.00177) Constant 5.226*** (0.00252)
Controls NO NO YES YES YES YES
Income NO NO YES NO YES NO
Working Hours NO NO NO YES NO YES
Observations 5,007,688 5,007,688 5,007,688 5,007,688 5,007,688 5,007,688
R-squared 0.068
18 the education level, everything else constant. However, the option of reporting higher satisfaction level decreases by 9,5% for individuals born in the Generation X cohort, and by 23,1% for individuals born in the Millennials cohort, with each additional education level, holding other variables constant. We can thus conclude that the effect of education on the satisfaction level had a higher impact on older individuals (Baby Boomers cohort, individuals born between 1938-1970) than it has for individuals born in more recent generations.
The same specifications are applied to the 2013 dataset. Despite the different sample in 2013, results are similar. As education increases, the level of satisfaction with life also increases, but this increase is lower than in 2018. Also, the younger the individuals are, the higher the mean satisfaction levels (see Appendix Table A.2).
In the OLS regression, an average increase of 1 unit in the education level leads to an average variation of 0,38 units in life satisfaction, everything else constant. In the Odds Ratio without controls, the possibility of reporting higher satisfaction level increases by 35,0% with an increase in education level, ceteris paribus.
For individuals born in the Millennials cohort, the results are similar to 2018, however less negative for each additional education level, holding other controls constant.
Despite this, the option of reporting higher satisfaction levels in any regression is positive and statistically significant for individuals born in the Generation X cohort, contrary to what happens in 2018.
6.2. Age/Year or Cohort?
As we can see from the previous result, the positive satisfaction level of 2013 for individuals born in the Generation X cohort (1971-1979) became negative in 2018. Is it a matter of having changed in time, a phase of personal life (age) or simply by the generation they were born in?
To understand this effect, we analyze people the same age in 2013 and 2018, born in the same generation (Generation X cohort, individuals born between 1970-1979). These individuals are at the age between 39 and 42. As we can see in Table 6.1.1, for the same age, an additional increase in the education level leads to an increase in the satisfaction level. However, it is lower in 2018. It seems that the differences come from the year19 because, for the same age,
individuals report different satisfaction levels.
19 Notes: Standard errors in parentheses*** p<0.01, ** p<0.05, * p<0.1. Source: ICOR. (1) and (3) OLS; (2) and (4) Ordered Logit.
To understand if the effect comes from the year or generation (birth year cohort), we compare mutual ages caught in different generations. In Table 6.1.2 we compare mutual ages in the Generation X cohort and in the Millennials cohort.
In 2013 an individual born in the Generation X cohort (1938-1970) is between 33-42 years old, and an individual born in the Millennials cohort (1980-2000) in 2018 is between 18-38 years old. The mutual age is between 33 and 38. In Table 6.1.2, as expected, the value for the mutual ages in 2013 is less negative (-7,2%) than in 2018 (-20,6%). We can conclude that the difference comes from the cohort, as we are comparing different generations of the same age (in different years) and find different results.
2013 2018 VARIABLES (1) (2) Life Satisfaction Education 1.643*** 1.608*** (0.0336) (0.0094) Millennials#Education 0.928*** 0.794*** (0.0081) (0.0051) Observations 860 1,272
Standard errors in parentheses*** p<0.01, ** p<0.05, * p<0.1. (1): individuals are between 33-38 years old in 2013; (2): individuals are between 33-38 years old in 2018.
In Table 6.1.3 we compare mutual ages in the Generation X cohort and in the Baby Boomers cohort. In 2018 an individual born in the Generation X cohort (1971-1979) is between 38-47 years old, and an individual born in the Baby Boomers cohort (1938-1970) in 2013 is between 42-75 years old. The mutual age is between 42 and 47. As expected, the value for the mutual ages in 2013 is positive (47,9%) and in 2018 it is negative (-8%). Even at the same age, we have different results. We can conclude that the difference comes from the cohort, as we are comparing different generations of the same age (in different years) and find different results. Table 6.1.2: Mutual ages in the Generation X cohort and in the Millennials cohort (33-38 years old)
2013 2018 VARIABLES (1) (2) (3) (4) Life Satisfaction Education 0.591*** 1.526*** 0.293*** 1.335*** (0.00236) (0.00293) (0.00295) (0.00393) Constant 4.870*** 6.547*** (0.00632) (0.00878) Observations 353,008 353,008 319,391 319,391 R-squared 0.082 0.030
Table 6.1.1: Effect of education on same ages (39-42 years old) in 2013 and 2018 for the Generation X cohort (individuals born between 1971-1979)
20 2013 2018 VARIABLES (1) (2) Life Satisfaction Education 1.299*** 1.600*** (0.0025) (0.0099) GenerationX#Education 1.479*** 0.920*** (0.0118) (0.006) Observations 1,025 2,147
Standard errors in parentheses*** p<0.01, ** p<0.05, * p<0.1. (1): individuals are between 42-47 years old in 2013; (2): individuals are between 42-47 years old in 2018.
As we can see from the previous results, it is really difficult to distinguish whether the effect comes from the year or generation. The ideal exercise would be to compare individuals throughout their lives and see their satisfaction each year. However, we don't have data for this. Despite that, comparing mutual ages caught in different generations (in different years) we can say that the effect comes from the cohort.
6.3. Education or Income/Working hours?
In 2018,20 when we add Income to our model, in column (3) and Working Hours in column (4)
of Table 6.1, the effect of education on satisfaction level is still positive and statistically significant, but it is lower than in the model without controls. Also, the option of reporting higher satisfaction level decreases for individuals born in Generation X cohort (1971-1979) and Millennials cohort (1980-2000), but by a smaller percentage than in column (2), everything else constant.
If in addition to control for Income, we also control for Gender, Region, Activity Status, and Civil Status (column 5 of Table 6.1), the positive and statistically significant effect of education is higher than in the model only controlled for Income. However, the option of reporting higher satisfaction level with each additional education level for individuals born in the Generation X and Millennials cohorts, decreases by a higher percentage, holding other variables constant.
If beyond controlled for Working Hours, we also control for Gender, Region, Activity Status and Civil Status (column 6 of Table 6.1), the positive and statistically significant effect of education is higher than in the model only controlled for Working Hours. However, the option
20 As 2018 is our focus, we begin the analysis this year and after that, we compare it with 2013.
21 of reporting higher satisfaction level with each additional education level for individuals born in Generation X and Millennials cohorts decreases by a higher percentage, ceteris paribus. In 2013, with any control (columns 3,4,5 and 6 of Table 6.1) the relationship between education and life satisfaction is also positive and statistically significant. The highest positive relationship is in column 6 (Table 6.1), controlled for Working Hours, Gender, Region, Civil Status and Activity Status.
Although the effect of education on the satisfaction level is positive and statistically significant when we add controls, we can conclude that education is playing a role independently of income or working hours, as it remains statistically significant, even without these controls.
6.4. Disentangle the Impact of Education
To disentangle the relationship between the effect of education and life satisfaction, another four approaches are performed. Among other approaches of an individual’s social location that have been shown in many studies (Diener et al 1999; Blanchflower & Oswald 2004; Clark & Oswald 1996) to be predictive of life satisfaction are gender, activity status, civil status, and region. What is the impact of education level on life satisfaction when individuals are married, women, unemployed, etc.?
6.4.1. Gender
An important demographic control variable conventionally included in happiness regressions is gender, where women have generally been found to be happier than men (Blanchflower & Oswald 2004).
Clark (1997) focused on gender differentials in job satisfaction in Britain, and, on why women’s satisfaction levels exceed those of male employees. However, as Stevenson & Wolfers (2009) pointed out, despite increased opportunities for women, improved labor market access, and a narrowing gender wage gap, female happiness seemed to be on the decline in the US and many other developed countries, both in absolute terms and in relation to men. This decline in women’s well-being is ubiquitous, and holds for both working and stay-at-home mothers, for those married and divorced, for the old and the young, and across the education distribution.
22 Despite all attempts at gender equality in Portugal (Wall et al. 2017), there is still a difference between men and women concerning reporting job satisfaction levels and overall life satisfaction levels. Does being a woman nowadays have an impact on the relationship between education and life satisfaction?
Notes: Standard errors in parentheses*** p<0.01, ** p<0.05, * p<0.1. Source: ICOR.
The Model is estimated by Ordered Logit. Baby Boomers cohort: individuals born between 1938-1970; Generation X cohort: individuals born between 1971-1979; Millennials cohort: individuals born between 1980-2000.
In Table 6.2, to disentangle the relationship between education level and life satisfaction, we analyze the differences between Gender for 2013 and 2018. We estimated the model by Odds Ratio without controls.21 We can see that education has a positive and statistically significant
impact on life satisfaction for both genders. In 2018,22 the increase in the satisfaction level by
an increase in education level is higher for men than for women (60,2% and 54,3% respectively), everything else constant.
For individuals born in the Generation X cohort (1971-1979), the effect of education on life satisfaction for men is less penalizing than for women (-7,3% and -9,8% respectively). Since women have more factors involved like family, children, and marriage, this result makes sense. For individuals born in the Millennials cohort, the fact that men study one more unit today, reduces his satisfaction by 24,3%, while this impact is less negative for women (-21,6%). We
21 we also added controls to our model, however, the results have not changed.
22 As 2018 is our focus, we begin the analysis this year and after that, we compare it with 2013.
2018 FEMALE MALE Life Satisfaction Education 1.543*** 1.602*** (0.00176) (0.00211) GenerationX#Education 0.902*** 0.927*** (0.00210) (0.00250) Millennials#Education 0.784*** 0.757*** (0.00220) (0.00230) Controls NO NO Observations 3,185,763 2,444,139 2013 FEMALE MALE Education 1.298*** 1.415*** (0.00119) (0.00139) GenerationX#Education 1.192*** 1.133*** (0.00205) (0.00225) Millennials#Education 0.873*** 0.844*** (0.00175) (0.00199) Controls NO NO Observations 2,719,324 2,288,363 Table 6.2: Gender
23 can conclude that the effect of education on the satisfaction level of men born between 1980-2000 (Millennials cohort) is more negative than that of women. Probably due to the increased opportunities for women, improved labor market access, and a narrowing gender wage gap.
The same specifications are applied to the 2013 dataset. Despite the different sample in 2013, results are similar. The increase in the satisfaction level by an increase in education level is higher for men than for women, however with lower values than in 2018.
The option of reporting higher satisfaction levels in any regression is positive and statistically significant for both genders born in the Generation X cohort, contrary to what happens in 2018.23 The results are more positive to women.
For the Millennials cohort, the results are similar to 2018, however less negative for each additional education level, holding other controls constant.
6.4.2. Activity Status
Clark and Oswald (1994) found that highly educated were more distressed than less educated people when these groups were unemployed. Being out of work may be more aversive to the former group because of their higher expectations. Thus, education may interfere with subjective well-being if it leads to expectations that cannot be met.
In this context, it is relevant to investigate whether being employed or unemployed has an impact on the relationship between education and life satisfaction. Are people with higher education levels more likely to be employed? Does the effect of education disappear depending on the main activity status?
24 Notes: Standard errors in parentheses*** p<0.01, ** p<0.05, * p<0.1. Source: ICOR. The Model is estimated by Ordered Logit. Baby Boomers cohort: individuals born between 1938-1970; Generation X cohort: individuals born between 1971-1979; Millennials cohort: individuals born between 1980-2000.
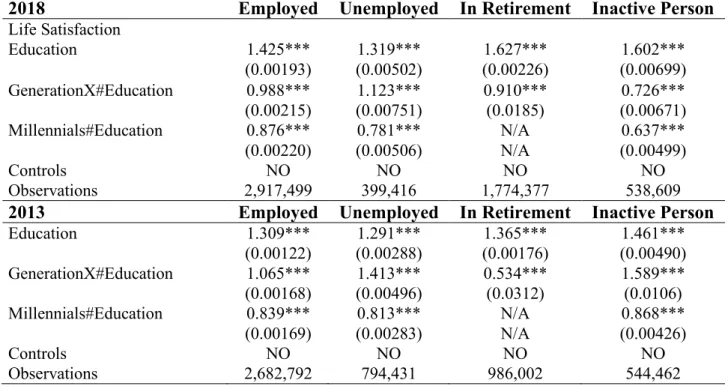
In Table 6.3, to disentangle the relationship between education level and life satisfaction we analyze the differences between the main activity status for 2013 and 2018. We estimated the model by Odds Ratio without controls.24 We can see that education has a positive and
statistically significant impact on life satisfaction for all activity status. In 2018,25 the positive
and statistically significant effect of each additional increase in education level in life satisfaction is higher for individuals in retirement (62,7%) and right after, for inactive individuals (60,2%). The individuals with the lowest increase in happiness are the unemployed ones (31,9%), as we would expect. The possibility of reporting higher satisfaction levels, with an increase in education level, increases by 12,3% for unemployed individuals born in the Generation X cohort (1971-1979), everything else constant. This effect could be interpreted as an opportunity to change their activity status or more time for these individuals to organize themselves. However, it decreases for employed, retired and inactive individuals.
For individuals born in the Millennials cohort (1980-2000), the fact that inactive people study one more unit today, reduces his/her satisfaction by 36,3%, while this impact is less negative for employed and unemployed individuals (-12,4% and -21,9% respectively).
24 we also added controls to our model, however, the results have not changed.
25 As 2018 is our focus, we begin the analysis this year and after that, we compare it with 2013.
2018 Employed Unemployed In Retirement Inactive Person
Life Satisfaction Education 1.425*** 1.319*** 1.627*** 1.602*** (0.00193) (0.00502) (0.00226) (0.00699) GenerationX#Education 0.988*** 1.123*** 0.910*** 0.726*** (0.00215) (0.00751) (0.0185) (0.00671) Millennials#Education 0.876*** 0.781*** N/A 0.637*** (0.00220) (0.00506) N/A (0.00499) Controls NO NO NO NO Observations 2,917,499 399,416 1,774,377 538,609
2013 Employed Unemployed In Retirement Inactive Person
Education 1.309*** 1.291*** 1.365*** 1.461*** (0.00122) (0.00288) (0.00176) (0.00490) GenerationX#Education 1.065*** 1.413*** 0.534*** 1.589*** (0.00168) (0.00496) (0.0312) (0.0106) Millennials#Education 0.839*** 0.813*** N/A 0.868*** (0.00169) (0.00283) N/A (0.00426) Controls NO NO NO NO Observations 2,682,792 794,431 986,002 544,462
25 We can conclude that the effect of education on satisfaction level on employed, retired, and inactive individuals born in the Generation X cohort (1971-1979) and the Millennials cohort (1980-2000) has a smaller impact than for employed, retired, and inactive individuals born in the Baby Boomers cohort (1938-1970). Inactive individuals of both generations are the most penalized. This result makes sense since nowadays, having a degree does not have the same impact as it did in the past.
In 2013 the results are a little different. The positive and statistically significant effect of each additional education level in life satisfaction is higher for inactive individuals (46,1%).
The option of reporting higher satisfaction levels with an additional increase in education level is positive and statistically significant for employed and inactive individuals born in the Generation X cohort (1971-1979), contrary to what happens in 201826 (The results are more
positive to inactive individuals).
For individuals born in the Millennials cohort (1980-2000), the fact that unemployed people study one more unit today, reduces his/her satisfaction by more, while this impact is less negative for employed and inactive individuals, holding other controls constant.
We have different results in 2013 compared to 2018. In 2013 for individuals born in the Millennials cohort, the unemployed ones are the most penalized. As we already have seen before, we can say that the effect comes from the cohort.
In our sample, it is important to consider that the minimum working age has suffered several changes over the years in Portugal, because we found more workers in the Baby Boomers cohort, as they started to work at a younger age. An overview of the Portuguese legislation concerning the evolution of the minimum working age can be found in Figure A.2 (Appendix). It is also important to note that in the past, individuals used to retire at younger ages. An overview of the Portuguese legislation concerning the evolution of the retirement age can be found in Figure A.3 (Appendix).
There are special retirement conditions for people with arduous jobs such as miners, seafarers in fisheries, etc. These professionals may request early retirement within the specific conditions set up for each activity as regards age, and they have to comply with the 15-year record of contributions for Social Security (Eurofound 2019).
26 These special retirement conditions may explain the reason why we observe in our sample in 2018 approximately 5,350 individuals in retirement aged between 39 and 47 (Generation X cohort, individuals born between 1971-1979) and 968 individuals in retirement aged between 18 and 38 (Millennials cohort, individuals born between 1980-2000). In 2013 we observe 1,299 individuals in retirement aged between 34 and 42 (Generation X cohort). See Table A.3 (Appendix).
6.4.3. Civil Status
Another important approach is whether the fact individuals are single or married influences the relationship between education level and life satisfaction. Individuals with higher education levels have the outside option of focusing only on their careers, instead of getting married. Are they happier married?
Stevenson & Wolfers (2009) analyzed job satisfaction, motivated by the observation of the women’s movement for having improved their employment options. These improved market outcomes for women likely improved their bargaining position in the home by raising their opportunities outside of marriage.
The result was that women were less happy with their marriage than men, and women had become less happy with their marriage over time. However, men had also become less happy with their marriage over time, and thus, the gender gap in marital happiness had been largely stable over time.
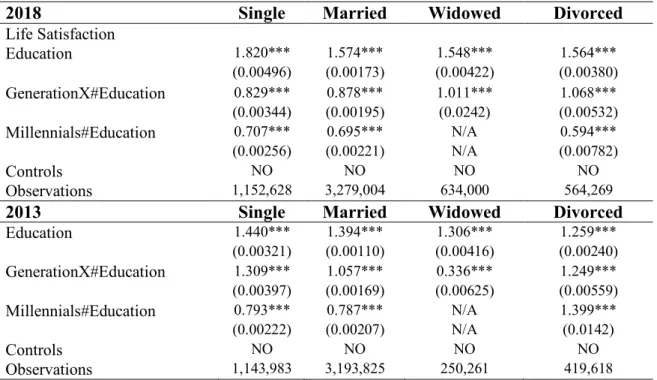
In Table 6.4, we analyze the differences between the civil status of individuals for 2013 and 2018, to disentangle the impact of education on life satisfaction.
The model is estimated by Odds Ratio without controls.27 We can see that education has a
positive and statistically significant impact on life satisfaction for all civil status. In 2018,28 the
positive and statistically significant effect of each additional education level in life satisfaction is higher for single individuals (82,0%) and right after for married individuals (57,4%). The widowed individuals are the ones with the lowest positive effect of education in life satisfaction (54,8%).
27 we also added controls to our model, however, the results have not changed.
27 For the Generation X cohort (individuals born between 1971-1979), the effect is positive and statistically significant for divorced and widowed individuals. This effect could be seen as an opportunity to invest in themselves. The effect of the possibility of reporting higher satisfaction levels with each additional education level is penalizing for single and married individuals born in the Generation X cohort(-17,1% and -12,2% respectively). For the Millennials cohort, the fact that divorced people study one more unit today, reduces his/her satisfaction by 40,6%, while this impact is less negative for married and single individuals (-30,5% and -29,3% respectively).
Notes: Standard errors in parentheses*** p<0.01, ** p<0.05, * p<0.1. Source: ICOR. The Model is estimated by Ordered Logit. Baby Boomers cohort: individuals born between 1938-1970; Generation X cohort: individuals born between 1971-1979; Millennials cohort: individuals born between 1980-2000.
We can conclude that the relationship between the education level and life satisfaction for single and married individuals born in the Generation X cohort (1971-1979) has a smaller impact than for single and married individuals born in the Baby Boomers cohort (1938-1970). And for divorced individuals born in the Millennials cohort (1980-2000) the relationship has a smaller impact than for divorced individuals born in the Baby Boomers cohort (1938-1970).
Turning to 2013, the positive and statistically significant effect of each additional education level in life satisfaction is higher for single individuals, although smaller than in 2018. The divorced individuals are the ones with the lowest positive and statistically significant effect of education in life satisfaction, everything else constant.
2018 Single Married Widowed Divorced
Life Satisfaction Education 1.820*** 1.574*** 1.548*** 1.564*** (0.00496) (0.00173) (0.00422) (0.00380) GenerationX#Education 0.829*** 0.878*** 1.011*** 1.068*** (0.00344) (0.00195) (0.0242) (0.00532) Millennials#Education 0.707*** 0.695*** N/A 0.594*** (0.00256) (0.00221) N/A (0.00782) Controls NO NO NO NO Observations 1,152,628 3,279,004 634,000 564,269
2013 Single Married Widowed Divorced
Education 1.440*** 1.394*** 1.306*** 1.259*** (0.00321) (0.00110) (0.00416) (0.00240) GenerationX#Education 1.309*** 1.057*** 0.336*** 1.249*** (0.00397) (0.00169) (0.00625) (0.00559) Millennials#Education 0.793*** 0.787*** N/A 1.399*** (0.00222) (0.00207) N/A (0.0142) Controls NO NO NO NO Observations 1,143,983 3,193,825 250,261 419,618