Faculdade de Ciências
Departamento de Engenharia Geográfica, Geofísica e Energia
Three‐level energy decoupling:
Energy decoupling at the primary, final and
useful levels of energy use
Zeus Hiram Zamora Guevara
Doutoramento em Sistemas Sustentáveis de Energia
2014
Faculdade de Ciências
Departamento de Engenharia Geográfica, Geofísica e Energia
Three‐level energy decoupling:
Energy decoupling at the primary, final and
useful levels of energy use
Zeus Hiram Zamora Guevara
Tese orientada pelo Doutor Tiago Morais Delgado Domingos e pelo Doutor
João Manuel de Almeida Serra, especialmente elaborada para a obtenção
do grau de doutor em Sistemas Sustentáveis de Energia
2014
“... Delante está el campo, ya verde. Frente al cielo inmenso y puro, de un incendiado añil, mis ojos ‐ ¡tan lejos de mis oídos!‐ se abren noblemente, recibiendo en su calma esa placidez sin nombre, esa serenidad armoniosa y divina que vive en el sinfín del horizonte...”
Juan Ramón Jiménez
Abstract
Reducing the energy intensity of the economy (energy decoupling) is one of the top priorities of the sustainability agenda. As energy is fundamental for every economic activity, any measure to reduce its consumption must be adequately designed so as not to negatively affect economic growth. Primary energy intensity, which is the standard indicator for energy decoupling analysis, has a high degree of aggregation and therefore is unable to give enough information about its components. A close look at this indicator suggests that the analysis of energy decoupling can be improved with an adequate characterization of energy flows. The objective of this thesis is to improve the understanding of energy decoupling by including in the analysis a detailed characterization of the transformation and use of energy flows in the economy. The work consisted of building models that disentangle economic and energy components from primary energy use. To do so, several methodological tools were used: useful work accounting, decomposition techniques, and input‐output analysis. The proposed models successfully deconstruct primary energy use into several components: 1) structure and efficiency of the primary‐to‐final conversion; 3) structure and efficiency of the final‐to‐useful conversion; 3) useful exergy demand composition and intensity; 4) economic structure; and 5) final demand of non‐energy goods and services. Through these models, it is possible to analyze the relative contribution of each factor on energy decoupling (or coupling) in economic systems. The models were applied to evaluate the trends of primary energy use and energy decoupling in Portugal between 1995 and 2010. The country experienced a relative decoupling driven by three main forces: improvements in primary‐to‐final energy conversion efficiencies, reductions in useful exergy intensity and economic structural changes. This study shows that the analysis of energy decoupling can be improved by the inclusion of three levels of energy use, i.e. primary, final and useful. The present thesis contributes to the literature of energy decoupling, energy input‐output analysis and energy‐related decomposition studies.
Acknowledgements
I am grateful to my supervisor, Tiago Domingos, who opened the doors of his research group and provided me with opportunities to conclude this Ph.D. thesis. His trust, advice and encouragement allowed me developing my academic skills and discovering my research path. I would also like to thank Tânia Sousa for her constant support and, especially, for her patience in hearing my ideas in chaotic form and helping me put them into sense. In addition, I thank João Rodrigues, who helped me develop the PF model in Chapter 4 and the study in Chapter 7 and solved most of my doubts about input‐output analysis. Without these three persons this work would not have been possible. This thesis was supported Fundação para a Ciência e Tecnologia and the MIT Portugal Program that provided funding for this Ph.D. research work through scholarship SFRH/BD/51297/2010. I also recognize the financial support by Agência de Inovação through the project Energy Wars (QREN7929). I would also like to thank João Serra and Miguel Brito for their support, especially in the first years of my program. I know the difficulties that you faced while trying to set me in the right path. Moreover, I thank Michal Monit, my classmate, flat‐mate and comrade of various battles, many of which, we failed. I am very thankful to all other members of the Environmental and Energy Research Group at Instituto Superior Técnico for welcoming me as your college and friend. Sorry, for disrupting your life with my Mexican ways. I thank the master students I co‐supervised, André Silvério and Miguel Palma. I am glad that I was able to contribute to your work. Additionally, I would like to thank the members of the Center for Sustainable Energy Systems at Universidade de Lisboa, the MIT Portugal Program community, Terraprima workforce, the Singularity University network and colleagues from the scientific community, with whom I shared valuable time, coursework, conferences, conversations and friendship. Thank you, Alexandra Marques, Ana Gonçalves, André Augusto, André Folgado, André Serrenho, Carlos Silva, Carlos Teixeira, Cristina Marta, Daniel Wiesmann, David Pera, Divya Sornaraja, Esra Khaleel, Filipa Amorim, Filipa Reis, Filipe Serra, Gonçalo Marques (honorary Mexican), Helena Martins, Hugo Campaniço, Isabel Rodrigues, Ivo Costa, Jorge Palma, Joana Abreu, João Santos, Joyce Bettencourt, Lia Laporta, Mário Brito, Miguel Carmo, Nuno Sarmento, Olga Carvalho, Pedro
Rafael Topete, Ricardo Vieira, Sara Manso, Sofia Henriques, Tatiana Valada, Vânia Proença and others that I might forget.
Furthermore, I am grateful to this beautiful country that hosted me for the last four years. I also thank all the people that turn my stay in a valuable learning experience, those I love those I hate. Many thanks to the Mexican community, which helped me endure the difficulties of the distance, and to many domestic and foreign friends, which shared with me their smile. Finalmente, agradezco a mi familia, especialmente a mis tres mujeres‐ternura, los pilares de mi existencia. Ustedes son la razón para despertar cada mañana, para haber llegado hasta donde me encuentro, para caer y luchar, para tener esperanza… Cada palabra de esta tesis es una oración de amor en su nombre.
Contents
1 Introduction... 1 2 Levels of energy use ... 5 2.1 The levels of energy use in the economy ... 5 2.1.1 Primary level of energy use ... 7 2.1.2 Final level of energy use and the primary‐to‐final conversion ... 8 2.1.3 Useful level of energy use and the final‐to‐useful conversion ... 8 2.1.4 Service level of energy use and the useful‐to‐service dissipative transfer ... 9 2.2 Approaches to the analysis of energy flows ... 11 3 Methodological framework ... 15 3.1 Useful work accounting ... 15 3.1.1 The methodology ... 16 3.1.2 Conceptual issues ... 20 3.2 Input‐output analysis ... 20 3.2.1 The basic input‐output model ... 21 3.2.2 The product‐by‐industry approach to input‐output analysis ... 23 3.2.3 Energy input‐output model ... 27 3.3 Decomposition analysis ... 34 3.3.1 The basis of decomposition analysis ... 34 3.3.2 Index decomposition analysis ... 36 3.3.3 Structural decomposition analysis ... 39 4 A structural decomposition model of primary energy use: Primary to final ... 45 4.1 An input‐output model of the energy sector ... 45 4.1.1 Total requirement primary‐to‐final energy matrix ... 46 4.1.2 Direct energy demand ... 47 4.2 The primary‐to‐final energy input‐output model ... 484.2.1 Correspondences with conventional energy input‐output models ... 49 4.2.2 Advantages and issues ... 50 4.3 Structural decomposition analysis with the PF model ... 51 4.3.1 Explanation of factors and decomposition coefficients ... 51 4.3.2 Issues regarding SDA with the PF model ... 54 4.4 Summary ... 56 5 Two decomposition models of primary energy use: primary to final to useful ... 57 5.1 A structural decomposition model of primary energy use: primary to final to useful 57 5.1.1 An input‐output model of the extended energy sector ... 57 5.1.2 The primary‐to–final‐to‐useful energy input‐output model ... 60 5.1.3 Structural decomposition analysis with the PFU model ... 61 5.1.4 Summary ... 63 5.2 An index decomposition model of primary energy use: primary‐to‐final‐to‐useful ... 63 5.2.1 A primary energy intensity model ... 63 5.2.2 The primary‐to‐final‐to‐useful index decomposition model ... 65 5.2.3 Index decomposition analysis with the PU model ... 66 6 The evaluation of energy efficiency trends: Mexico 1971‐2009 ... 71 6.1 Introduction ... 71 6.2 Methods ... 75 6.3 Data ... 76 6.4 Results ... 81 6.4.1 Total final exergy use ... 81 6.4.2 Total useful work consumption ... 83 6.4.3 Energy efficiency trends ... 85 6.4.4 The effect of efficiency on final exergy intensity (producing sectors) ... 87 6.5 Conclusions ... 89 7 The effect of energy and economic transitions on primary energy: Portugal 1995‐2010 .. 91 7.1 Introduction ... 91 7.2 Methods ... 93 7.3 Data ... 94 7.3.1 Economic data ... 94 7.3.2 Energy data ... 94 7.4 Results ... 95 7.4.1 Total primary energy use ... 95
7.4.2 Production structure and energy use ... 96 7.4.3 The total change in primary energy use ... 98 7.4.4 Evolution of primary energy use ... 99 7.4.5 Additional results ... 101 7.5 Conclusions ... 102 8 Three‐level energy decoupling: Portugal 1995‐2010 ... 105 8.1 Introduction ... 105 8.2 Methods ... 106 8.2.1 SDA model ... 106 8.2.2 IDA model ... 106 8.2.3 Decoupling index ... 107 8.3 Data ... 107 8.4 Results ... 108 8.4.1 The total change in primary energy use ... 108 8.4.2 Evolution of production‐related primary energy use... 109 8.4.3 Renewable vs. non‐renewable energy sources ... 112 8.4.4 Energy decoupling ... 113 8.4.5 Additional results ... 115 8.5 Conclusions ... 117 9 The extension to the service level of energy use ... 119 9.1 Primary‐to‐final‐to‐useful‐to‐service model ... 119 9.1.1 A primary energy intensity model ... 119 9.1.2 The primary‐to‐final‐to‐useful‐to‐service energy use model (PFUS model) ... 121 9.1.3 Index decomposition analysis with the PFUS model... 123 9.2 A generic model of energy efficiency indicators ... 125 9.3 Other areas for future research ... 126 9.3.1 Evaluation of emissions ... 126 9.3.2 Energy use responsibility ... 127 9.3.3 Energy sources scarcity constraints ... 127 9.3.4 Redefinition of energy factors in the PFU energy input‐output model ... 127 10 Conclusions ... 129 References ... 133 A. Appendix to Chapter 4 ... 151 A.1 An economy with an independent energy sector ... 151
A.2 An economy with a relatively independent energy sector ... 152 A.3 Validity of the energy sector independence assumption ... 153 B. Appendix to Chapter 5 ... 155 C. Appendix to Chapter 6 ... 157 C.1 Final exergy allocation assumptions ... 157 C.2 Allocation of electric uses ... 160 D. Appendix to Chapter 7 ... 163 D.1 Product and industry classification ... 163 D.2 Energy carriers and technologies classification ... 164 E. Appendix to Chapter 8 ... 167 E.1 Useful work categories ... 167 E.2 Classification of producing sectors and sub‐sectors ... 167
List of Figures
Figure 2‐1 Diagram of energy flows with major energy‐ and efficiency‐related terms ... 6 Figure 2‐2 Global energy flow from the primary to service levels of energy use ... 7 Figure 2‐3 Levels of energy flows (primary to useful) and analysis approaches ... 11 Figure 3‐1 Useful work accounting methodology: Flow diagram ... 17 Figure 3‐2 Input‐output table of interindustry flows of goods ... 21 Figure 3‐3 Make‐use framework for product‐by‐industry data ... 24 Figure 3‐4 Graphical representation of the hybrid‐unit identity in Equation (3.33). ... 28 Figure 3‐5 The sub‐matrices of the hybrid‐unit total requirements matrix ∗ ... 31 Figure 4‐1 Make‐use framework for product‐by‐industry data of the energy sector ... 46 Figure 5‐1 Presentation of useful work accounting output data ... 58 Figure 5‐2 Architecture of the bridge matrix ... 59 Figure 5‐3 Primary‐to‐final analysis path of the PU model ... 68 Figure 6‐1 Final exergy use by energy carrier and per capita: Mexico 1971‐2009 ... 82 Figure 6‐2 Final exergy use by sector: Mexico 1971‐2009 ... 82 Figure 6‐3 Useful work by category and per capita: Mexico 1971‐2009 ... 83 Figure 6‐4 Useful work by sector: Mexico 1971‐2009 ... 84 Figure 6‐5 Useful work shares by category: Mexico 1971‐2009 ... 84 Figure 6‐6 Aggregate final‐to‐useful efficiency: Mexico 1971‐2009 ... 85 Figure 6‐7 Final‐to‐useful efficiencies by sector: Mexico 1971‐2009 ... 85 Figure 6‐8 Final‐to‐useful efficiencies by energy carrier: Mexico 1971‐2009 ... 86 Figure 6‐9 Economic final exergy and useful work intensities: Mexico 1971‐2009 ... 87Figure 6‐10 Evolution of IDA coefficients by the traditional (above) and UW‐based (below) approaches: Mexican industry 1980‐2009 ... 88
Figure 7‐1 Total primary energy use: Portugal 1995‐2010. ... 95
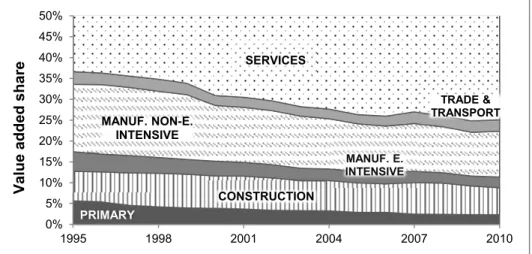
Figure 7‐3 Value added share by industry: Portugal 1995‐2010. ... 97 Figure 7‐4 Primary‐to‐final SDA of production‐related PEU: Portugal 1995‐2010 ... 99 Figure 8‐1 Primary‐to‐final‐to‐useful SDA of production‐related PEU: Portugal 1995‐2010.... 110 Figure 8‐2 Range of decomposition coefficients: Portugal 1995‐2010 ... 111 Figure C‐1 Functional electric uses: Mexico 1971‐2009 ... 161 Figure C‐2 Useful work of total electric use by useful work category: Mexico 1971‐2009 ... 162
List of Tables
Table 3‐1 Exergy factors by energy carrier from Serrenho et al. (2012) ... 17
Table 3‐2 The product‐by‐industry energy input‐output model under the ITA and CTA ... 29
Table 3‐3 Energy and emission SDA studies in the literature (1995‐2014) according to the aggregate indicator and energy input‐output model used ... 42 Table 4‐1 Comparison of different accounting methods on ... 55 Table 5‐1 Characteristics of different energy input‐output models ... 63 Table 6‐1 Categories of energy efficiency indicators, based on Patterson (1996) ... 72 Table 6‐2. Food and feed conversion variables from Wirsenius (2000) ... 77 Table 6‐3 Climate conditions of reference regions. ... 80 Table 6‐4. Characteristic process temperatures ( 2) ... 80
Table 6‐5: IDA coefficients by the traditional and UW‐based approaches: Mexican industry 1980‐2009 ... 87
Table 7‐1 Industrial direct energy intensity in selected years: Portugal 1995‐2010 ... 97
Table 7‐2 SDA coefficients of production‐related PEU: Portugal 1995‐2010 ... 98
Table 7‐3 SDA coefficients of PEU associated with household energy demand: Portugal 1995‐ 2010 ... 98
Table 7‐4 Comparison between methods to account for primary energy equivalent of renewables ... 101 Table 7‐5 Effect of changes in non‐energy transactions of the energy sector ... 102 Table 8‐1 SDA coefficients of production‐related PEU: Portugal 1995‐2010 ... 108 Table 8‐2 SDA coefficients of PEU associated with household energy demand: Portugal 1995‐ 2010 ... 108 Table 8‐3 SDA of changes in total PEU by type of carrier: Portugal 1995‐2010 ... 112 Table 8‐4 Values and growth rate of Portuguese GDP 1995‐2010 (EUROSTAT, 2014a) ... 113 Table 8‐5 Evolution of decoupling index of PEU factors: Portugal 1995‐2010 ... 114
Table 8‐6 Total decoupling index of PEU factors, by carrier and economic sector: Portugal
1995‐2010 ... 115
Table 8‐7 SDA of changes in PEU associated to energy carriers for non‐energy uses: Portugal 1995‐2010 ... 115
Table 8‐8 IDA vs. SDA coefficients of production‐related PEU: Portugal 1995‐2010 ... 116
Table A‐1 Monetary interindustry transactions of an economy with an independent energy sector ... 151
Table A‐2 Energy flows ... 151
Table A‐3 Monetary interindustry transactions of an economy with a relatively independent energy sector (70% independence) ... 152
Table A‐4 Errors between the PF and hybrid‐unit models at different energy sector independence levels ... 153
Table C‐1 Energy sector own use: Final exergy allocation assumptions ... 157
Table C‐2 Industrial sector: Final exergy allocation assumptions ... 158
Table C‐3 Others sector: Final exergy allocation assumptions ... 159
Table C‐4 Transportation sector: Final exergy allocation assumptions ... 160
Table D‐1 Equivalence between the NACE1.1 (59 sectors), NACE2 (65 sectors) and common classifications (49 sectors).} ... 163 Table D‐2 List of energy carriers (P = Primary, S = Secondary and NE = Non‐Energy) ... 164 Table D‐3 List of energy technologies (CG = cogeneration) ... 165 Table D‐4 List of sectors of final energy demand ... 165 Table E‐1 List of useful work categories ... 167 Table E‐2 Sectoral classification for index decomposition analysis of PEU... 167
Acronyms
AARG Annual Average Growth Rate CPA European Classification of Products by Activity CTA Commodity Technology Assumption of the input‐output model D&L Dietzenbacher & Los approach to structural decomposition analysis EEE Economic Energy Efficiency indicators ETEE Economic Thermodynamic Energy Efficiency indicators EU European Union GDP Gross Domestic Product GVA Gross Value Added HTH High Temperature Heat uses IDA Index Decomposition Analysis ISEC Import of Secondary Energy Carriers ITA Industry Technology Assumption of the input‐output model LMDI Logarithmic Mean Divisia Index approach to decomposition analysis LTH Low Temperature Heat uses MTH Medium Temperature Heat uses NACE European Classification of Economic Activities NAFTA North‐America Free Trade Agreement OE Other Electric uses PCM Physical Content Method PEU Primary Energy Use PF Primary‐to‐Final energy input‐output model PFES Primary Fossil Energy Sources PFU Primary‐to‐Final‐to‐Useful energy input‐output modelPFUS Primary‐to‐Final‐to‐Useful‐to‐Service energy use model PSM Partial Substitution Method PTEE Physical Thermodynamic Energy Efficiency indicators PU Primary‐to‐Useful energy IDA model SDA Structural Decomposition Analysis TEE Thermodynamic Energy Efficiency indicators UW Useful Work UWA Useful Work Accounting
Notation
General
, ... A bold lower case Latin letter corresponds to a vector , ... A bold upper case Latin letter describes a matrix. , ∗... A bold Greek letter describes a matrix. , … Non‐bold lower case Latin letters represent scalars or elements of a vector … Non‐bold upper case Latin letters represent scalars or elements of a matrix , ... Non‐bold Greek letters describes a scalar or elements of a matrix. A vector with a hat represents a diagonal matrix, whose diagonal is vector . ′, ′… An apostrophe on a vector or matrix denotes the vector or matrix transpose. Vector of ones (or summation vector) ∗ The superscript * refers to a variable in hybrid units The superscript M refers to a measure in monetary units The superscript S refers to a measure of producing sectors The superscript R refers to a measure of non‐producing sectors Hadamard or element‐wise matrix product Output (in gross output, GDP or GVA)Chapter 1
Exergy or second‐law efficiency First‐law efficiency Exergy factorChapter 3
Section 3.1
Exergy content of final carriers ( – allocated to useful work category )
Useful work amount ( – of useful work category and – economy‐wide)
Second‐law final‐to‐useful efficiency or technical efficiency ( of the final‐to‐useful
energy conversion stage) ( – economy‐wide) Environment reference temperature Temperature at which heat transfer occurs Engine compression ratio Specific heat ratio
Section 3.2
Total output by industry vector Total interindustry transactions matrix Matrix of technical coefficients ( ) Product‐by‐industry matrix of technical coefficients ( ) Final demand vector Value added by industry vector Number of industries Number of energy industries ( ) Number of products /commodities Leontief or total requirements matrix Use matrix Make matrix Final demand by product vector Total output by product vector Product‐output proportions matrix Industry output proportions matrix Matrix of interindustry energy transactions Total energy use vector Energy deliveries to final demand vector Total energy requirements matrix of the hybrid‐unit energy input‐output modelTotal energy requirements matrix of the direct impact coefficient energy input‐output model
Bridge matrix to select energy industry rows from the hybrid ∗
Direct energy intensity matrix
Inverse prices to final demand matrix
∗ ∗ sub‐matrix of energy transactions between energy industries per final energy
demand
∗ ∗ sub‐matrix of direct energy use by non‐energy industries per final demand
∗ ∗ sub‐matrix of transactions from non‐energy to energy industries per final energy
demand
∗ ∗ sub‐matrix of interindustry transactions between non‐energy industries per final
demand
Section 3.3
Aggregate variable ( – of sector Aggregate variable vector Exogenous factors of ( , – of sector Exogenous factors ofDecomposition coefficient of factor with respect to , i.e. the effect of changes in factor on changes in
Decomposition coefficient of factor with respect to
Partial derivative of with respect to factor (exception to the general notation)
Parameters of approximation functions under linear path conditions ( in SDA
Parameters of approximation functions under logarithmic path conditions ( in SDA
Number of exogenous factors
Number of sectors
Time ( and – initial and final instant)
Energy use aggregate ( – of sector Activity mix factor of energy‐related IDA Sectoral energy intensity factor of energy‐related IDA
Chapter 4
Energy use matrix Energy make matrix Matrix of direct energy demand by carrier and by direct demand categoryVector of domestic production of primary energy carriers Vector of imports of primary and final energy carriers Vector of energy conversion losses Vector of total energy output by energy carrier Vector of total energy output by energy technology / industry Number of industries Number of energy technologies / industries ( ) Number of products /commodities Number of energy technologies / industries Number of energy carriers Number of non‐energy sectors of direct energy demand Number of energy carriers Number of primary energy carriers Number of final energy carriers Number of non‐energy‐use energy carriers
Primary energy use vector ( & – production‐related and residential)
Total requirements matrix of the energy sector (Structure and efficiency of the primary‐to‐final conversion stage)
Demand composition of direct (final or secondary) energy matrix ( , & , – production‐related and residential) Direct energy intensity matrix Primary energy intensity matrix Total requirements matrix of the rest of the economy (non‐energy producing sectors) Final demand composition matrix Total final demand or economic scale vector Bridge matrix to select primary energy carrier’s rows from
Direct or final energy demand vector ( , & , – production‐related and residential)
Total output of non‐energy producing sectors vector
Final energy use vector ( & – production‐related and residential)
Inverse prices to final demand matrix
Matrix of primary energy embodied in residential energy demand per energy
Vector of primary energy equivalent coefficients of renewables and imports of final carriers Decomposition coefficient of factor with respect to PEU (equivalent to )
Chapter 5
Section 5.1
Notation of Chapter 4 and Matrix of direct useful work demand ( , – by type of useful work flow) Matrix of final‐to‐useful conversion efficiency ( , – by type of useful work flow) Total requirements matrix of the extended energy sector (Structure and efficiency of the final‐to‐useful conversion stage)Matrix of direct exergy demand ( , – by type of useful work flow and , – by carrier)
Bridge matrix between values by type of useful work flow and by carrier Vector of energy factors by carrier
Demand Composition of direct useful work matrix ( , & , – production‐related and residential)
Useful work demand vector ( , & , – production‐related and residential)
Direct useful work intensity matrix
Section 5.2
Primary energy use ( & – production‐related and residential) Final or direct energy use ( & – production‐related and residential) Final or useful work use ( & – production‐related and residential)
Residential activity level Industry index Household index ̅ Average primary‐to‐final conversion efficiency Exergy factor Average final energy to useful work conversion efficiency Activity mix factor of energy‐related IDA Direct useful work intensity factor of energy‐related IDA Production technology factor of energy‐related IDA Final demand mix factor of energy‐related IDA Economic scale or total final demand factor of energy‐related IDA
Chapter 6
Notation of Section 3.1, Section 3.3 and Section 5.2Chapter 7
Notation of Chapter 4 and Household energy demand composition vector Aggregate energy price Share of energy expenditure in total household expenditure Total household expenditure Effect of the non‐energy transactions of the energy sector on primary energy use Effect of transactions between non‐energy industries on primary energy useChapter 8
Notation of Chapter 4, Section 5.1, Section 5.2 and Decoupling index Number of producing sub‐sectors Number of producing sectorsChapter 9
Notation of Section 5.2 and ̅ Average non‐dissipation efficiency of passive systemsProductive useful work ( & – production‐related and residential)
Average unit price of products ( Average energy price Total output in physical units Energy service requirements, i.e. the ratio of productive useful work used per unit of energy services in physical units Physical energy intensity ( – at the useful level of energy use)
1 Introduction
Any economic system “could not exist without large and incessant flows of energy” (Smil, 2003) as energy is the driving force of any activity and process in nature (Stern, 2011). It is obvious then that when there is no energy, there will not be any economic activity; and when there is energy, it is possible to carry out economic activities. However, the relationship between energy use and the output of these activities is not simple (Ockwell, 2008; Smil, 2000).
Empirical studies have found that, especially after the industrial revolution, the growth of economic output and the increase in energy consumption are strongly linked, i.e. an increase in output corresponds to a proportional increase in energy use (Alam, 2009; Fiorito, 2013; Stern, 2011). Nevertheless, in the last decades, this link has become weaker meaning that economic output grows at a larger rate than energy use (Bithas and Kalimeris, 2013; Goldemberg and Siqueira Prado, 2011; Markandya et al., 2006; Mulder and de Groot, 2004). The latter phenomenon has been referred to as energy – economic growth decoupling (hereby called energy decoupling), which is formally defined as the reduction of the rate of use of primary energy use per unit of economic activity (UNEP, 2011)
Energy decoupling can help reduce the environmental impact associated to the use of energy resources, which is significant at a global scale since energy use accounts for the largest share of anthropogenic greenhouse gas emissions (IPCC, 2007), and has multiple other positive environmental impacts. As most countries (including the largest energy consumers) are dependent on foreign fossil energy sources (IEA, 2010, 2012a), it can also help reduce this dependency, increasing energy security. Moreover, energy decoupling contributes to long term development by reducing the pressure on the limited global reserves of fossil fuels (predominant in primary energy use). In addition, it can also increase the economic competitiveness of an economy (Smil, 2003). Because of these benefits, energy decoupling has become one of the top priorities of the sustainability agenda (Smil, 2000).
Two types of decoupling are distinguished (UNEP, 2011; Wang, 2011): 1) Relative decoupling is when the growth rate of primary energy use is positive but relatively smaller than the growth rate of economic activity; and 2) absolute decoupling when the use of energy resources decreases while economic activity grows. The distinction is relevant since only the latter is related to an absolute reduction of primary energy use (Smil, 2000; UNEP, 2011).
The standard indicator of energy decoupling analysis is primary energy intensity, which is defined as the ratio of primary energy use per unit of economic activity (usually GDP). The use of this indicator for energy decoupling analysis has been criticized on the basis that a single indicator cannot describe the complex relationship between energy use and economic growth (Bithas and Kalimeris, 2013; Coccia, 2010; Fiorito, 2013; Smil, 2003; Sorman and Giampietro, 2011). Another issue regarding this indicator is that it is constructed with two aggregate variables, i.e. total primary energy use and GDP, that have accounting problems on their own (Patterson, 1993; Smil, 2003; Sorman and Giampietro, 2011).
Primary energy intensity contains (in a highly aggregated form) the characteristics of all economic transactions and all physical processes, including energy conversion and use, in the economy. It can provide a general insight on energy decoupling of an economy (Lightfoot, 2007; Smil, 2003). However, it cannot provide information about its components and therefore it can neither act as a reliable predictor of energy decoupling or as a comparison measure between economies (Fiorito, 2013; Smil, 2003).
Smil (2003) argues that the
deconstruction of the measure [primary energy intensity] offers a deeper understanding of underlying realities, uncovers a number of serious data limitations, leads to a careful interpretation of differences in levels and trends, and helps to avoid simplistic, and hence potentially counterproductive, conclusions.
This deconstruction consists of evaluating the main determinants of primary energy intensity, which are eight, based on Liddle (2010), Patterson (1996), Percebois (1979) and Smil (2003): 1) economic structure; 2) degree of energy self‐sufficiency; 3) composition of primary energy supply; 4) composition of direct energy use in production; 5) patterns of residential energy use; 6) efficiency in the conversion and end‐use of energy; 7) country size and climate; and 8) others, e.g. defense spending. Only the analysis of all determinants can give an explanation of the level and changes in primary energy intensity of an economy (Smil, 2003).
Four of the eight determinants of primary energy intensity are directly related to the transformations and use of energy flows in the economy (determinants 3‐6). This suggests that the analysis of energy decoupling can be improved if an adequate characterization of energy flows is included in the analysis. Therefore the objective of this thesis is to improve the understanding of energy decoupling by addressing the following research question: What is the effect on energy decoupling of the characteristics of the transformation and use of energy flows in an economy? To answer this research question, I focus on the numerator of the primary energy intensity (i.e. primary energy use/supply). Thus the present work consists of building models that disentangle the factors related to energy transformation and use from the primary energy use. Three methodological tools were used for the construction of these models: useful work accounting, decomposition techniques and input‐output analysis.
The proposed models successfully deconstruct primary energy use into several components: 1) Structure and efficiency of primary‐to‐final conversion; 3) structure and efficiency of final‐to‐ useful conversion; 3) useful exergy demand composition and intensity; 4) economic structure; and 5) final demand of non‐energy goods and services. It is worth to notice that the models include economic factors that are also considered determinants of primary energy intensity (e.g. economic structure). Moreover, the main contribution of this thesis is that the proposed models allow the analysis of the effect of the different factors on primary energy use and on energy decoupling, which was not possible with existing models in literature.
This thesis is organized in ten chapters, which are briefly described as follows:
Chapter 2 describes the energy flows in the economy according to the primary, final, useful and service levels of energy use. Moreover, the exergy concept is introduced, which allows evaluating the quality of energy flows.
Chapter 3 describes the methodological framework of the present thesis, which consists of three methodologies: 1) useful work accounting; 2) input‐output analysis; and 2) decomposition analysis. In addition, this chapter analyzes the conventional approaches to energy‐related topics of the two latter methodologies.
Chapter 4 presents the development of the primary‐to‐final energy input‐output model. The model allows the evaluation of energy transactions in the economy at the primary and final level of energy use.
Chapter 5 introduces two energy models, which include the useful level of energy use: The primary‐to‐useful IDA model and the primary‐to‐final‐to‐useful energy input‐output model (an extension of the model in the previous chapter). Chapter 6 presents an approach to evaluate energy efficiency trends applied to Mexico 1971‐ 2009. In this chapter, one of the most used approaches to evaluate energy efficiency trends in the literature is improved by including the useful level of energy use. Chapter 7 presents the analysis of primary energy use in Portugal 1995‐2010 with the model in Chapter 4. The analysis gives insight on the effect of energy and economic transitions in the country. Chapter 8 extends the analysis in Chapter 7 and presents the evaluation of energy decoupling in Portugal 1995‐2010 at the primary, final and useful levels of energy use. Chapter 9 describes two specific areas for future research: the extension to the service level and a generic model of energy efficiency indicators. In addition, it presents other general areas for future work. Finally, Chapter 10 presents the main conclusions obtained from this research.
2 Levels of energy use
Every modern industrial society depends on a series of conversion stages of energy resources in nature from less to more usable forms. These conversion stages are carried out to produce a wide variety of goods and services (Alam, 2009; Nakićenović and Grübler, 1993; Smil, 1994; Summers, 1971).
The evolution of these societies is, therefore, linked to the type of available energy resources, the structure of conversion stages and the patterns of energy end‐uses. Consequently, the analysis of these societies should be able to capture the complexity of energy flows (Nakićenović and Grübler, 1993).
Traditionally, the complexity of energy flows is simplified by differentiating three levels of energy use, i.e. primary, final and useful (Section 2.1) (Ma et al., 2012; Nakićenović et al., 1996; Orecchini, 2006; Summers, 1971). Additionally, further insights can be achieved by analyzing energy flows under different energy metrics, e.g. the capacity to produce work or the heat content (Section 2.2) (Ayres, 1998; Nakićenović et al., 1993).
2.1 The levels of energy use in the economy
The levels of energy use describe the flow of energy along all stages of energy conversion and use in the economy. These levels are defined based on the metabolism approach, which describes the economy as a physical input‐output system drawing energy from the environment, performing internal physical processes (i.e. energy conversion or transfer) and dissipating low‐grade waste heat to the environment (Haberl, 2006).
As mentioned before, energy flows are traditionally classified into three levels of energy use: primary, final and useful with two stages of energy conversion: primary‐to‐final and final‐to‐ useful. However, Nakićenović and Grübler (1993) argue that this classification truncates the analysis at the last stage of energy conversion and hence does not include actual delivered energy services, see also Haas et al. (2008), Pachauri and Spreng (2004), and Wirl (1995). Therefore, a service level of energy use and a useful‐to‐service transition stage should be included (Section 2.1.4, Figure 2‐1).
Figure 2‐1 Diagram of energy flows with major energy‐ and efficiency‐related terms Note: From UNDP (2000) and UNDP (2004)
UNDP (2000) and Cullen and Allwood (2010a) place the service level in flow diagram of an energy system as the output of a dissipative energy transfer performed by a passive system (i.e. end‐use device which dissipates most of the energy it receives, explained in Section 2.1.4). Furthermore, Cullen and Allwood (2010a) and Ma et al. (2012) built technically‐focused energy Sankey diagrams (Schmidt, 2008a) that show the levels of energy use from primary energy resources to energy services (e.g. Figure 2‐2). These diagrams highlight the importance of the levels of energy use for the analysis of energy performance of an economy. Vertically, the energy flows and potential efficiency improvements by level can be compared in absolute terms. On the other hand, horizontally, the entire flow chain from primary to service and the effect of sequential improvements in efficiency can be tracked (Cullen and Allwood, 2010a).
Figure 2‐2 Global energy flow from the primary to service levels of energy use Note: From Cullen and Allwood (2010a). Conversion losses and dissipative degradation are included In the following sections, the levels of energy use and the transition stages between them are explained in detail.
2.1.1 Primary level of energy use
Primary energy corresponds to energy carriers as they are recovered or gathered from the natural environment (Haberl, 2001a; Nakićenović and Grübler, 1993), i.e. natural resources such as mined coal, collected biomass or crude oil. As there are many forms of energy carriers in the natural environment, primary energy is given in terms of the energy content of these energy carriers, which leads to consistency issues (Serrenho, 2013).
In the case of fossil fuels, the energy content is usually determined by the enthalpy or heating thermodynamic potential (IEA, 2011a; Serrenho, 2013). In the case of renewable and non‐ conventional energy carriers, the energy content (or primary energy equivalent) is estimated according to two accounting methods (Bhattacharyya, 2011; Cegonho et al., 2012; IEA, 2014; Lightfoot, 2007; UN, 1982):
The partial substitution method (PSM) transforms the flows of non‐conventional and renewable heat and electricity into the equivalent heat content of fossil fuels that would be needed if the same amount of electricity or heat had been produced by 1) a standard thermal technology and 2) an existing domestic thermal technology. The PSM is suitable for the analysis of the substitution of conventional carriers by renewables in terms of the fossil fuels avoided by the introduction of renewables. This method is not recommended for countries with a large share of renewables (IEA, 2014).
The physical content method considers the physical energy content of the first usable energy form (i.e. electricity or heat) as the equivalent primary energy of non‐conventional and renewable energy carriers (hereby referred to as PCM‐I). However, as pointed out by Cegonho
et al. (2012) and Serrenho (2013), the first usable energy form can also be that of the natural resources themselves (e.g. wind flow and solar irradiation) hence the equivalent primary energy will correspond to the physical energy content of natural resources, e.g. the kinetic energy of the wind flow and solar irradiation energy (hereby referred to as PCM‐II). The PCM’s are suitable for the analysis of renewable transition in the economy (see Section 7.4.5.1).
2.1.2 Final level of energy use and the primary‐to‐final conversion
Final or secondary energy is the flow of energy carriers that is available for direct use by consumers. A consumer is a unit of the economic system (i.e. industries and households) that requires energy services for production or consumption, e.g. industries or households (Haberl, 2001a).
The final level of energy use mainly accounts for the energy content in output products of the energy sector, e.g. oil derivatives, electricity, biodiesel or geothermal heat. It also accounts for energy carriers in secondary form produced by decentralized generation systems, which are not part of the energy sector, e.g. residential solar thermal boilers or stand‐alone wind turbines. Additionally, the International Energy Agency does not include the direct use of secondary energy carriers by the energy sector as final energy flows (IEA, 2011a). IEA’s distinction is followed in this work. It is worth mentioning that the measurement of the energy content of final energy flows is more consistent than for primary energy flows, though there are still different options, depending on the selection of thermodynamic potential e.g. the low or high heating value (Serrenho, 2013).
The primary‐to‐final conversion is the first energy transformation stage in the economy, where primary energy sources are upgraded into more useful forms of energy through conversion processes (Cullen et al., 2011). In addition to conversion process, such as oil refining and coal‐ fuelled electric generation, this conversion stage usually includes other operation processes of the energy sector, e.g. extraction, storage and distribution (Orecchini and Naso, 2012; Serrenho, 2013; UNDP, 2000).
2.1.3 Useful level of energy use and the final‐to‐useful conversion
Useful energy (mainly heat, motion, and light) is the last form of energy flows that is directly used to provide energy services (Cullen et al., 2011). It is obtained from the conversion of secondary energy carriers by end‐use conversion devices, for example, motor engines, boilers, ovens and lamps (Nakićenović and Grübler, 1993). Because useful energy is situated immediately before the level of satisfied energy needs and is independent from the evolution of energy conversion technology, it is should be included in economy‐wide energy accounting (Haberl, 2001a; Percebois, 1979; Serrenho, 2013).
The final‐to‐useful conversion is the second and last energy conversion stage in the economy. This stage is usually carried in the exact location where energy services are required (in the household or in a factory). The final‐to‐useful conversion stage consists of a large share of one‐ step conversions, e.g. electricity into motion by an electric motor or natural gas into steam by a boiler, and of two‐step conversions, e.g. gasoline into motion by a car engine into air conditioning low temperature heat. Moreover, this conversion stage is difficult to estimate since every sector, every energy carrier, every conversion device and every energy service must be considered (Nakićenović et al., 1996).
2.1.4 Service level of energy use and the useful‐to‐service dissipative
transfer
Haberl (2001a) defines energy services as immaterial services, whose provision involves the use of energy1. For example, heating of a room, moving commodities from one point to another in a defined time period, or transforming material inputs into a piece of furniture. In addition to energy, these services also involve inputs of technology, capital (human and physical) and non‐energy resources (Haas et al., 2008).
The problem with these definitions is that it is not possible to distinguish energy services from other goods and services in the economy (Pachauri and Spreng, 2004) (everything needs energy to be produced). Consequently, energy services sometimes are classified into two categories (Haas et al., 2008; Pachauri and Spreng, 2004): 1) direct, such as lighting, ironing, drilling, melting sands to form glass, etc.; and 2) indirect, i.e. the energy embodied in food, shoes, building, vehicles, etc. Nevertheless, as consumers do not consume non‐energy products and services due to their embedded energy, the indirect services are evaluated in terms of the direct energy services used to produce them. Therefore, only direct energy services are considered part of the service level of energy use.
The definition of direct energy services, because of their many forms, is complex (Cullen and Allwood, 2010a; Nakićenović et al., 1996). Moreover, at this level of energy use, other human behavioral and lifestyle characteristics (voluntary or not) are also involved (Cullen et al., 2011; Nakićenović and Grübler, 1993), which increases the complexity. However, these issues can be addressed by an understanding of the stage of transition between useful energy and energy services (see below).
This level of energy use and its preceding transition stage from the useful level is fundamental for the analysis of energy performance of an economy because it appears to be the “weakest link” of the energy chain from primary to services (Nakićenović and Grübler, 1993) so the largest improvements are expected to be at the useful‐to‐service transition stage (Nakićenović et al., 1996). Useful‐to‐service dissipative transfer The transition between the useful and the service levels of energy use consists of a series of dissipative processes (Haberl, 2001a). These processes are performed by passive systems that “holds or traps useful energy for a time to provide a level of final service” (Cullen et al., 2011). A passive system is a last technical component of the energy chain, whose purpose is not converting the flow of useful energy into another energy form. In providing energy services, useful energy is eventually dissipated to the natural environment as low‐grade heat (Cullen and Allwood, 2010a). Therefore, a passive system requires a continuous supply of useful energy to maintain a constant level of service. The most efficient passive system is the one that minimizes dissipation, i.e. retains useful energy for longer periods (Cullen et al., 2011). Additionally, in the production of material products, a part of useful energy is dissipated to the
1 In this case, energy services do not correspond to the services that energy companies provides as in
environment while the rest is contained in the product in the form of changes in chemical and physical properties (Cullen et al., 2011).
The definition of boundaries of the passive system with respect to end‐use conversion devices and other external systems are not simple (Cullen and Allwood, 2010a). For example, a car could be considered as formed by a conversion device (the engine) and a passive system (the rest of the car). However in providing a transportation service the car interacts with the road infrastructure (road, signals, etc.) Most of the dissipation of useful energy (i.e. friction) is caused by this interaction; hence the passive system should be defined as the car (except the engine) plus the road infrastructure. In addition, the boundaries of the passive system also depend on a clear, though arbitrary, definition of the energy service. The conditioning of a building can be thought as warming indoor air into a desired temperature (a closed passive system) or as providing an air flow with desired characteristics for a time period (an open passive system).
Furthermore, the service level of energy use also involves the direct or indirect participation of the end‐user. A user has a direct participation when its interaction with the passive system affects the performance of this system, i.e. the capacity of the passive system to retain useful energy is affected. For example, a bad driver can significantly increase the dissipation in a transportation service hence the user operation might as well be considered part of the passive system. An indirect participation is when the user does not affect the performance of the passive system, for example, setting the indoor heating system at an ideal workspace temperature or leaving the lights on in an empty room. In this case, the indirect participation determines how much of the energy services are turned into real benefits for the user. In the example of leaving the light on in an empty room, the lighting service is provided by the room and the lamp but does not have any productive use or benefit for the user. In summary, the direct participation is related to the operation of passive systems at the useful‐to‐service transition stage while indirect participation is related to the consumption behavior at the service level.
Because of the issues in the definition of each energy service and the boundaries of its passive system, the service level has been excluded in most studies (Nakićenović and Grübler, 1993). Once the energy service and its associated passive system are defined, the non‐dissipative efficiency, also called service factor by Nakićenović et al. (1996), of passive systems can be defined (see Section 9.1.2.2).
2.2 Approaches to the analysis of energy flows
There are two main approaches to the analysis of energy use in engineering and economic systems2, i.e. the so‐called energy and exergy approaches (Figure 2‐3) (Dincer and Rosen, 2012; Wall and Gong, 2001). On the one hand, energy analysis is focused on the energy content3 of energy flows and framed under the first law of thermodynamics (In the previous section, the levels of energy use are described according to this approach). On the other hand, exergy analysis is focused on the exergy (explained below) of energy flows and framed under the second law of thermodynamics. This latter approach, as opposite to the former, provides a context‐dependent understanding of system’s energy performance4.
Figure 2‐3 Levels of energy flows (primary to useful) and analysis approaches
Exergy
The concept of exergy stems from the second law of thermodynamics, which establishes the fundamental property entropy (Dincer and Rosen, 2012). This law also explains that every process of an isolated system will tend to maximize the system’s entropy, i.e. entropy must increase in any process of energy transfer or conversion. Therefore, the state of thermodynamic equilibrium of a system is characterized by relative maximum entropy, i.e. no further increases in entropy are possible without external means (Dincer and Rosen, 2012; Moran et al., 2006; Wall, 2009).
Exergy is the maximum work that can be theoretically obtained from a system or a heat/matter flow as it is brought into equilibrium with a reference environment by means of a 2 The analysis of the financial value of energy flows can also be considered a level of analysis of energy use mainly in economic systems (Cleveland et al., 2000; Dincer and Rosen, 2012; Stern, 2010, 2011). 3 The energy content can be measured by one of the different thermodynamic potentials (e.g. internal energy, enthalpy, Helmholtz or Gibbs potentials) (Moran et al., 2006). The selection of the potential is arbitrary though enthalpy or heating potential is usually used for the analysis of energy flows (Serrenho, 2013). 4 It is commonly assumed for simplicity that energy analysis is not dependent on the context, see (Dincer and Rosen, 2012). However, the values of some of the thermodynamic potentials, mentioned in the Footnote 3, vary with context‐dependent properties, e.g. the Helmholtz and the enthalpy potentials depend on the temperature and the pressure of the system, respectively. Use level Final level Primary level Primary energy Primary exergy Final energy Final exergy Useful energy Useful work Energy Exergy
Energy flow levels
Analys
reversible process5 (Moran et al., 2006; Rosen, 2004). It can alternatively be defined as the minimum work required to bring a system from an equilibrium to a desired state (Moran et al., 2006). Moreover, exergy is considered a measure of energy quality since it establishes the ability of an energy source to produce work between an initial and the equilibrium states (Wall, 2009).
Exergy has the following properties (Dincer and Rosen, 2012; Moran et al., 2006; Wall, 2009): Exergy depends on the properties of the system/flow and the environment together; The value of exergy is always positive;
Exergy is not conservative, i.e. it is destroyed or consumed along a process due to irreversibilities;
Exergy is zero at a state of thermodynamic equilibrium with the environment;
Exergy increases as the system deviates from the environment, i.e. energy flows with low entropy content (e.g. electricity) have more exergy that those with high entropy content (e.g. low temperature heat);
High exergy systems/flows are usually more valued than low exergy.
Exergy has been widely applied to several areas of engineering systems, for example: 1) the analysis of thermal processes; 2) the design of energy conversion systems; 3) the estimation of practical limits for efficiency improvements; and 4) the evaluation of the impact of energy use on the environment and on sustainable development (Dincer and Rosen, 2012; Gong and Wall, 2001). In addition, exergy has been also applied to the analysis of materials flows as a measure of resource quality (De Meester et al., 2006; Dincer and Rosen, 2005; Ertesvåg, 2005; Gong and Wall, 2001). Three exergy‐related concepts are further described: 1. The reference environment The choice of the reference environment constitutes the major methodological issue in exergy analysis (Wall and Gong, 2001). Generally, the reference environment is modelled as the actual environment (where the system or flow is contained6) in a perfect state of equilibrium, i.e. without changes in intensive properties (e.g. temperature, pressure and chemical composition) (Dincer and Rosen, 2012; Wall, 2004).
Nevertheless, depending on the scope of the analysis, the actual environment cannot be assumed as chemically unreactive or invariable with space and time. In these cases, a standard environment is defined with the average properties of the actual environment or a set of different reference environments are defined to account for time and spatial differences.
5
A reversible process is the process, along which entropy of the system or flow remains constant. It is theoretical since it does not occur in nature
6 The environment and immediate surroundings of a system must be differentiated since intensive
properties of the latter can significantly vary through interactions with the system. Therefore, the properties of the environment are defined at a relatively long distance from the system (Moran et al., 2006).
2. Exergy efficiency
Exergy efficiency or second‐law efficiency represents the fraction of an exergy flow that is converted into work or into another form of exergy flow (Cullen and Allwood, 2010b; Wall, 2009). Ford et al. (1975) provided detail to the definition as:
Minimum amount of work/exergy
required to produce the desired energy transfer/conversion Maximum amount of work/exergy
that could be produced from the relevant energy input
(2.1)
This efficiency quantifies the distance between the results of real and ideal theoretical processes. It also serves to evaluate the effectiveness of improvements in energy conversion systems (Dincer and Rosen, 2012; Moran et al., 2006).
Exergy efficiency differs from energy efficiency or first‐law efficiency7 ( ) because the former
gives a figure of merit, i.e. quality and closeness to ideal, and has a strict range of 0 1
for any process of energy use, which allows the comparison between different processes . On the other hand, does not provide a figure of merit and can take values larger than 1 for processes that involve an energy contribution from the environment (e.g. heat pumps) (Dincer and Rosen, 2012; Wall, 2009).
3. The exergy of combustible energy carriers
The exergy content of energy carriers is calculated by the thermodynamic analysis of a closed system, which produces work through an isobaric and adiabatic combustion reaction till the combustion products reach a state of equilibrium with the environment. The exergy content then corresponds to the absolute change of the system’s heating thermodynamic potential (i.e. enthalpy of combustion) plus/minus a term that accounts for the chemical exergy of combustion products. This chemical exergy results from the contrast of the composition of the combustion products and the composition of the reference environment (Ayres and Masini, 2004; Rosen, 2004). Moreover, the enthalpy of combustion for this combustion process corresponds to the maximum heat content of an energy carrier, also known as high heating value (Moran et al., 2006). The values of the exergy of most combustible energy carriers are presented in the literature in the form of exergy factors, e.g. see Ertesvåg and Mielnik (2000), Nakićenović et al. (1996) and Serrenho et al. (2012). The exergy factor ( ) is defined as the ratio of exergy content and the minimum heat content, i.e. low heating value8 (as most energy databases are in terms of the low heating value). 7 The first‐law efficiency ( ) is defined as the ratio of desired energy output (transfer or conversion) and the relevant energy input (Ford et al.). 8 The enthalpy of combustion of an isobaric combustion reaction in a closed system, whose final state is defined by the end of the combustion reaction, i.e. the combustion products are at the temperature of the reaction. The high heating value exceeds the low heating value by the amount of energy needed to condense the water product and cool other combustion products from the reaction temperature to the ambient temperature (Moran et al., 2006) Note: the latent heat of water vapor accounts for the largest share of this difference.