Brazilian Journal of Food Research, Campo Mourão, v. 7, n. 3, p. 150-172, set./dez. 2016. Página | 150
https://periodicos.utfpr.edu.br/rebrapa
Mixture design applied to the study of
bioethanol production from cheese whey
and corn steep liquor
ABSTRACT
Fabiane Oliveira Farias
Universidade Estadual de Ponta Grossa, Ponta Grossa, Paraná, Brasil.
Aline Alberti
Universidade Estadual de Ponta Grossa, Ponta Grossa, Paraná, Brasil.
Alessandro Nogueira
Universidade Estadual de Ponta Grossa, Ponta Grossa, Paraná, Brasil.
Ivo Mottin Demiate
Universidade Estadual de Ponta Grossa, Ponta Grossa, Paraná, Brasil.
Apart from creating many positive impacts, the growth of agribusiness has also generated concerns about the production of large amounts of undervalued by-products. Cheese whey and corn steep liquor (from corn flour production, a typical Brazilian food) are among these by-products that can be potential raw materials for obtaining new products such as bioethanol. The objective of this study was to apply an experimental design tool to examine different mixtures of cheese whey and corn steep liquor for the production of bioethanol. Between the worts studied, those containing 100 % corn steep liquor, and 25 % cheese whey with 75 % corn steep liquor supplemented with glucose were considered the best for the production of bioethanol, with fermentation efficiency reaching around 90 % for both of them. The use of pasteurization and antibiotics was effective in controlling lactic acid production, which results from bacterial contamination. The use of antibiotics showed advantages by reducing the maximum growth rate of yeast, which was reflected in higher rates of fermentation efficiency. The worts proposed allowed reaching ethanol
productivity of up to 1.93 g L-1 h-1.
Brazilian Journal of Food Research, Campo Mourão, v. 7, n. 3, p. 150-172, set./dez. 2016. Página | 151
INTRODUCTION
Petroleum is a finite source of energy and always involved with environmental degradation issues. Several studies suggest new sources of renewable energy to replace fossil fuels, and bioethanol production is one of the best alternatives (BAI; ANDERSON; MOO-YOUNG, 2008; BEHERA; MOHANTY; RAY, 2012; CARDONA; SÁNCHEZ, 2007).
Bioethanol classified as being first-generation is derived from typical agricultural crops. The production of this type of bioethanol compromises the use of agricultural areas for food crops. In order to reduce this impact, bioethanol can be produced from alternative sources such as agro-industrial by-products. Although this seems very promising, the high cost of this type of fuel is a limiting factor in commercial use. Intensive scientific studies are needed to find a highly productive process by using inexpensive and renewable substrates, including food industry by-products such as corn steep liquor (CSL) and cheese whey (CW) (AMORIM et al., 2011; CHOI et al., 2010; DODIĆ et al., 2009; LEITE et al., 2008; MOREIRA et al., 2015).
CSL is a major by-product of corn wet-milling. When obtained from corn starch production, CSL has a content of 40-50 % (w w-1, dry matter) due to high
technology manufacturing process and also contains sulphur dioxide. There are numerous scientific studies using this by-product in bioprocesses (CHOI et al., 2013; EDWINOLIVER et al., 2009; GAO et al., 2011; MADDIPATI et al., 2011). However, corn wet-milling in Brazil is also used to obtain "Biju" corn flour, a typical and widely-consumed food in the country. In this form of processing there is no addition of sulphur dioxide and the CSL that is derived has about 8 % (w w-1,
dry matter). This type of CSL is produced in large volumes, around one liter per kilogram of corn processed, and there are no studies that indicate its possible uses (LOSS et al., 2009). Independent of the source, CSL is a low-cost and rich source of nitrogen, free amino acids, minerals, vitamins and other nutrients for most of the microorganisms used in bioprocesses (CHOI et al., 2013; EDWINOLIVER et al., 2009; GAO et al., 2011; LOSS et al., 2009; MADDIPATI et al., 2011;).
Cheese whey (CW) is the liquid by-product of milk coagulation in cheese production; it is generated in large quantities, around nine liters of CW per kilogram of processed cheese, and has a high organic load (chemical oxygen demand of 60-100.000 mg L-1), which is attributed to its high lactose content
(70-75 %, dry matter) (CARVALHO; PRAZERES; RIVAS, 2013; GUIMARÃES; TEIXEIRA; DOMINGUES, 2010). Besides lactose, CW also retains other milk nutrients, such as proteins, lipids, vitamins and minerals, and offers great potential for obtaining new products and use in bioprocesses (MOREIRA et al., 2015).
Saccharomyces cerevisiae is the microorganism most used on alcoholic fermentation with high productivity index (CHANDRAKANT; BISARIA, 2000; ANTONI et al., 2007). In Brazil, the use of baker's yeast in industrial alcohol production is very common due to its low cost and large availability (BASSO et al., 2008). Carbohydrates comprise the main raw material (carbon source) for fermentation processes by S. cerevisiae. Nitrogen is also essential for the metabolism of the yeast being the second most common element in their growth (ARIAS-GIL; GARDE-CERDÁN; ANCÍN-AZPILICUETA, 2007). Thus the mixture of the
Brazilian Journal of Food Research, Campo Mourão, v. 7, n. 3, p. 150-172, set./dez. 2016. Página | 152
by-products CW and CSL, rich in carbohydrates and nitrogen, respectively, may result in a wort with the components required for high fermentation yields.
In the industrial production of bioethanol, bacterial contamination needs to be considered because it is responsible for causing damage to the process, generating secondary compounds such as organic acids, as well as competing for nutrients with the Saccharomyces sp. (NARENDRANATH; POWER, 2005). Several methods, such as the use of antibiotics (COMPART et al., 2013), antiseptics and physical treatments (BECKNER; IVEY; PHISTER, 2011; MUTHAIYAN; LIMAYEM; RICKE, 2011) are adopted to control contaminant bacteria. Typically, antibiotics used in alcoholic fermentation are effective against Gram-positive bacteria and considered to be viable because they do not require modifications in the techniques and equipment used on the process (HYNES et al., 1997; PRESSMAN, 1976). Sodium monensin is a polyether ionophore antibiotic. Its antimicrobial activity occurs through changes in pH, causing disturbances in cellular processes and culminating in cell death (LOWICKI; HUCZYNSKI, 2013; PAREKH; VINCI; STROBEL, 2000; STROPPA et al., 2000).
Therefore, the aim of this study was to test CW and CSL in the production of bioethanol using baker's yeast Saccharomyces cerevisiae, analyzing the efficiency of fermentation on a high-yield process, using experimental design and considering different ways for controlling contaminants (pasteurization and antibiotics).
MATERIALS AND METHODS
MATERIALS
The Corn Steep Liquor (CSL) used in this study was provided by a "Biju" corn flour factory (Irati, PR, Brazil; 25º 28' 02" S, 50º 39' 04" W) after 48 h of corn immersion in water (one liter of water per kilogram of corn). The cheese whey (CW) (pH 5.7 and acidity of 2.15 g L-1 in lactic acid) came from Camembert-type
cheese processing and was provided by the Technological School of Milk and Cheeses of Campos Gerais (ETLQueijos), from the Department of Food Engineering of the State University of Ponta Grossa (Ponta Grossa, PR, Brazil; 25° 05' 42" S, 50° 09' 43" W). Twenty liters of each by-product were collected in plastic bottles and stored at -18 °C (Metalfrio, São Paulo, SP, Brazil) until further analysis.
CHARACTERIZATION OF BY-PRODUCTS
The physicochemical characterization of the by-products was achieved by the following analyses: pH; solid fraction and chemical oxygen demand (COD) according to the methods proposed by the American Public Health Association (APHA, 1998), lipids by Bligh-Dyer method (1959), protein and total nitrogen by the Kjeldahl method and ash as described by the Official Methods of Analysis of the Association of Official Analytical Chemists (AOAC, 2000). The CW used in this study was previously hydrolyzed with beta-galactosidase (Granolab S.A., Curitiba, PR, Brazil) following the manufacturer’s instructions (pH 6.5, at 40 °C for 4 h). The
Brazilian Journal of Food Research, Campo Mourão, v. 7, n. 3, p. 150-172, set./dez. 2016. Página | 153
determination of sugars and organic acids was performed by HPLC. A chromatographic system equipped with a quaternary pump (Waters Alliance 2695, Milford MA, USA), degasser, auto injector coupled with a diode array detector (DAD, Waters 2998, Milford, MA, USA) and a refractive index detector (RID, Waters 2414, Milford MA, USA) was used. The chromatographic data were obtained using the Empower 2® software. The samples were diluted as needed and filtered through a nylon syringe filter (0.22 μm). They were analyzed using an Aminex HPX-87H ion exchange column (300 × 7.8 mm) protected by a Cation-H Micro-Guard pre-column (Bio-Rad Laboratories Inc., Hercules, CA, USA) in isocratic conditions using as eluent a solution of 3 mM of sulfuric acid prepared in ultrapure water (Milli-Q Integral®, Millipore, São Paulo, SP, Brazil) and filtered through a 0.45 μm nylon membrane. The injection volume was 10 μL at a flow rate of 0.5 mL min-1. The column and refractive index detector were maintained
at 30 °C. The samples were compared with the retention times of reference standards. The amino acids were determined by HPLC using a chromatographic system (Alliance 2695, Waters, Milford, MA, USA) equipped with multi fluorescence (Waters 2475, Milford MA, USA) and a Pico Tag column (3.9 X 150 mm). The analysis was performed according to AccQTagTM methodology using the complete Waters kit.
EXPERIMENTAL DESIGN
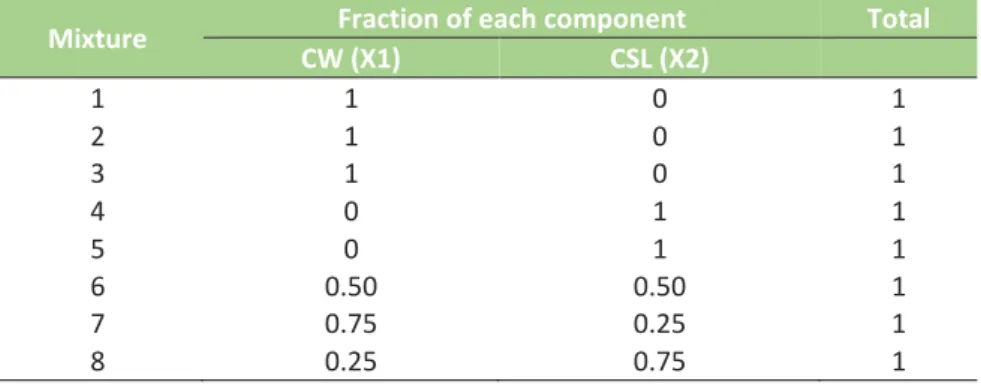
The simplex-centroid experimental design applied to a mixture of two components was obtained by using Statistica 10.0 (StatSoft, Tulsa, OK, USA) software. The simplex-centroid design for binary mixtures was used to evaluate the performance of the by-products in order to obtain the best ethanol yield (Table 1).
The content of fermentable sugars was adjusted to approximately 100 g L-1
using glucose (both glucose and galactose available on the by-products were considered). An inoculum of 6 g L-1 S. cerevisiae (dried baker's yeast, Fleischmann,
Jundiaí, SP, Brazil) was employed. The experiments were performed in anaerobic fermenters (Erlenmeyer flasks) with 50 mL of previously pasteurized wort (60 °C/30 min) in order to control microbial contamination. After inoculation the system was appropriately homogenized and kept under anaerobic conditions.
Table 1 - Simplex-centroid experimental design applied to a binary mixture of Cheese Whey (CW) and Corn Steep Liquor (CSL) for bioethanol production
Mixture Fraction of each component Total
CW (X1) CSL (X2) 1 1 0 1 2 1 0 1 3 1 0 1 4 0 1 1 5 0 1 1 6 0.50 0.50 1 7 0.75 0.25 1 8 0.25 0.75 1
Brazilian Journal of Food Research, Campo Mourão, v. 7, n. 3, p. 150-172, set./dez. 2016. Página | 154
The fermentation time was monitored by weighing the flasks at predetermined time intervals (30 minutes), indicating the weight loss resulting from the carbon dioxide that was released (ALBERTI et al., 2011; ROGER et al., 2002). At the end of fermentation, a centrifuge (Hettich Rotina 420R, Tuttlingen, Germany) was used in order to recover the product and to remove the yeast cells (12000˟g at 10 °C, for ten minutes). Cell biomass was quantified gravimetrically after washing the pellet for three times with deionized water and drying at 105 ° C for 24 hours.
ETHANOL ANALYSIS
Twenty five milliliters were sampled from the fermenters and distilled in a micro-distiller (TE-012, TECNAL, São Paulo, SP, Brazil). Then, 3 mL of distilled sample was analyzed in a digital density meter (Anton Paar DMA 4500 M, Graz, Austria), which provided density (g cm-3, with precision of 0.00001 g cm-3) for calculating the ethanol content (% v v-1).
FERMENTATION KINETICS
The mixtures that showed the best results for efficiency after experimental design were used for the determination of the fermentation kinetics. The fermenters were weighed every thirty minutes during 27 hours of fermentation. The samples were removed every 4.5 hours, totaling seven points for analysis. The kinetic parameters of the fermentation were calculated. For the cell concentration produced (X = Xf – X0, in g dry-matter L-1), sugar consumed (S = S0 -
Sf, g L-1) and ethanol produced (P = Pf – P0, g L-1) were considered the differences
between initial (X0, S0, P0) and final concentrations (Xf, Sf, Pf). The ethanol
productivity (g L-1 h-1) was calculated as ethanol produced by time. Conversion
factor of substrate to biomass (YX/S) and conversion factor of substrate to ethanol (YP/S) according Equations 1 and 2:
YX/S = X S (1) YP/S= P S (2)
The fermentation efficiency (%) was calculated based on the theoretical yield from the Gay-Lussac equation (100 g glucose 51.1 g ethanol) according to Equation 3 and the process efficiency (%) was based on the initial sugar concentration (Equation 4).
Fermentation Efficiency = Y𝑃/𝑆
Brazilian Journal of Food Research, Campo Mourão, v. 7, n. 3, p. 150-172, set./dez. 2016. Página | 155
Process Efficiency = Pf
0.511∗S0∗ 100 (4)
The maximum specific growth rates (µmax) were determined by the
construction of a graph: ln X/X0 (Napierian logarithm of yeast concentration in
exponential growth phase, where X and X0 are the final and initial cell
concentrations, respectively) versus time. The µmax (h-1) value was found by the
slope adjustment of the experimental data in the exponential growth phase. With these data a kinetic curve was obtained for the study of the fermentation process using an unstructured mathematical model that considered four variables: the concentration of cells (biomass); the substrate concentration; the product concentration; and the evolution of carbon dioxide.
CONTROL OF CONTAMINANTS
One of the main problems observed in bioethanol production is bacterial contamination, mainly by lactic acid bacteria. Thus, the behavior of the fermentation kinetics was evaluated using the antibiotic sodium monensin (Phibro Maxx - Phibro Ethanol Performance Group®, Guarulhos, SP, Brazil). This was previously dissolved in ethanol and 5 ppm was added to fifty milliliters of wort, which was the concentration recommended by the supplier. Total lactic acid produced was the indicator of the level of contamination during all the experiment.
STATISTICAL ANALYSIS
Allexperimental datawere obtainedin triplicateandpresented as mean valueswith standard deviation. The software Statistica 10.0 (StatSoft, Tulsa, OK, USA) was used to check the normality of the experimental data by considering the Shapiro-Wilk test. When the data did not follow a normal distribution, the Box-Cox transformation was used (data not shown). We also evaluated the homogeneity of variance by using the Brown-Forsythe test. The parametric data (normal and homogeneous) were then assessed by analysis of variance (ANOVA - p value <0.05 was considered significant), followed by Fisher's LSD test to compare means.
RESULTS AND DISCUSSION
PHYSICOCHEMICAL COMPOSITION
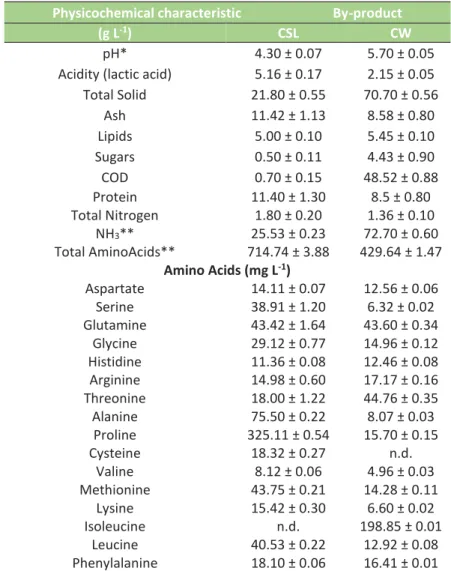
The physicochemical characteristics of the by-products CSL and CW are displayed in Table 2.
Brazilian Journal of Food Research, Campo Mourão, v. 7, n. 3, p. 150-172, set./dez. 2016. Página | 156
Table 2 - Physicochemical characteristics of Cheese Whey (CW) and Corn Steep Liquor (CSL)
Physicochemical characteristic By-product
(g L-1) CSL CW
pH* 4.30 ± 0.07 5.70 ± 0.05
Acidity (lactic acid) 5.16 ± 0.17 2.15 ± 0.05
Total Solid 21.80 ± 0.55 70.70 ± 0.56 Ash 11.42 ± 1.13 8.58 ± 0.80 Lipids 5.00 ± 0.10 5.45 ± 0.10 Sugars 0.50 ± 0.11 4.43 ± 0.90 COD 0.70 ± 0.15 48.52 ± 0.88 Protein 11.40 ± 1.30 8.5 ± 0.80 Total Nitrogen 1.80 ± 0.20 1.36 ± 0.10 NH3** 25.53 ± 0.23 72.70 ± 0.60 Total AminoAcids** 714.74 ± 3.88 429.64 ± 1.47 Amino Acids (mg L-1) Aspartate 14.11 ± 0.07 12.56 ± 0.06 Serine 38.91 ± 1.20 6.32 ± 0.02 Glutamine 43.42 ± 1.64 43.60 ± 0.34 Glycine 29.12 ± 0.77 14.96 ± 0.12 Histidine 11.36 ± 0.08 12.46 ± 0.08 Arginine 14.98 ± 0.60 17.17 ± 0.16 Threonine 18.00 ± 1.22 44.76 ± 0.35 Alanine 75.50 ± 0.22 8.07 ± 0.03 Proline 325.11 ± 0.54 15.70 ± 0.15 Cysteine 18.32 ± 0.27 n.d. Valine 8.12 ± 0.06 4.96 ± 0.03 Methionine 43.75 ± 0.21 14.28 ± 0.11 Lysine 15.42 ± 0.30 6.60 ± 0.02 Isoleucine n.d. 198.85 ± 0.01 Leucine 40.53 ± 0.22 12.92 ± 0.08 Phenylalanine 18.10 ± 0.06 16.41 ± 0.01
Note: * dimensionless; **mg L-1; n.d.: not detected.
The physicochemical composition and COD values were in accordance with the values found by several authors for CW (PRAZERES; CARVALHO; RIVAS, 2012; SADDOUD; HASSAIRI; SAYADI, 2007; Yasmin et al., 2013). Variations in the CW composition can be assigned to milk composition and/or the different processing and manipulation techniques used by dairies (ALSAED et al., 2013). The enzymatic hydrolysis applied had 66 % of efficiency in the conversion of lactose to glucose and galactose. After hydrolysis the sugar composition of CW was 15.60 g L-1 of
lactose; 19.40 g L-1 of glucose and 13.52 g L-1 of galactose. The results of the
physicochemical analyses of CSL from "Biju" corn flour production found in this study were in line with those reported by Loss et al. (2009) (Table 2). The pH of this by-product remains low due to the formation of organic acids by microorganisms, particularly species of the Lactobacillus genus from corn steep, even in acidic pH conditions (YANG et al., 2013). Although deficient in carbohydrates CSL is a complex broth that contains multiple nitrogen components, protein and non-protein, and is an excellent source of organic nitrogen and minerals, such as sodium and potassium, for use in bioprocess.
Brazilian Journal of Food Research, Campo Mourão, v. 7, n. 3, p. 150-172, set./dez. 2016. Página | 157
The contents of nitrogen, protein and amino acids (Table 2) of the by-products were analyzed to evaluate their potential as nitrogen sources for fermentation. Both by-products are rich in ammonia nitrogen, which is also consumed by S. cerevisiae and may delay or reduce the consumption of several amino acids, stimulating yeast growth (GAO; YUAN, 2011; JIRANEK; LANGRIDGE; HENSCHKE, 1995; VILANOVA et al., 2007; XI et al., 2013). The CW showed high levels of isoleucine, threonine and glutamate amino acids, whereas cysteine was not detected, in line with results reported in the literature (YASMIN et al., 2013). The CSL had proline and alanine as the predominant amino acids with low concentrations of valine and absence of isoleucine. The amino acids in CSL have an important role as nutritional components of basic metabolism. Alanine present in CSL and isoleucine present in CW are the most demanded amino acids for cell growth in bioprocesses, revealing the potential of these by-products as low-cost raw materials to be used in bioprocesses (GAO; YUAN, 2011; CHOI et al., 2013; XIAO et al., 2013).
EXPERIMENTAL DESIGN
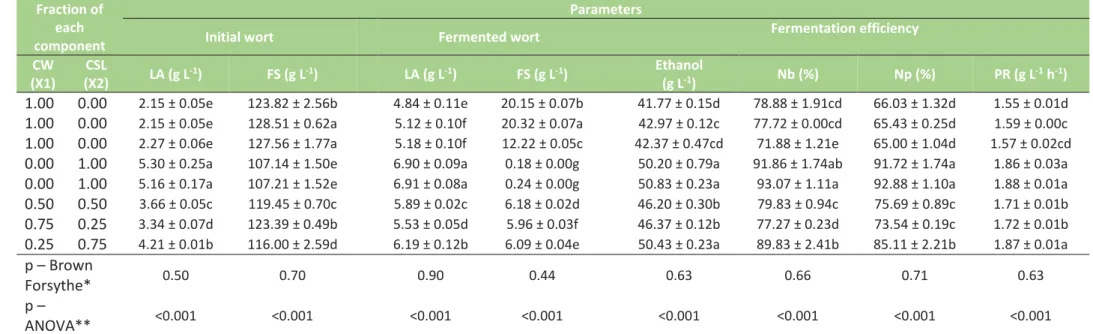
Experimental design is a mathematical tool for predicting response variable with respect to input parameters (BRUNS; SCARMINO; BARROS, 2006; RAJA; MANISEKAR; MANIKANDAN, 2014). In Table 3 the contents of lactic acid and fermentable sugars of the wort before and after fermentation are shown. Other fermentation parameters are also shown, including concentration of ethanol (g L -1), productivity (g L-1 h-1) and fermentation efficiency (%).
In practice, by applying the experimental design greater efficiency was reached for the experiment with CSL and there was a low yield for the experiment that contained only CW. The low yield of ethanol production on experiments with only CW can be attributed to the presence of galactose that is slowly consumed by the yeast. Even in other studies with modified microorganisms, the use of CW without nitrogen supplementation resulted in low ethanol yields, and the addition of nitrogen to the wort (as was considered in the present study with use of CSL) can substantially increase yields (LEITE et al., 2000). The ethanol content (Table 3) was significantly higher for the experiments containing only CSL and the experiment containing 25 % of CW; consequently, they had greater values for fermentation efficiency and productivity. A high concentration of yeast has a positive effect, with higher ethanol production rates, whereas in low concentrations the yeast be exhausted, requiring regeneration even before consuming all the available substrate (OSUNKOYA; OKWUDINKA, 2011).
Silva et al. (2010) performed a similar experiment using a modified strain of S. cerevisiae to consume lactose as carbon source; they used a concentrate of CW containing 150 and 200 g L-1 of lactose as a substrate. The results showed
productivity rates of 0.74 and 0.63 g L-1 h-1. Using the same substrates
supplemented with 10 g L-1 of CSL the productivity was 1.22 and 0.57 g L-1 h-1,
respectively, indicating that the nutrients from CSL, emphasizing the contents of amino acids (Table 2), accelerated the fermentation, due to nitrogen used for growing of yeast. The higher concentration of sugar had a negative effect on the performance of the yeast, due to osmotic stress (SILVA et al., 2013).
Brazilian Journal of Food Research, Campo Mourão, v. 7, n. 3, p. 150-172, set./dez. 2016.
Table 3 - Physicochemical and process parameters from alcoholic fermentation of different mixtures of CW and CSL. Fraction of
each component
Parameters
Initial wort Fermented wort Fermentation efficiency
CW (X1) CSL (X2) LA (g L -1) FS (g L-1) LA (g L-1) FS (g L-1) Ethanol (g L-1) Nb (%) Np (%) PR (g L-1 h-1) 1.00 0.00 2.15 ± 0.05e 123.82 ± 2.56b 4.84 ± 0.11e 20.15 ± 0.07b 41.77 ± 0.15d 78.88 ± 1.91cd 66.03 ± 1.32d 1.55 ± 0.01d
1.00 0.00 2.15 ± 0.05e 128.51 ± 0.62a 5.12 ± 0.10f 20.32 ± 0.07a 42.97 ± 0.12c 77.72 ± 0.00cd 65.43 ± 0.25d 1.59 ± 0.00c
1.00 0.00 2.27 ± 0.06e 127.56 ± 1.77a 5.18 ± 0.10f 12.22 ± 0.05c 42.37 ± 0.47cd 71.88 ± 1.21e 65.00 ± 1.04d 1.57 ± 0.02cd
0.00 1.00 5.30 ± 0.25a 107.14 ± 1.50e 6.90 ± 0.09a 0.18 ± 0.00g 50.20 ± 0.79a 91.86 ± 1.74ab 91.72 ± 1.74a 1.86 ± 0.03a
0.00 1.00 5.16 ± 0.17a 107.21 ± 1.52e 6.91 ± 0.08a 0.24 ± 0.00g 50.83 ± 0.23a 93.07 ± 1.11a 92.88 ± 1.10a 1.88 ± 0.01a
0.50 0.50 3.66 ± 0.05c 119.45 ± 0.70c 5.89 ± 0.02c 6.18 ± 0.02d 46.20 ± 0.30b 79.83 ± 0.94c 75.69 ± 0.89c 1.71 ± 0.01b
0.75 0.25 3.34 ± 0.07d 123.39 ± 0.49b 5.53 ± 0.05d 5.96 ± 0.03f 46.37 ± 0.12b 77.27 ± 0.23d 73.54 ± 0.19c 1.72 ± 0.01b
0.25 0.75 4.21 ± 0.01b 116.00 ± 2.59d 6.19 ± 0.12b 6.09 ± 0.04e 50.43 ± 0.23a 89.83 ± 2.41b 85.11 ± 2.21b 1.87 ± 0.01a
p – Brown
Forsythe* 0.50 0.70 0.90 0.44 0.63 0.66 0.71 0.63
p –
ANOVA** <0.001 <0.001 <0.001 <0.001 <0.001 <0.001 <0.001 <0.001
Note: LA: lactic acid; FS: fermentable sugars (glucose + galactose); Nb: Fermentation Efficiency (%); Np: Process Efficiency (%); PR: ethanol productivity; * Probability value (Brown-Forsythe test for homogeneity of variance); ** Probability value obtained by one-factor ANOVA; ***
Brazilian Journal of Food Research, Campo Mourão, v. 7, n. 3, p. 150-172, set./dez. 2016. Página | 159
The data from experimental design were statistically analyzed using analysis of variance (ANOVA). Lack of fit must be not significant (p > 0.05) and determination coefficient (r²) considered adequate for biological processes (where r² ≥ 0.70 is acceptable) (LUNDSTEDT et al., 1998). The determination coefficient (r²) explained 81 to 99 % of total variance of the responses, confirming the suitability of the model, however, the assessment of all the parameters to indicate this suitability was necessary (BEZERRA et al., 2008; GRANATO; CALADO; JARVIS, 2014; LUNDSTEDT et al., 1998). Thus, the model presented a satisfactory adjustment; considering all the factors the r² and adjusted determination coefficient (r²adj) values were greater than 0.85. The model was also considered predictive and it can be used to optimize the fermentation process in order to maximize the fermentation efficiency. The coefficients of the linear model, where Y was the expected response (fermentation efficiency) and X1 and X2 were the
independent variables (BRUNS; SCARMINO; BARROS, 2006), are expressed in Equation 5.
𝑌 = 75.17𝑋1+ 92.02𝑋2 (5)
The simultaneous optimization method (DERRINGER; SUICH, 1980) was applied for maximum fermentation efficiency, and the best results for ethanol production using the by-products were obtained in the experiment that only contained CSL. To validate the model, the optimal conditions were applied using the same procedures that had been used previously and a comparison was made between the theoretical data provided by the model and the experimental data.
However, due to the lack of statistical difference between the fermentation efficiency and productivity yield of the points containing 100 % CSL and those containing 25 % CW and 75 % CSL (as shown in Table 3) it was decided develop the fermentation kinetics considering both points. From here on, those experiments will be referred to as Experiment 1 (100 % CSL) and Experiment 2 (25 % CW with 75 % CSL). Furthermore, the fermentation kinetics was also assessed when pasteurization was replaced by antibiotic treatment (sodium monensin) as the contaminant control. The theoretical values obtained for the efficiency of fermentation of Experiments 1 and 2 were 92.02 % and 87.81 %, respectively after the repetition of the experiments. When the theoretical and practical values were compared, both of them had low values for the absolute error (< 2 %), indicating that this model can be used for predictive purposes.
FERMENTATION KINETICS
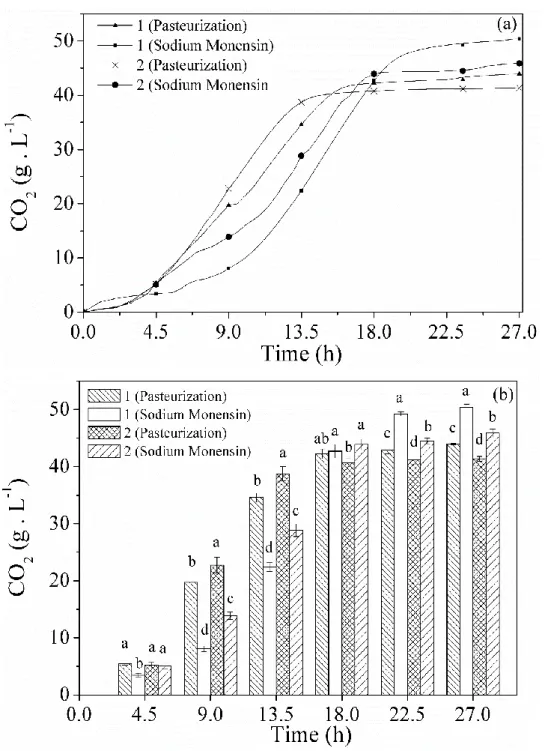
The fermentation was monitored by weight loss, indicating the amount of carbon dioxide (CO2) released during the process, as can be seen in Figure 1.
Brazilian Journal of Food Research, Campo Mourão, v. 7, n. 3, p. 150-172, set./dez. 2016. Página | 160
analysis of the experimental points.
Figure 1 - (a) Carbon dioxide release curve during fermentative process of different worts using pasteurization and sodium monensin for contamination control; (b) statistical
Note: Experiment 1 - 100 % CSL; Experiment 2 - 25 % CW and 75 % CSL. Different letters in the same group represent significant difference according to Fisher LSD test (p<0.05).
During fermentation, carbon dioxide is formed from the conversion of carbohydrates present in the wort. Glucose (C6H12O6) is converted into two
molecules of carbon dioxide (CO2) and two of ethanol (C2H6O) (ANTONI et al.,
2007). For this reason, it is possible to use the liberation of carbon dioxide as a parameter to monitor the fermentation process. In the carbon dioxide release curve the three phases in the fermentation process can be observed (Fig. 1): the preliminary phase (between 0 and 4.5 h); the tumultuous phase (between 4.5
Brazilian Journal of Food Research, Campo Mourão, v. 7, n. 3, p. 150-172, set./dez. 2016. Página | 161
and 18 h) and the final phase (after 18 h). During the tumultuous phase greater carbon dioxide release occurs and the glucose is quickly consumed by the yeast, which consequently results in greater ethanol production. The curve representing the wort containing 25 % whey (Experiment 2) reached the final phase in a shorter time and had a lower carbon dioxide release than the wort with 100 % corn steep liquor (Experiment 1). This fact can be related with the presence of galactose in this wort, since itis consumed by S. cerevisiae but at lower rates, even after the exhaustion of glucose (MEHAIA; CHERYAN, 1990; PARK et al., 2014). To evaluate the fermentation kinetics, the following variables were considered: the amount of substrate transformed or utilized by the yeast; the variation of biomass concentration and the amount of product formed. These data, when plotted as a function of fermentation time, represented the kinetics of the process, as shown in Figure 2.
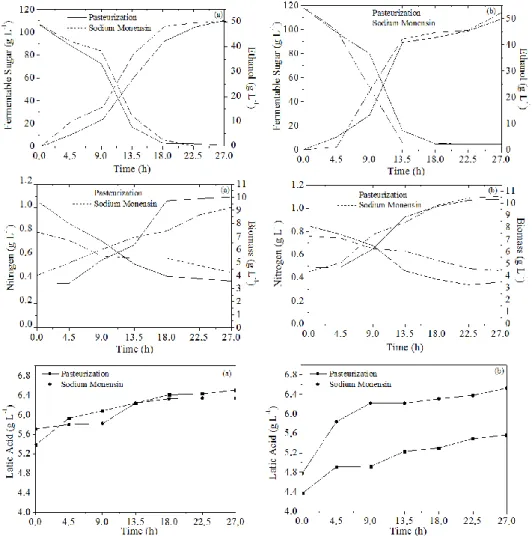
Nitrogen consumption during fermentation is directly associated with the growth phase and the maximum yeast population (ALBERTI et al., 2011). In the present study, it was observed that after 18 hours of fermentation, when the log phase ended, the nitrogen consumption was nearly zero (Fig. 2). The same behavior was observed for the consumption of sugar and for the generation of ethanol; they were maximum in the tumultuous phase and remained practically stable after 18 hours of fermentation (Fig. 2). In terms of the fermentative kinetics, when using sodium monensin the profile of sugar and nitrogen consumption, as well as that of the biomass and ethanol production, was similar to that of the pasteurized wort.
For both experiments the production of lactic acid (Fig. 2) occurred in the first hours of fermentation, in the preliminary phase, when the yeast was still adjusting to the wort to produce ethanol, and then, in the log phase, the lactic acid concentration became constant. According to Stroppa et al. (2000) sodium monensin reduces the load of lactic acid bacteria, which are present in the wort, approximately during the first six hours of fermentation. This may explain the longer duration of the preliminary phase, regarding carbon dioxide release (Fig. 1a) if compared to the same experiment using pasteurization (Fig. 1b). The preliminary phase proportionally increases the initial and produced lactic acid concentration of the wort (ABBOTT; INGLEDEW, 2004).
According to Makanjuola; Tymon and Springham (1992) contamination by bacteria inhibits the production of ethanol not only because they compete with yeasts for sugars, but also because they render the yeast incapable of making full use of the sugars. With the use of sodium monensin, lower levels of lactic acid were achieved, which is desirable. Without the application of any treatment against contaminants, after 27 hours the acidity of the worts reached 7.63 g L-1
and 7.28 g L-1 of lactic acid for Experiment 1 and Experiment 2, respectively.
There was no ethanol production from any of the worts (data not shown).
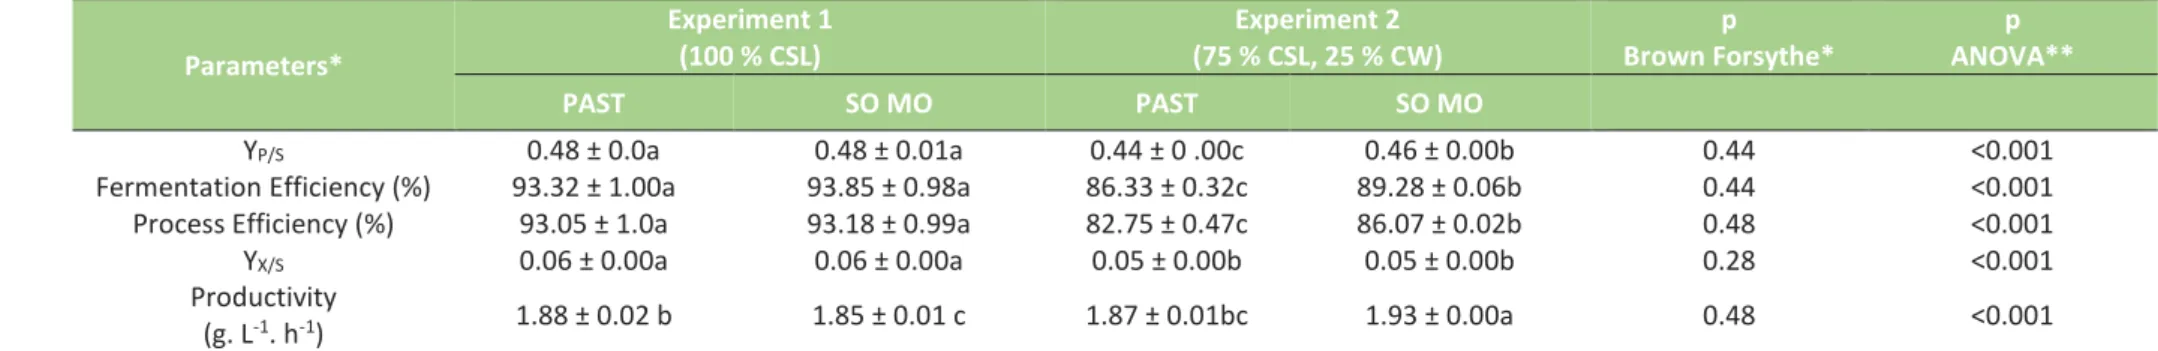
Comparing the fermentation parameters (Table 4), the wort containing 100 % CSL had the best results regarding fermentation efficiency, with a higher conversion of sugar to ethanol. However, the wort containing 25 % CW and 75 % CSL also presented favorable results. According to Dien; Cotta and Jeffries (2003) the traits necessary for industrial ethanol production from microorganism are: ethanol yield greater than 90 % from theoretical, ethanol tolerance superior a 40 g L-1, productivity greater than 1 g L-1 h-1, among other features. In all the
Brazilian Journal of Food Research, Campo Mourão, v. 7, n. 3, p. 150-172, set./dez. 2016. Página | 162
Other studies also suggested high productivities in alternative worts supplemented with CSL (DIEN; COTTA; JEFFRIES, 2003).
Figure 2 - Fermentative kinetics using different contamination control: Fermentable sugar concentration and Ethanol production; Nitrogen consumption, Biomass production and
Lactic Acid production for (a) Experiment 1 (100% CSL) and (b) Experiment 2 (75 % CSL and 25 % CW).
The µmax was obtained by linear regression and considering the range
between 9 and 18 hours of fermentation, which corresponded to the exponential growth phase. The µmax was greater in the pasteurized wort (0.07 h-1 for
Experiment 1 and 0.05 h-1 for Experiment 2) than when the antibiotics were
added (0.02 h-1 for Experiment 1 and 0.03 h-1 for Experiment 2). Thus, the use of
antibiotics reduced the µmax., which is interesting because according to some studies, smaller values of µmax result in high ethanol yields (BASSO et al., 2008; BASSO et al., 2011; BOENDER et al., 2009). The smaller value of µmax was reflected
directly in the efficiency of the fermentation and the process. Table 4 demonstrates that the worts treated with antibiotics showed a greater efficiency than the correspondent pasteurized worts. Comparing the different experiments, the wort containing 100 % CSL presented better results than the wort containing 25 % CW.
Brazilian Journal of Food Research, Campo Mourão, v. 7, n. 3, p. 150-172, set./dez. 2016.
Table 4 - Fermentation parameters considering different strategies for control of contaminants. Parameters* Experiment 1 (100 % CSL) Experiment 2 (75 % CSL, 25 % CW) p Brown Forsythe* p ANOVA** PAST SO MO PAST SO MO YP/S 0.48 ± 0.0a 0.48 ± 0.01a 0.44 ± 0 .00c 0.46 ± 0.00b 0.44 <0.001
Fermentation Efficiency (%) 93.32 ± 1.00a 93.85 ± 0.98a 86.33 ± 0.32c 89.28 ± 0.06b 0.44 <0.001
Process Efficiency (%) 93.05 ± 1.0a 93.18 ± 0.99a 82.75 ± 0.47c 86.07 ± 0.02b 0.48 <0.001
YX/S 0.06 ± 0.00a 0.06 ± 0.00a 0.05 ± 0.00b 0.05 ± 0.00b 0.28 <0.001
Productivity
(g. L-1. h-1) 1.88 ± 0.02 b 1.85 ± 0.01 c 1.87 ± 0.01bc 1.93 ± 0.00a 0.48 <0.001
Note: PAST: pasteurization; SO MO: Sodium Monensin; *evaluated after 27 h of fermentation ** Probability value from Brown-Forsythe test for homogeneity of variance; *** Probability value from one-factor ANOVA; **** Different letters in the same line represent significant difference
according to Fisher LSD test (p<0.05).
The use of alternative antimicrobials such as antibiotics may have a positive effect on both the improvement of fermentation efficiency and the economic value of bioethanol production because they are effective against most contaminants in industrial fermentation systems carried out by conventional yeast (MUTHAIYAN; LIMAYEM; RICKE, 2011). Furthermore, treatments such as pasteurization require different installations, high-cost energy for heating and cooling the wort before inoculation. The use of antibiotics requires small dosages to be effective against contaminants and the treatment of the wort can be done inside fermentation tanks without need to adapt the production plant. The residual biomass and wort of both processes can be employed for animal feed as long as the concentration of residual monensin is controlled. Monensin is used extensively as a promoter of growth, mainly in cattle, suggesting therefore a use of the entire biomass generated in the process.
Brazilian Journal of Food Research, Campo Mourão, v. 7, n. 3, p. 150-172, set./dez. 2016. Página | 164
CONCLUSION
CW and CSL presented nutrients that can be used by S. cerevisiae yeast in alcoholic fermentation. By considering the experimental design for the binary mixture it was observed that the increase in fermentation efficiency was proportional to the presence of CSL in the wort. All the experiments were considered to be highly efficient and highly productive, reaching a maximum efficiency regarding ethanol of 93.85 %. Both pasteurization and the use of antibiotics to control contaminants in the fermentation were effective, and in the case of antibiotics, the application was simple, being added directly in the fermentation tank.
Brazilian Journal of Food Research, Campo Mourão, v. 7, n. 3, p. 150-172, set./dez. 2016. Página | 165
ACKNOWLEDGMENT
The authors thank to CNPq and CAPES for financial support.
REFERENCES
ABBOTT, D. A.; INGLEDEW, W. M. Buffering capacity of whole corn mash alters concentrations of organic acids required to inhibit growth of Saccharomyces
cerevisiae and ethanol production. Biotechnology Letters, v. 26, p. 1313-1316,
2004.
http://link.springer.com/article/10.1023%2FB%3ABILE.0000044924.76429.71
ALBERTI, A.; VIEIRA, R. G.; DRILLEAU, J. F.; WOSIACKI, G.; NOGUEIRA, A. Apple wine processing with different nitrogen contents. Brazilian Archives of Biology and Technology, v. 54, n. 3, p. 551-558, 2011.
http://www.scielo.br/scielo.php?script=sci_arttext&pid=S1516-89132011000300017
ALSAED, A. K.; AHMAD, R.; ALDOOMY, H.; EL-QADER, S. A.; SALEH, D.; SAKEJHA, H.; MUSTAFA, L. Characterization, concentration and utilization of Sweet and acid whey. Pakistan Journal of Nutrition, v. 12, n. 2, p. 172-177, 2013.
American Public Health Association. APHA: Standard Methods for the Examination of Water and Wastewater, Washington, DC, 1998.
http://www.icef11.org/content/papers/fpe/FPE454.pdf
AMORIM, H. V.; LOPES M. L.; OLIVEIRA, J. V. C.; BUCKERIDGE, M. S.; GOLDMAN, G. H. Scientific challenges of bioethanol production in Brazil. Applied
Microbiology and Biotechnology, v. 91, n. 1, p. 1267-1275, 2011.
http://www.ncbi.nlm.nih.gov/pubmed/21735264
ANTONI, D.; ZVERLOV, V.; SCHWARZ, W.; ANTONI, D.; ZVERLOV, V.; SCHWARZ, W. Biofuels from microbes. Applied Microbiology and Biotechnology, v. 77, n. 1, p. 23-35, 2007. www.ncbi.nlm.nih.gov/pubmed/17891391
ARIAS-GIL, M.; GARDE-CERDÁN, T.; ANCÍN-AZPILICUETA, C. Influence of addition of ammonium and different amino acid concentrations on nitrogen metabolism in spontaneous must fermentation. Food Chemistry, v. 103, n. 4, p. 1312-1318, 2007. http://www.sciencedirect.com/science/article/pii/S0308814606008260
BAI, F.W.; ANDERSON, W.A.; MOO-YOUNG, M. Ethanol fermentation
technologies from sugar and starch feedstocks. Biotechnology Advances, v. 26, n. 1, p. 89-105, 2008.
Brazilian Journal of Food Research, Campo Mourão, v. 7, n. 3, p. 150-172, set./dez. 2016. Página | 166
BASSO, L.C.; DE AMORIM, H.V.; DE OLIVEIRA, A.J.; LOPES, M.L. Yeast selection
for fuel ethanol production in Brazil. FEMS Yeast Research, v. 8, p. 1155–1163, 2008. http://www.ncbi.nlm.nih.gov/pubmed/18752628
BASSO, T.O.; KOK, S.; DARIO, M.; ESPIRITO-SANTO, J.C.A.; MULLER, G.; SCHLOLG, P.S.; SILVA, C. P.; TONSO, A.; DARAN, J-M.; GOMBERT, A. K.; VAN MARIS, A. J. A.; PRONK, J. T.; STAMBUK, B. U. Engineering topology and kinetics of sucrose metabolism in Saccharomyces cerevisiae for improved ethanol yield. Metabolic Engineering, v. 13, p. 649-703, 2011. www.ncbi.nlm.nih.gov/pubmed/21963484
BECKNER, M.; IVEY, M. L.; PHISTER, T. G. Microbial contamination of fuel ethanol fermentations. Letters in Applied Microbiology, v. 53, p. 387-394, 2011.
www.ncbi.nlm.nih.gov/pubmed/21770989
BEHERA, S.; MOHANTY, R. C.; RAY, R. C. Ethanol fermentation of sugarcane molasses by Zymomonas mobilis MTCC 92 immobilized in Luffa cylindrica L. sponge discs and Ca-alginate matrices. Brazilian Journal of Microbiology, v. 43, n. 4, p. 1499-1507, 2012.
http://www.scielo.br/scielo.php?script=sci_arttext&pid=S1517-83822012000400034
BEZERRA, M. A.; SANTELLI, R. E.; OLIVEIRA, E. P.; VILLAR, L. S.; ESCALEIRA, L. A. Response surface methodology (RSM) as a tool for optimization in analytical chemistry. Talanta, v. 75, n. 5, p. 965-977, 2008.
http://www.sciencedirect.com/science/article/pii/S0039914008004050
BLIGH, E.G; DYER, W.J. A rapid method for total lipid extraction and purification. Canadian Journal of Biochemistry and Physiology, v. 37, n. 8, p. 911-917, 1959.
http://www.nrcresearchpress.com/doi/abs/10.1139/o59-099
BOENDER, L. G.; DE HULSTER, E. A.; VAN MARIS, A. J.; DARAN-LAPUJADE, P. A.; PRONK, J. T. Quantitative physiology of Saccharomyces cerevisiae at near-zero specific growth rates. Applied and environmental microbiology, v. 75, n. 17, p. 5607-5614, 2009. http://www.ncbi.nlm.nih.gov/pmc/articles/PMC2737911/
BRUNS, R. E.; SCARMINIO, I. S.; BARROS, B, N. Statistical design-chemometrics. Elsevier, v.25, 2006.
CARDONA, C. A.; SÁNCHEZ, O. J. Fuel ethanol production: Process design trends and integration opportunities. Bioresource Technology, v. 98, p. 2415-2457, 2007. http://www.sciencedirect.com/science/article/pii/S0960852407000156
Brazilian Journal of Food Research, Campo Mourão, v. 7, n. 3, p. 150-172, set./dez. 2016. Página | 167
CARVALHO, F.; PRAZERES, A. R.; RIVAS, J. Cheese whey wastewater:
Characterization and treatment. Science of The Total Environment, v. 445–446, p. 385-396, 2013.
http://www.sciencedirect.com/science/article/pii/S0048969712015896
CHANDRAKANT, P.; BISARIA, V. S. Simultaneous bioconversion of glucose and xylose to ethanol by Saccharomyces cerevisiae in the presence of xylose isomerase. Applied Microbiology and Biotechnology, v. 53, n. 3, p. 301-309, 2000.
http://link.springer.de/link/service/journals/00253/bibs/0053003/00530301.htm
CHOI, G. W.; UM, H. J.; KANG, H. W.; KIM, Y.; KIM, M.; KIM, Y. H. Bioethanol production by a flocculent hybrid, CHFY0321 obtained by protoplast fusion between Saccharomyces cerevisiae and Saccharomyces bayanus. Biomass and Bioenergy, v. 34, n. 8, p. 1232-1242, 2010.
http://www.sciencedirect.com/science/article/pii/S0961953410001133
CHOI, J. D. R.; JANG, Y. S.; CHO, J. H.; SEUNG, D.; LEE, S. Y.; PAPOUTSAKIS, E. T.; BENNETT, G. N.; SONG, H. Characterization and evaluation of corn steep liquid in acetone-butanol-ethanol production by Clostridium acetobutylicum.
Biotechnology and Bioprocess Engineering, v. 18, n. 2, p. 266-271, 2013.
http://link.springer.com/article/10.1007%2Fs12257-012-0619-8
COMPART, D. P.; CARLSON, A. M.; CRAWFORD, G. I; FINK, R. C., DIEZ-GONZALEZ, F.; DICOSTANZO, A.; SHURSON, G. C. Presence and biological activity of antibiotics used in fuel ethanol and corn co-product production. Journal of Animal Science, v. 91, n. 5, p. 2395-2404, 2013. www.ncbi.nlm.nih.gov/pubmed/23463564
DERRINGER, G.; SUICH, R. Simultaneous optimization of several response variables. Journal of Quality Technology, v. 12, p. 214–219, 1980.
DIEN, B. S.; COTTA, M. A.; JEFFRIES, T. W. Bacteria engineered for fuel ethanol production: current status. Applied Microbiology and biotechnology, v. 63, n. 3, p. 258-266, 2003. www.ncbi.nlm.nih.gov/pubmed/13680206
DODIĆ, S.; POPOV, S.; DODIĆ, J.; RANKOVIĆ, J.; ZAVARGO, Z.; JEVTIĆ MUČIBABIĆ, R. Bioethanol production from thick juice as intermediate of sugar beet
processing. Biomass and Bioenergy, v. 33, n. 5, p. 822-827, 2009.
http://www.sciencedirect.com/science/article/pii/S0961953409000117
EDWINOLIVER, N. G.; THIRUNAVUKARASU, K.; PURUSHOTHAMAN, S.; ROSE, C.; GOWTHAMAN, M. K.; KAMINI, N. R. Corn steep liquor as a nutrition adjunct for the production of Aspergillus niger lipase and hydrolysis of oils thereof. Journal of
Brazilian Journal of Food Research, Campo Mourão, v. 7, n. 3, p. 150-172, set./dez. 2016. Página | 168
Agricultural and Food Chemistry, v. 57, n. 22, p. 10658-10663, 2009.
www.ncbi.nlm.nih.gov/pubmed/19860451
GAO, Y.; YUAN, Y. J. Comprehensive quality evaluation of corn steep liquor in 2-keto-L-gulonic acid fermentation. Journal of agricultural and food chemistry, v. 59, n. 18, p. 9845-9853, 2011. www.ncbi.nlm.nih.gov/pubmed/21793578
GRANATO, D.; CALADO, V. M. A.; JARVIS, B. Observation on the use of statistical methods in Food Science and Technology. Food Research International, v. 55, p. 137-149, 2014.
http://www.sciencedirect.com/science/article/pii/S0963996913005723
GUIMARÃES, P. M. R.; TEIXEIRA, J. A.; DOMINGUES, L. Fermentation of lactose to bio-ethanol by yeasts as part of integrated solutions for the valorization of cheese whey. Biotechnology Advances, v. 28, n. 3, p. 375-384, 2010.
http://www.sciencedirect.com/science/article/pii/S0734975010000224
HYNES, S.; KJARSGAARD, D.; THOMAS, K.; INGLEDEW, W. Use of virginiamycin to control the growth of lactic acid bacteria during alcohol fermentation. Journal of Industrial Microbiology and Biotechnology, v. 18, n. 4, p. 284-291, 1997.
http://link.springer.com/article/10.1038/sj.jim.2900381
JIRANEK, V.; LANGRIDGE, P.; HENSCHKE. Amino Acid and Ammonium Utilization by Saccharomyces cerevisiae Wine Yeasts from a Chemically Defined Medium. American Journal of Enology and Viticuluture, v. 46, n. 1, p. 75-83, 1995.
http://www.ajevonline.org/content/46/1/75.abstract
LEITE, A. R; GUIMARÃES, W. V.; ARAÚJO, E. F.; SILVA, D. O. Fermentation of sweet whey by recombinant Escherichia Coli KO11. Brazilian Journal of Microbiology, v. 31, p. 212-215, 2000.
http://www.scielo.br/scielo.php?script=sci_arttext&pid=S1517-83822000000300011
LEITE, R. C. C.; LEAL, M. R. L. V.; CORTEZ, L. A. B.; GRIFFIN, W. M.; SCANDIFFIO, M. I. G. Can Brazil replace 5% of the 2025 gasoline world demand with ethanol? Energy, v. 34, p. 655-661, 2008.
http://www.sciencedirect.com/science/article/pii/S0360544208002958
LOSS, E.; ROYER, A. R.; BARRETO-RODRIGUES, M.; BARANA, A. C. Use of maize wastewater for the cultivation of the Pleurotus spp. mushroom and optimization of its biological efficiency. Journal of Hazardous Materials, v. 166, n. 2, p. 1522-1525, 2009.
Brazilian Journal of Food Research, Campo Mourão, v. 7, n. 3, p. 150-172, set./dez. 2016. Página | 169
LOWICKI, D.; HUCZYNSKI, A. Structure and Antimicrobial Properties of Monensin A and Its Derivatives: Summary of the Achievements. BioMed Research
International, v. 2013, p. 1-14, 2013. www.ncbi.nlm.nih.gov/pubmed/23509771
LUNDSTEDT, T.; SEIFERT, E.; ABRAMO, L.; THELIN, B.; NYSTROM, A.; PETTERSEN, J.; BERGMAN, R. Experimental design and optimization. Chemometrics and intelligent laboratory systems, v. 42, p. 3-40, 1998.
http://www.sciencedirect.com/science/article/pii/S0169743998000653
MADDIPATI, P.; ATIYEH, H. K.; BELLMER, D. D.; HUHNKE, R. L. Ethanol production from syngas by Clostridium strain P11 using corn steep liquor as a nutrient replacement to yeast extract. Bioresource Technology, v. 102, n. 11, p. 6494-6501, 2011.
http://www.sciencedirect.com/science/article/pii/S0960852411004044
MAKANJUOLA, D. B.; TYMON, A.; SPRINGHAM, D. G. Some effects of lactic acid bacteria on laboratory-scale yeast fermentations. Enzyme and Microbial Technology, v. 14, p. 350-357, 1992.
http://www.sciencedirect.com/science/article/pii/0141022992900026
MEHAIA, M. A.; CHERYAN, M. Ethanol from hydrolyzed whey permeate using
Saccharomyces cerevisiae in a membrane recycle bioreactor. Bioprocess
Engineering, v. 5, n. 2, p. 57-61, 1990.
http://link.springer.com/article/10.1007%2FBF00589146
MOREIRA, N. L.; SANTOS L. F.; SOCCOL C. R.; SUGUIMOTO H. H. Dynamics of ethanol production from deproteinized whey by Kluyveromyces marxianus: An analysis about buffering capacity, thermal and nitrogen tolerance. Brazilian Archives of Biology and Technology. v. 58, p. 454-461, 2015.
http://www.scielo.br/scielo.php?script=sci_arttext&pid=S1516-89132015000300454
MUTHAIYAN, A.; LIMAYEM, A.; RICKE, S. C. Antimicrobial strategies for limiting bacterial contaminants in fuel bioethanol fermentations. Progress in Energy and Combustion Science, v. 37, p. 351-370, 2011.
http://www.sciencedirect.com/science/article/pii/S0360128510000547
NARENDRANATH, N. V.; POWER, R. Relationship between pH and Medium Dissolved Solids in Terms of Growth and Metabolism of Lactobacilli and
Saccharomyces cerevisiae during Ethanol Production. Applied and Environmental Microbiology, v. 71, n. 5, p. 2239-2243, 2005.
Brazilian Journal of Food Research, Campo Mourão, v. 7, n. 3, p. 150-172, set./dez. 2016. Página | 170
Official Methods of Analysis of AOAC International. AOAC 2000: Agricultural chemicals, contaminants, drugs. AOAC International, Washington, DC, 2000.
OSUNKOYA, O. A.; OKWUDINKA, N. J. Utilization of sugar refinery waste (molasses) for ethanol production using Saccharomyces cervicae. American Journal of Scientific and Industrial Research, v. 2, n. 4, p. 694-706, 2011.
http://www.scihub.org/AJSIR/PDF/2011/4/AJSIR-2-4-694-706.pdf
PAREKH, M.; VINCI, V. A.; STROBEL, R. J. Improvement of microbial strain and fermentation processes. Applied Microbiology and Biotechnology, v. 54, p. 287-301, 2000. http://link.springer.com/article/10.1007/s002530000403
PARK, J-H.; KIM, S-H. K.; PARK, H-D.; KIM, J. S.; YOON, J-J. Simultaneous
utilization of galactose and glucose by Saccharomyces cerevisiae mutant strain for ethanol production. Renewable Energy, v. 65, p.213-218, 2014.
http://www.sciencedirect.com/science/article/pii/S0960148113004771
PRAZERES, A. R.; CARVALHO, F.; RIVAS, J. Cheese whey management: A review. Journal of Environmental Management, v. 110, p. 48-68, 2012.
http://www.sciencedirect.com/science/article/pii/S0301479712002769
PRESSMAN, B. C. Biological Applications of Ionophores. Annual Review of Biochemistry, v. 45, p. 501-530, 1976.
http://www.annualreviews.org/doi/abs/10.1146/annurev.bi.45.070176.002441
RAJA, R. S.; MANISEKAR, K.; MANIKANDAN, V. Study on mechanical properties of fly ash impregnated glass fiber reinforced polymer composites using mixture design analysis. Materials & Design, v. 55, p. 499-508, 2014.
http://www.sciencedirect.com/science/article/pii/S0261306913009539
ROGER, J.-M.; SABLAYROLLES, J.-M.; STEYER, J.-P.; BELLON-MAUREL, V. Pattern analysis techniques to process fermentation curves: Application to discrimination of enological alcoholic fermentations. Biotechnology and Bioengineering, v. 79, n. 7, p. 804-815, 2002. www.ncbi.nlm.nih.gov/pubmed/12209803
SADDOUD, A.; HASSAIRI, I.; SAYADI, S. Anaerobic membrane reactor with phase separation for the treatment of cheese whey. Bioresource technology, v. 98, n. 11, p. 2102-2108, 2007.
http://www.sciencedirect.com/science/article/pii/S0960852406004238
SILVA, A. C.; GUIMARÃES, P. M.; TEIXEIRA, J. A.; DOMINGUES, L. Fermentation of deproteinized cheese whey powder solutions to ethanol by engineered
Brazilian Journal of Food Research, Campo Mourão, v. 7, n. 3, p. 150-172, set./dez. 2016. Página | 171
repeated-batch operation with biomass recycling by flocculation. Journal of Industrial Microbiology & Biotechnology, v. 37, n. 9, p. 973-982, 2010.
http://www.ncbi.nlm.nih.gov/pubmed/20535525
STROPPA, C. T.; ANDRIETTA, M. G.; ANDRIETTA, S. R.; STECKELBERG, C.; SERRA, G. E. Use of penicillin and monensina to control bacteria. International Sugar Journal, v. 102; n. 1214, p. 78-94, 2000.
VILANOVA, M.; UGLIANO, M.; VARELA, C.; SIEBERT, T.; PRETORIUS, I. S.; HENSCHKE, P. A. Assimilable nitrogen utilisation and production of volatile and non-volatile compounds in chemically defined medium by Saccharomyces
cerevisiae wine yeasts. Applied Microbiology and Biotechnology. v.77, n. 1, p.
145-157, 2007. http://link.springer.com/article/10.1007%2Fs00253-007-1145-z
XI, Y.-L.; CHEN, K.-Q.; DAI, W.-Y.; MA, J.-F.; ZHANG, M.; JIANG, M.; WEI, P.; OUYANG, P.-K. Succinic acid production by Actinobacillus succinogenes NJ113 using corn steep liquor powder as nitrogen source. Bioresource Technology, v. 136, p. 775-779, 2013. http://www.ncbi.nlm.nih.gov/pubmed/23558185
XIAO, X.; HOU. Y.; LIU, Y.; LIU, Y.; ZHAO, H.; DONG, L.; DU, J.; WANG, Y.; BAI, G.; LUO, GUOAN. Classification and analysis of corn steep liquor by UPLC/Q-TOF MS and HPLC. Talanta, v. 107, p. 344-348, 2013.
www.ncbi.nlm.nih.gov/pubmed/23598232
YANG, T.-W.; RAO, Z.-M.; ZHANG, X.; XU, M.-J.; XU, Z.-H.; YANG, S.-T. Effects of corn steep liquor on production of 2,3-butanediol and acetoin by Bacillus subtilis. Process Biochemistry, v. 48, n. 11, p. 1610-1617, 2013.
http://www.sciencedirect.com/science/article/pii/S1359511313004121?np=y
YASMIN, A.; BUTT, M. S.; SAMEEN, A.; SHASHID, M. Physicochemical and Amino Acid Profiling of Cheese Whey. Pakistan Journal of Nutrition, v. 12, n. 5, 2013.
Brazilian Journal of Food Research, Campo Mourão, v. 7, n. 3, p. 150-172, set./dez. 2016. Página | 172 Recebido:02 mai. 2016. Aprovado: 23 jun. 2016. DOI: 10.14685/rebrapa.v7n3.3935 Como citar:
FARIAS, F. O. et al. Mixture design applied to the study of bioethanol production from cheese whey and corn steep liquor. Brazilian Journal of Food Research, Campo Mourão, v. 7, n.3, p. 150-172, set./dez. 2016.Disponívelem: https://periodicos.utfpr.edu.br/rebrapa
Correspondência: Fabiane Oliveira Farias
Universidade Estadual de Ponta Grossa, R. Cel. Bitencourt, 689 - Centro, CEP 84010-290, Ponta Grossa - PR, Brasil
Direito autoral: Este artigo está licenciado sob os termos da Licença CreativeCommons-Atribuição 4.0