DOI: 10.25286/repa.v4i3.979
24
A Web-based Application to Estimate the Total
Exposure Ratio Due to Base Stations
Um Aplicativo Web para Estima a Taxa de Exposição Total Devido a Estações Base
Leandro Carísio Fernandes1 orcid.org/0000-0002-4114-23341Universidade de Brasília, Brasília, Brasil
E-mail:carisio@gmail.com
ABSTRACT
There is a global concern about radiation from telecommunications base stations. Although there is no evidence that this radiation cause adverse health effects if its level is below some reference level, people continue to fear its effects. In a recent survey in Europe, 70% of the respondents believe that this radiation have some effects on health. This can impact the country-s legislation, setting unnecessary rules to deploy new base stations.To shed light on this subject, this paper proposes a web-based application to estimate the amount of radiation emitted by base stations. With this tool, the general public can easily check an upper limit for the total exposure ratio in any location with just a click on a map. The software can also be used by public authorities to find locations where measurements are necessary.
KEY-WORDS:Total exposure ratio; Radiation; Base stations. RESUMO
Existe uma fonte de preocupação global em relação à radiação emitida por estações radiobase. Embora não haja evidências de que esta radiação cause efeitos adversos à saúde se o seu nível estiver abaixo de determinados limites de referências, as pessoas continuam temendo seus efeitos. Em uma recente pesquisa realizada na Europa, aproximadamente 70% dos respondentes disseram acreditar que esta radiação causa algum efeito na saúde. Esse tipo de receio da opinião pública pode ter impacto inclusive na legislação do país, definindo regras desnecessárias para a implantação de novas estações radiobase. Como uma forma de lançar luz a este tema, este artigo propõe uma aplicação web para estimar o total de radiação emitida por estações radiobase. Com essa ferramenta, o público em geral pode verificar, com apenas um clique em um mapa, um limite superior para a exposição a campos eletromagnéticos em qualquer localidade, informando se determinada localidade adere aos limites ou não. O software também pode ser utilizado por entes reguladores para encontrar locais onde medições são necessárias.
1 INTRODUCTION
Human exposure to radiation emitted by telecommunications base stations still concerns the public. In a survey on electromagnetic fields (EMF) conducted by the European Commission, 70% of the respondents believe that mobile phone masts have at least some effects on health [1]. This concern has also been reported in different countries[1-5].
Nevertheless, up to date, there is no evidence that the radiation emitted by mobile telephony base stations cause adverse health effects [6]. Due to their characteristics (antennas with narrow beam not pointing to the ground, usually deployed in rooftops or with some height, power level decreasing quickly with distance, etc [3]), the exposure ratio from base stations usually range from 0.002% to 2% of the international reference levels [6]. The same occurs in inhabited areas near broadcasting facilities: measurements from the Federal Communications Commission (FCC) show that the exposure is well below the limits[7].
On the one hand, there are no health effects due to the exposure from base station radiation. On the other hand, citizens still fear EMF radiation emitted by them. Since the public opinion influences legislators, these concerns can affect the deployment of new base stations [8]. For instance, in Brazil there is a Federal Law that enforces the regulatory agency to measure the exposure level around base stations located in critical areas (defined as those up to 50 m from hospitals, schools, etc.) [9], which can increase the cost to deploy a base station without any reasonable reason[10].
There is a need to better inform citizens. Special Eurobarometer 347 concludes that “regardless of whether or not EMF do actually damage public health, the average EU citizen believes that public authorities do not do enough to protect them from their potential health risks” [1]. The issue is with the perception of the risk.
It is necessary to be transparent about this topic. To assist the dissemination of data relating
to non-ionizing radiation due to
telecommunications base station, this paper reviews a methodology to estimate the total exposure ratio from the telecommunications base stations. Then, a web-based application to estimate an upper limit for the total exposure ratio is proposed [11]. This tool can be used in
two ways: by the general public, to check if any location is considered safe; and by the regulators, to simultaneously check critical areas, which can support some decisions (e.g. select specific location to measure the total exposure ratio). The source code is available to the public[12].
2 REVIEW
In this paper, a base station is considered as a physical structure with one or more radio sources, each of them transmitting at some frequency. Our intention is to calculate the exposure ratio due to all radio sources of the base stations at some probe and check if it complies with the international reference limits.
The total exposure ratio (TER) at some location is defined as[13]:
im S S1im (1)
Where ERi is the exposure ratio due to the
radio source i and, in the far-field, is defined as [13]:
im S ii
ච (2)
Where E (V/m) is the electric field at that probe location and Elim (V/m) is the electric field
limit, both at the same frequency of the radio source. The International Commission on Non-Ionizing Radiation (ICNIRP) has a guideline establishing safety levels for EMF. Table 1 shows the reference level for the electric field for general public exposure.
Table 1:Reference levels for general public exposure to time-varying electric fields[14, 15].
f is the frequency of the radio source, in MHz.
If the TER ≤ 100% in some location, its radiation level complies with the limits of Table 1 [16]. Measure the electric field at all possible locations is an impossible task. An alternative is
Frequency range E-field strength (V/m)
3 kHz – 10 MHz 83
10 – 400 MHz 28
400 – 2,000 MHz 1.375
estimate its value. Since we are dealing with estimates of the exposure from base station radiation, it is necessary to get a conservative value of TER. One possible estimate for the electric field is[16]:
i S U (3)
Where λ (m) is the wavelength of the radio source and Pr;watt is the power received by the
probe, in Watt. In dBm, the power is given by:
S 뒨 뚈 (4-a)
뚈 S Ǥ 1 Ǥ 1 h (4-b)
뒨 S 뒨 චU t (4-c)
t S 1 sin t sin t sin hh for the main lobe for the side lobes (4d)
t Ssin1 (4-e)
S ʹ (4-f)
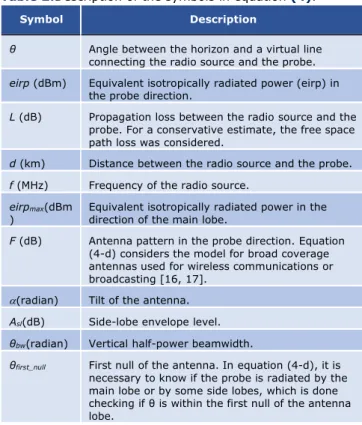
Table 2 describes all the symbols used in the set of equation (4).
Table 2:Description of the symbols in equation(4).
Symbol Description
θ Angle between the horizon and a virtual line connecting the radio source and the probe.
eirp (dBm) Equivalent isotropically radiated power (eirp) in the probe direction.
L (dB) Propagation loss between the radio source and the probe. For a conservative estimate, the free space path loss was considered.
d (km) Distance between the radio source and the probe.
f (MHz) Frequency of the radio source.
eirpmax(dBm
) Equivalent isotropically radiated power in thedirection of the main lobe.
F (dB) Antenna pattern in the probe direction. Equation (4-d) considers the model for broad coverage antennas used for wireless communications or broadcasting [16, 17].
(radian) Tilt of the antenna.
Asl(dB) Side-lobe envelope level.
θbw(radian) Vertical half-power beamwidth.
θfirst_null First null of the antenna. In equation (4-d), it is necessary to know if the probe is radiated by the main lobe or by some side lobes, which is done checking if θ is within the first null of the antenna lobe.
Equation (4-b) uses the free space path loss model. Although it is not suitable for assessing some aspects of the propagation environment (e.g. coverage), we are interested in estimating an upper limit of the TER. Therefore, equation (4-b) should be used to keep our estimate conservative [16]. With equations (1)-(4), it is possible to estimate an upper limit for the TER at any location. It is important to calculate it for three heights (1.1 m, 1.5 m, and 1.7 m) and report the largest value[13].
3 EMF EXPOSURE WEB
To consider a real environment with thousands of base stations, the calculation using the previous approach needs to be done by a computer. For an urban region, there are hundreds or even thousands of base stations, each of them with one or more radio sources. This section proposes a software to estimate the TER using the previous set of equations.
Since the end user of this software might be the general public, it should be user-friendly, intuitive, with just one feature: show if the location complies the limit or not. Besides, it should be easily available, without the need to install it. These characteristics point to a web-based software. In the perspective of the end-user, the software can be described with only one user story: “As a user, I want to view a map with the base stations, click anywhere and check if that location is considered safe”.
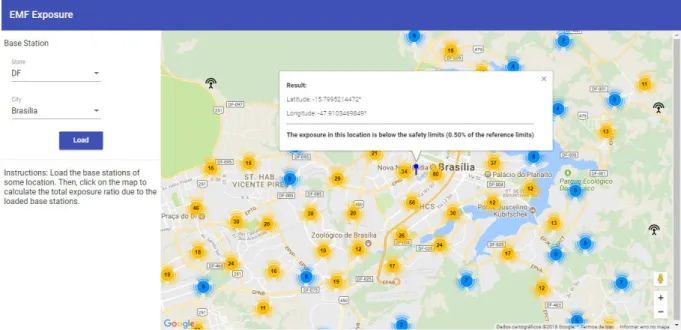
To implement this application, equations (1)-(4) were coded in TypeScript. Then, a Single Page Application (SPA) was built using the Angular framework. The software, EMF Exposure Web, is shown in Figure 1 and its source code is available in [12]. The user selects a city to analyze and clicks the “Load” button. The base stations of that city will be loaded on the map. Depending on the zoom and the position of the base stations, they will be shown as a cluster or with a single icon indicating the base station. If the user clicks at some location, the exposure is estimated, and the result is shown – Figure 1.
Furthermore, there is also a more advanced type of user. Although the end-user is the citizens, some organization should be responsible to provide it. In this case, it should have access to the base station database and can be regulatory bodies, network operators or, if the country has a
public base station database, even a person with some programming knowledge.
To them, an advanced mode is welcome. In this mode, the application allows to estimate the TER in several locations, which allows an in-depth
analysis of the data. Figure 2 shows this mode, with some colored circles representing the TER estimated in several locations, using a pre-defined color scale recommended in[18].
Figure 1:In the left panel, the user chose a city. The map in the right panel shows its base stations. If the user clicks on it, an estimate for the TER is shown in the box.
Source:Author (2018).
Figure 2:Advanced mode. In this mode, the user can estimate the TER for a specific probe height. Besides, using the icon <> in the top-right size of the title bar, the user can view the TER for several locations using a pre-defined color map.
DOI: 10.25286/repa.v4i3.979
28
4 RESULTS
To validate the software, the data of all cellular base stations in crowed regions of four of the most populated Brazilian cities was loaded into the software (Belo Horizonte, Brasília, Rio de Janeiro, and São Paulo). The software with this data is available in[11].
The Brazilian base station database is available to the public [19] and contains the necessary information to estimate the TER using equations (1)-(4). When converting the database, eirpmax
was set equals to 61 dBm for all radio sources, which is a typical value for the maximum eirp of a LTE 5 MHz carrier [20]. Although cellular base stations do not operate with its maximum power the whole time, we are interested in an upper limit for the TER. Note that only the cellular base stations were loaded, so the estimated TER will not consider the contributions of other telecommunications stations.
Using a Monte Carlo method, 20,000 random probes were uniformly distributed over circle with
2 km around a reference location. Figure 3 shows the cumulative distribution function (c.d.f.) of these data for TER ≤ 10%. Table 3 shows more details of the c.d.f.
Figure 3:Cumulative distribution function of the TER.
Source:Author (2018).
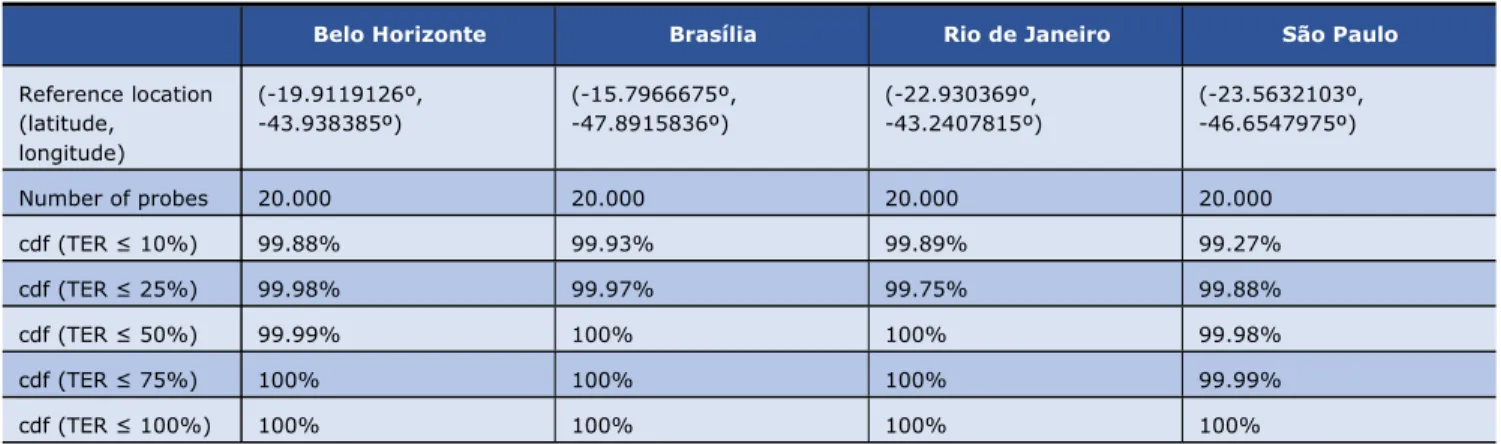
Table 3:Cumulative distribution function of the TER.
Belo Horizonte Brasília Rio de Janeiro São Paulo
Reference location (latitude, longitude) (-19.9119126º, -43.938385º) (-15.7966675º,-47.8915836º) (-22.930369º,-43.2407815º) (-23.5632103º,-46.6547975º) Number of probes 20.000 20.000 20.000 20.000 cdf (TER ≤ 10%) 99.88% 99.93% 99.89% 99.27% cdf (TER ≤ 25%) 99.98% 99.97% 99.75% 99.88% cdf (TER ≤ 50%) 99.99% 100% 100% 99.98% cdf (TER ≤ 75%) 100% 100% 100% 99.99% cdf (TER ≤ 100%) 100% 100% 100% 100%
Except in São Paulo, EMF Exposure Web estimates that at least 90% of the area has TER ≤ 5%. In all cities, more than 99.88% of the area around the reference location has TER ≤ 10%. This is an upper boundary for the real exposure value due to cellular base stations and is consistent with measure data all over the world. For example, in [21], the measured exposure ratio due to second and third generation cellular base stations was less than 1%. In [22], a similar result was found. The exposure ratio from base stations usually range from 0.002% to 2% [6].
A fine grain test can be done comparing estimates with measures in some locations. Anatel, the Brazilian telecommunications regulatory agency, has an online map with some measures [23] that can be used to test the proposed software. The available values for TER corresponds to measures from 100 kHz to 3 GHz. So, to make better comparisons, it is necessary to choose points far from broadcasting stations, because their transmitted power is higher than the one of cellular base stations. In some places, the exposure ratio due to broadcasting stations is responsible for 90% of the total exposure ratio [21].
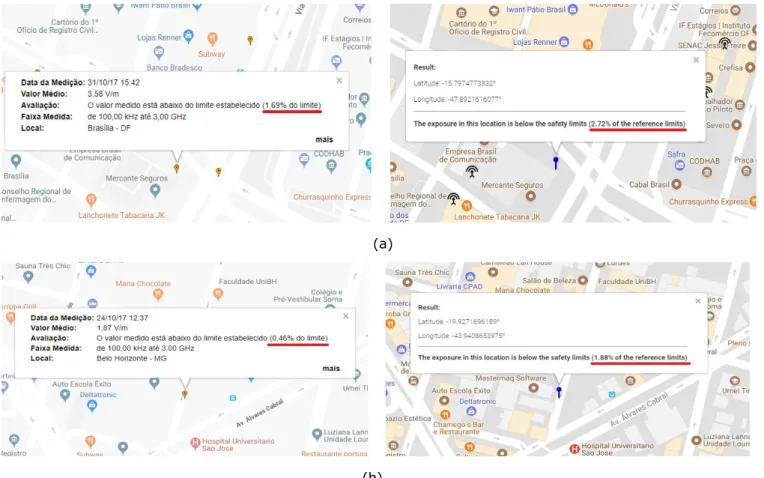
Figure 4 shows some measures (left) and estimates (right) of the TER at the same location in two different cities (Brasília and Belo Horizonte). The estimated value is higher than the measured
value, which is desired, since we are interested in an upper limit for the total exposure ratio.
(a)
(b)
Figure 4:Measured (left) and estimated (right) TER in the same location. Measured values are public available in[23]. The boxes in the left images show, respectively, the timestamp of the measured, the average of the electric field intensity, the measured TER divided by its reference limits (in percentage), the measured bandwidth, and the city. EMF Exposure Web was used to calculate the estimated values. (a) Brasília; (b) Belo Horizonte.
Source:Author (2018).
A software like EMF Exposure Web can also assist in some decisions. For example, in São Paulo, five locations have TER ≥ 50%. This is an unexpected result, because we are considering only radiation from cellular base stations. So, the public authority can analyze what occurred. In these cases, the height of the base stations near these locations is extremely low (lower than 5 m), which can be an error in Anatel’s database (they are usually deployed in top of buildings). Besides, in these five locations, the vertical beamwidth of the base stations near them has values that are not compatible with other base stations operating at the same frequency, which perhaps is also an error in the public database.
In the case of the Brazilian data used in this paper, the operators register the base station information in the regulators database[24]. Thus, the regulator can check the consistency of its database. If the information is correct, measurements can be done specifically at these locations to assess their TER value. This allows the regulator to measure the TER in places where it is more likely to have a high total exposure ratio from telecommunications base stations.
5 CONCLUSIONS
This paper reviewed how to estimate an upper limit for the total exposure ratio (TER) from telecommunications base stations. Then, it
30
proposes a software (EMF Exposure Web) that implements this procedure. The source code and a reference implementation are available in [11, 12].
To validate EMF Exposure Web, data of all cellular base stations in four crowed Brazilian regions were loaded into the software. The results were consistent with measurements in the same location, i.e., the estimated TER represents an upper limit for the measured TER.
Therefore, the proposed software can be used by the general public to check if the exposure level from base stations in any location is below the reference limits, which assists in the dissemination of information.
The software also allows more in-depth analysis. In this case, it may be useful for public authorities to find critical areas requiring on-site measurements.
REFERENCES
[1]EUROPEAN COMMISSION. Special
Eurobarometer 347 / Wave 73.3 – TNS Opinion & Social: Electromagnetic Fields.
[Online] June 2010. Available:
http://ec.europa.eu/commfrontoffice/publicop inion/archives/ebs/ebs_347_en.pdf.
[2]Ng Kwan-Hoong.Radiation, mobile phones,
base stations and your health. [Online]
2003. Available: http://www.who.int/peh-emf/publications/en/mcmcradiationmobilepho nebk.pdf.
[3]Health Science Authority. Electromagnetic
fields and public health. Health and safety guidelines #1. August, 2011.
[Online]. Available:
http://www.hsa.gov.sg/content/dam/HSA/Ne ws_and_Events/Press_Releases/2001/EMF-HealthSafetyGuidelines-final.pdf.
[4]SINGH, K. et al. Effect of electromagnetic radiations from mobile phone base stations on general health and salivary function. Journal of International Society of
Preventive & Community Dentistry, vol 6,
isseu 1, Jan./Feb. 2016. DOI 10.4103/2231-0762.175413.
[5]Report to the World Health Organization on EMF Activities and salivary function – International EMF Project. Sigapore, June
2017. [Online]. Available:
http://www.who.int/peh-emf/project/mapnatreps/singapore-2017.pdf
[6]WORLD HEALTH ORGANIZATION. Fact Sheet
nº 304: Electromagnetic fields and public health.[Online] May 2006. Available:
http://www.who.int/peh-emf/publications/facts/fs304/en/.
[7]FEDERAL COMMUNICATION COMMISSION. RF
Safety FAQ. [Online]. Available:
https://www.fcc.gov/engineering- technology/electromagnetic-compatibility-division/radio-frequency-safety/faq/rf-safety. [8]L. Bontoux and K. Bromen. Public health
and electromagnetic fields: Overview of European Commission activities. EMF
Spectrum. [Online] July, 2011. Available: http://ec.europa.eu/health/scientific_committ ees/docs/pub_emf_ec_activities2011_wik_en. pdf.
[9]BRAZIL. Federal Law 11.934. May, 2009. [Portuguese] [Online]. Available:
http://www.planalto.gov.br/ccivil_03/_ato200 7-2010/2009/lei/l11934.htm.
[10]FERNANDES, L. C. F.; LINHARES, A.; SOARES, A. J. M.Estimation of region of maximum exposure to radiofrequency electromagnetic fields.Microwave and
Optical Technology Letters, v. 57, i. 6,
March 2015. DOI: 10.1002/mop.29084. [11]FERNANDES, L. C. EMF Exposure Web –
application. [Online]. Available:
https://emf-exposure-ba279.firebaseapp.com/ter?lang=EN&advan ced.
[12]Leandro Carísio Fernandes. EMF Exposure
Web – source code. [Online] 2018.
Available: https://github.com/carisio/emf-exposure-web.
[13]INTERNATIONAL TELECOMMUNICATION UNION. Recommendation ITU-T K.100:
Measurement of radio frequency electromagnetic fields to determine compliance with human exposure limits when a base station is put into service.
Geneva, Switzerland: Tech. Rep., 2018. [14]INTERNATIONAL COMMISSION ON
NON-IONIZING RADIATION PROTECTION. ICNIRP Guidelines for limiting exposure to time-varying electric, magnetic, and
electromagnetic fields (up to 300
GHz).Health Physics, vol. 74, issue 4, p. 494–522, Apr. 1998.
[15]INTERNATIONAL COMMISSION ON NONIONIZING RADIATION PROTECTION. ICNIRP Guidelines for limiting exposure to
time varying electric and magnetic fields (1 Hz–100 kHz).Health Physics, vol. 99, issue 6, p. 818–836, Dec. 2010.
[16]FERNANDES, L. C. Design and development of an app to compute exposure to
electromagnetic fields. IEEE Antennas and
Propagation Magazine, vol. 59, issue 2,
April 2017. DOI
10.1109/MAP.2017.2655527.
[17]INTERNATIONAL TELECOMMUNICATION UNION. Recommendation ITU-T K.52:
Guidance on complying with limits for human exposure to electromagnetic fields. Geneva, Switzerland:Tech. Rep.,
2018.
[18]INTERNATIONAL TELECOMMUNICATION UNION. Recommendation ITU-T K.113:
Generation of radio-frequency
electromagnetic field level maps. ITU,
Geneva, Switzerland, Tech. Rep., Nov. 2015. [19]ANATEL (Brazil). STEL –
Telecommunications Service System.
[Portuguese]. [Online]. Available: https://sistemas.anatel.gov.br/stel/. [20]HOLMA, H.; TOSKALA, A. (ed.). LTE for
UMTS: OFDMA and SC-FDMA Based Radio Access.Hoboken, New Jersey: Wiley
Publishers, 2009.
[21]RODRIGUES, M. E. C. et al. Measurements of non-ionizing radiation on urban
environment and preliminary assessment of relative contribution among different services. In: PROC. MICROWAVE
OPTOELECTRONICS CONF., 2013, Rio de Janeiro, Brazil. Proceedgins [...] Rio de Janeiro: IEEE, 2013. p. 1–4.
[22]UGANDA COMMUNICATIONS COMMISSION.
National survey on electromagnetic fields (EMF) exposure around GSM base stations in Uganda. [Online] 2015.
Available:
http://ucc.co.ug/files/downloads/e-summary%20report%20on%20national%20 EMF%20survey%20on%20GSM%20base%2 0stations%20.pdf.
[23]ANATEL (Brazil). Map of electromagnetic
fields measurements. [Portuguese].
[Online]. Available:
http://www.anatel.gov.br/dados/medicoes-de-campo-eletromagnetico.
[24]ANATEL (Brazil). Base stations. [Portuguese]. [Online]. Available:
http://www.anatel.gov.br/setorregulado/tele fonia-movel-outorga/estacoes-radio-base.
![Table 1:Reference levels for general public exposure to time-varying electric fields [14, 15].](https://thumb-eu.123doks.com/thumbv2/123dok_br/15478188.1036906/2.918.483.834.848.979/table-reference-levels-general-public-exposure-varying-electric.webp)