Can currency risk factors explain the Carry Trade
and the Currency Momentum effect?
Pedro Venâncio
152417044
Dissertation written under the supervision of
Professor José Afonso Faias
Dissertation submitted in partial fulfilment of requirements for the
MSc in Finance, at the Universidade Católica Portuguesa.
Can currency risk factors explain the Carry Trade
and the Currency Momentum effect?
Pedro Venâncio
152417044
Abstract:
An empirical study on two of the most famous foreign exchange market investment strategies, the carry trade, and currency momentum, is provided. It was found returns of up until 11% p.a for both strategies. The dissertation discusses possible reasons for the profitability of the carry trade and currency momentum. There is empirical evidence to believe that transaction costs are a plausible explanation for the currency momentum strategy. However, they seem to not explain the carry trade strategy. Two currency risk factors were created, the DOL and VOL factor, this dissertation empirically proves that these factors are an explanation for both strategies. However, the factors cannot explain in total both the currency momentum strategy and the carry trade.
Serão os fatores de risco de moedas explicativos da
Carry Trade e do efeito de Momentum de Moedas
Pedro Venâncio
152417044
Sumário:
Um estudo empírico é feito sobre duas das mais famosas estratégias de investimento do mercado de câmbio, o carry trade e o momentum. Encontram-se retornos positivos para ambas as estratégias. Foram encontrados retornos de até 11% p.a para ambas as estratégias. São discutidas diferentes alternativas para a rentabilidade dessas estratégias. Há evidências empiricas que os custos de transação são uma possível explicação para a estratégia de momentum, no entanto, eles parecem não explicar a estratégia de carry trade. Foram criados dois fatores de risco cambial, fator DOL e fator VOL, sendo que esta dissertação comprova empiricamente que esses fatores são uma explicação para ambas as estratégias. No entanto, os fatores não podem explicar, no total, a estratégia de momentum da moeda e o carry trade. Keywords: Momentum de moeda, Carry Trade, Fatores De Risco De Moeda
Acknowledgments
First, I want to thank my supervisor, Professor José Faias for his constant help, guidance, and motivation throughout this dissertation. For his constant effort to improve the MSc in Finance, you are truly a great Professor that truly cares for his students, thank you! I also thank Fundação da Ciência e Tecnologia.
To my “Reuters Family” friends, thank you for the past two years, they would be so much boring without all of you. I will always remember you, even if by chance our paths don´t cross again, I will never forget all the moments of laughter and pure joy I had with you.
To Paulo Jorge, João Teixeira, Márcia Silva, thank you for being the best and most dysfunctional group of friends I could ask for. You have never doubted my abilities and you were always able to take my mind out of my studies.
I especially thank Hanna Nikanorova, that has embraced the adventure of living in London with me. Thank you for all the weekends that we both spent writing our dissertations, while eating Pringles and giving motivational speeches to each other, without you, it wouldn’t be possible. I would like to give a special thanks to Carolina Sá Pereira, your constant support and never-ending believe in me being able to do everything I put my mind on was essential to this dissertation. Thank you for never showing a bored face when I was rumbling about career choices, movies you don´t like or even finance related topics. I never had so much pleasure and fun running away from my responsibilities as I have with you. It is and will continue to be worth every second! Thank you for putting some color in my greyish life!
Finally, I would like to thank my parents and my brother for all the patience, everlasting sacrifices. For all the motivational talks when I felt I couldn’t do it, you always made sure I knew you believed that I could do everything, but most importantly, you always made sure that I knew there wasn’t any problem if I were to fail. Couldn’t ask for a better family, Thank You!
Table of Contents
1. Introduction ... 1
2. Literature Review ... 3
2.1 The Currency Momentum Strategy ... 4
2.1.1 Stock Market Momentum ... 4
2.1.2 Momentum on Bonds and Commodities ... 5
2.1.3 Currency Momentum ... 5
2.2 The Carry Trade ... 5
2.3 Currency Risk Factors ... 6
3. Data ... 6
Evolution of number of currencies in the Sample ... 8
4. Methodology ... 9
4.1 The Carry Trade ... 10
4.2 Momentum ... 12
4.3 The Dollar factor ... 14
4.4 The Volatility factor ... 14
5. Result ... 16
5.1 Characterizing Currency Momentum Returns ... 16
5.1.1 Transaction Costs ... 19
5.2 Characterizing Carry Trade Returns ... 21
5.3 Currency Risk Factors ... 23
6. Conclusions ... 25
List of Figures and Tables
Figure 1: Evolution of number of currencies in the Sample ... 8
Figure 1:Global Volatility Factor ... 15
Table 1 :Average Annualized Momentum returns. ... 16
Table 2: Average Annualized Momentum Sharpe Ratios. ... 17
Figure 1:Momentum Cumulative Returns. ... 18
Table 3: Average Annualized Momentum including Transaction Costs returns. ... 19
Table 4: Average Annualized Momentum including Transaction Costs Sharpe Ratios. ... 20
Table 5: Average Annualized Carry Trade Statistics ... 21
Table 6: Carry Trades Average Annualized Statistics ... 22
1
1. Introduction
This dissertation focuses itself in the foreign exchange market and in two of its most well-known investment strategies, the carry trade, and momentum. The properties of the payoffs of both strategies are not only analyzed but following existing literature, this dissertation also attempts to assess what can explain those payoffs.
The foreign exchange market is a unique market when we consider markets for equities or fixed income products, there is also a vast and almost unlimited amount of stocks or bonds that investors can choose.
However, in the foreign exchange market there is limited choice of currencies, and investors focus on a handful of currencies to invest in, currencies like the Euro or the U.S Dollar are among the most popular pairs of currencies. The popularity of the U.S Dollar is so high that according to the Bank of International Settlements, in April 2016, 88% of all trades in the foreign exchange market were done, having the U.S Dollar as one-side of the trade.
It is also a market where the assets, currencies don´t have an intrinsic value and their prices, or quotes are measured in relative terms. The value of one currency is measured against the value of another currency.
The foreign exchange market also differs from the other markets when one takes into consideration the time, contrasting to the equity market, it is possible to trade in the foreign exchange market for the entire duration of the day. While an investor can only buy a particular stock between the opening and closure of the market where the stock is listed.
The carry trade is not only one of the most popular but also one of the oldest speculation investment strategies in the foreign exchange market. It consists of lending currencies that yield high-interest rates and borrowing currencies that yield low-interest rates. This strategy has Bilson (1980) documented, it is motivated by the failure of the well-known uncovered interest parity. This strategy has been used by speculators all over the world and researchers have tried to understand the properties of this strategy and also tried to find variables that can explain it. This dissertation shows that if an investor constantly invested in the carry trade from 1976 to 2018, he would have had average annualized payoffs of 8% without considering transaction costs and of 5% if these are considered. From this, it is concluded that that for the carry trade, transaction costs are negligible, and the analysis of the strategy is done using the no-transaction costs carry trade, since transaction costs do not have explanatory power over the carry trade.
2
The momentum strategy was inspired by Jegadeesh and Titaman, (1993), the authors of this well-known paper, found an effect, momentum, that even today challenges the financial theory. This paper showed that by simply buying stocks that had high returns in recent past and selling stocks that had low returns the past, is an investment strategy that yields high returns. This effect challenges theory in the sense that for many years, professionals would keep the allocations of their portfolios intact, meaning that they, in fact, were shorting momentum, they would sell the Winners and buy the Losers.
Jegadeesh and Titaman, were the firsts to study this effect. However, questions on this factor arose, was it only an effect that only the equity market, the stock market, had? Or was it a transversal effect that can be observed in all asset classes? Researchers like Jostova, Nikola, Philipov, and Stahel (2010), Okunev and White (2003) and many others focused on this question and were able to show that this effect is observed in different asset classes.
I personally agree with Lukas Menkhoff, Lucio Sarno, Maik Schmeling and with Andreas Schrimpf, who compared the Foreign exchange market to the stock market, “Compared to stock
markets, FX markets are more liquid and feature huge transaction volumes and low transaction costs, they are populated largely by sophisticated professional investors, and there are no natural short-selling constraints that prevent the shorting of past loser assets to fully implement momentum strategies. Hence, considering FX markets raises the hurdle for generating significant excess returns from momentum strategies considerably.” (Lukas Menkhoff, Lucio
Sarno, Maik Schmeling, Andreas Schrimpf 2012). With this, there is a reason to believe that the momentum effect would be not only observed in the foreign exchange market but that it would be one of the focus of the literature.
However, the authors stumbled across the fact that this was not the case, little research was done within this market, and the authors were as Jegadeesh and Titaman (1993) pioneers on the study of the momentum effect in the foreign exchange market using cross-section data.
The profitability of the momentum strategy was studied using two variables, the holding period of the portfolios and their formation period, it is shown that when both variables increase in time, the returns of the strategy start to disappear. However, the currency momentum yields return between 3% and 11%.
This dissertation focuses on two well-known speculation investment strategies. That has a common cornerstone. There is still so little that researchers know regarding what causes them.
3
Many researchers have tried to explain the profitability of both strategies using conventional risk factors. However, no success was found with this simple approach. This made researchers such as Lustig et al. (2011) and Menkhoff et al. (2011) to think outside the box and to construct empirical risk factors based on currencies, which are called currency risk factors.
Following the existent literature, the dissertation creates two currency risk factors. The DOL factor and the VOL factor. The DOL factor is simply the average excess return of all the currencies available in the sample and the VOL factor is a proxy used to measure global volatility in the foreign exchange market, it is calculated as the volatility of the daily changes of the spot rates. It is shown that both factors have success in explaining both the carry trade and the momentum strategy, However it is also concluded that both strategies, the carry trade, and the momentum, are not fully explained by the factors, thus concluding that literature must develop new ways of trying to explain the profitability of both momentum and the carry trade. It is also considered in the dissertation the existence of peso events that use option data to rationalize the profitability of the carry trade and momentum strategy. This alternative basis itself on the existence of rare disaster, that argue that the high average returns that the carry trade has been explained by a low-probability event that does not occur in the sample that would imply extremely negative returns. If this is the case, then investors need to be compensated with high average returns when the peso-event does not occur.
The dissertation is structured as it follows. In Section 2., there is a review of existing literature for both momentum, the carry trade and the currency risk factors. Section 3. Describes in detail the data used and the sources of the data. Section 4. explains the methodology used to create the investment strategies and the risk factors. Results for the investment strategies and for models based on the currency risk facts are shown in Section 5. And in Section 6. conclusions, limitations and further possible research are discussed.
2. Literature Review
This section presents an overview of the existing literature regarding the strategies constructed and the currency risk factors created. Firstly, a review of the momentum strategy is done, followed by the carry trade, ending with the currency risk factors.
4
2.1 The Currency Momentum Strategy
Currency momentum strategies are based on a well-documented empirical effect, which is momentum strategies. However, this momentum effect is mainly studied in the stock market, although it has been detected across other asset classes (bonds, commodities and in the foreign exchange). The literature review of the momentum effect starts with the effect of remaining assets classes and then reviews the existing literature on the momentum effect in the foreign exchange market.
2.1.1 Stock Market Momentum
Regarding the momentum effect on the stock market, Jegadeesh and Titman (1993), highly influenced the literature when they showed a momentum analysis based on the U.S stock market, which generated high average annualized returns of about 12%. However, at the time, the authors could not find a valid rationale for the momentum effect apart from the high turnover of the portfolios, which meant a high level of transaction costs and behavioral biases. Also, the authors found that the momentum effect on the stock market had negative skewness which meant that investors could face high levels of negative returns. After Jegadeesh and Titman, authors like Rouwenhorst (1998), Chan, Hameed, and Tong (2000), and Chui, Titman, and Wei, (2010) expanded the literature on the momentum effect, and analyzed if the effect was present countries other than the U.S, the findings suggested that the momentum effect is a worldwide effect that is present in the stock market of different countries
Following the initial documentation of the momentum effect, some authors tried to explain the effect. Authors like Fama and French (1996) and Jegadeesh and Titman (2001), showed that covariance risk and conventional risk factors could not explain the momentum effect, and ambiguous evidence was found when macroeconomic factors were used to explain the momentum effect, Griffin and Martin (2003) and Cooper, Gutierrez, and Hameed (2004) showed the possible correlation between momentum and macroeconomic risk was invalid, while authors like Chordia and Shivakumar (2002) found evidence that supported the link. As stated above, Jagadeesh and Titman (1993), also suspected that there could exist behavioral biases, regarding the under-reaction to the news.
A final rationale behind momentum arises when transaction costs or limits to arbitrage are explored. Lesmond, Schill, and Zhou (2004) argued that transaction costs would wipe most of the returns that momentum yields.
5
2.1.2 Momentum on Bonds and Commodities
Momentum was later studied in other asset classes, regarding bonds, the momentum effect was shown by Jostova, Nikola, Philipov, and Stahel (2010) to yield positive returns in high yield bonds, non-investment grade. However, when analyzing investment grade bonds and bonds at the country level, Gebhardt, Hvidkjaer, and Swaminathan, (2005) and Asness, Moskowitz, and Pedersen, (2009), respectively shown that the momentum effect is not present.
In the commodity market, evidence suggesting momentum sources related to the underlying risk characteristics of the assets and the relation between returns and low inventory market states was shown by Gorton, Hayashi, and Rouwenhorst (2012).
2.1.3 Currency Momentum
The foreign exchange market, currencies, had the least amount of literature, the first literature on the subject focused on a time-series of a single exchange-rate instead of a cross-section of currency returns Menkhoff and Taylor (2007). Also, the only exception to this was Okunev and White (2003), however, due to data limitations, the authors are only capable of analyzing the momentum effect in eight pairs of currencies, with a time-span of only 20 years. Even though the limitations, the strategy designed by these authors was profitable and paved the way to more thorough analyzes by Burnside et al. (2011) and by Menkhoff et al. (2012), which worked as a basis for this dissertation. These authors studied the momentum effect in detail and comparing to Okunevet al. (2003), had a bigger time-span and had more pairs of currencies. The authors investigated returns in an equally weighted momentum portfolio, which is the methodology also used in this dissertation.
2.2 The Carry Trade
The carry trade is one of the most popular and one of the oldest strategies in the foreign exchange market. Bilson (1980) and later Fama (1984) showed that it is motivated by the failure in the uncovered interest parity.
Although the popularity of the carry trade, and the attempts by several authors to understand its profitability, it still is a mystery the reasons behind the profitability of the carry trade.
Authors like Lustig & Verdelhan (2007), Brunnermeier et al. (2009), Jorda` & Taylor (2009), Farhi et al. (2009), Lustig et al. (2011), Rafferty (2010), Burnside et al. (2011), and Menkhoff et al. (2011), tried to understand its profitability and the conclusion that arose from their
6
research papers was that the carry trade profitability could not be explained by common risk like the ones created by Fama and French (1993).
2.3 Currency Risk Factors
Although both strategies are well known and popular, the initial literature tried to analyze the profitability of the strategies with common risk factors, like the ones created by Fama (1984). However, these attempts were not successful and researchers like Lustig et al. (2011) and Menkhoff et al. (2011), developed new factors in order to explain the profitability of these strategies.
Menkhoff et al (2012) created a global foreign exchange volatility factor, VOL in order to investigate the relationship between VOL and the carry trade, the authors show that when there is unexpected high volatility, high interest rated currencies deliver low returns, while low-interest rate currencies work as a hedge a yield positive returns.
Lustig et al. (2011) developed what the authors called a “slope” factor, which is the average excess return in all pairs of currencies available, normalizing the size of the bet to one U.S Dollar. This factor is referred to as DOL simply because it illustrates what is the return available in U.S Dollars for a U.S investor if he were to bet one U.S Dollar on a basket of currencies.
3. Data
The data for spot and one-month forward exchange rates cover the sample period from January 1976 to December 2018 and are obtained from Barclays Bank International (BBI) and Reuters (both via Datastream). As in Lukas Menkhoff, Lucio Sarno, Maik Schmeling, Andreas Schrimpf (2012), spot and forward exchange rates retrieved are end-of-month data (last trading day of a given month), with this, rates are not averaged during a month. However, to construct the Global Volatility risk factor, daily rates were also used. Following Fama (1984) and the literature that followed, spots and forward rates are denoted as natural logs, s (spots) and f (forwards).
The total sample as in Menkhoff et al. (2012), consists of 48 countries: Australia, Austria, Belgium, Brazil, Bulgaria, Canada, Croatia, Cyprus, Czech Republic, Denmark, Egypt, Euro area, Finland, France, Germany, Greece, Hong Kong, Hungary, India, Indonesia, Ireland, Israel, Italy, Iceland, Japan, Kuwait, Malaysia, Mexico, Netherlands, New Zealand, Norway, Philippines, Poland, Portugal, Russia, Saudi Arabia, Singapore, Slovakia, Slovenia, South
7
Africa, South Korea, Spain, Sweden, Switzerland, Taiwan, Thailand, Ukraine, United Kingdom.
Relative to Lustig, Roussanov, & Verdelhan (2011) or Menkhoff, Sarno, Schmeling, & Schrimpf (2012), this dissertation employs a bigger sample, that starts in 1976. The sample from the authors of the previous papers begins in 1983 and only have seven pairs of currencies at the beginning of the sample quoted against the U.S dollar. This is made possible as the BBI data that only starts in 1983 is complemented with Reuters data, quoted against the British Pound as in Burnside, Eichenbaum, Kleshchelski, and Rebelo (2011). By doing this, a total of 16 currencies are available since 1976, which makes the data set longer than the previous pape. However, as stated above, these 16 currencies are quoted against the British Pound for this longer time span and were, therefore converted to quotations against the U.S Dollar as the rest of the sample. The 16 countries that enjoy this longer time span are Austria, Belgium, Canada, Denmark, France, Germany, Ireland, Italy, Japan, Netherlands, Norway, Portugal, Spain, Sweden, Switzerland, and the United Kingdom.
When the data set is compared to the one used in Menkhoff et al. (2012), it is also verified that the sample in this dissertation is also larger. Although the authors also had data from 1976, their data stopped in 2010 which was the data available at the time. However, due to the passage of time, the sample in this dissertation includes more 10 years of monthly data. The last datapoint is recorded in December 2018, making the final sample for this dissertation to begin in 1976 and to end in 2018.
In order to adjust to transaction costs, bid and ask quotes for both spot and forward rates were retrieved from the same sources, Barclays Bank International (BBI) and Reuters (both via Datastream).
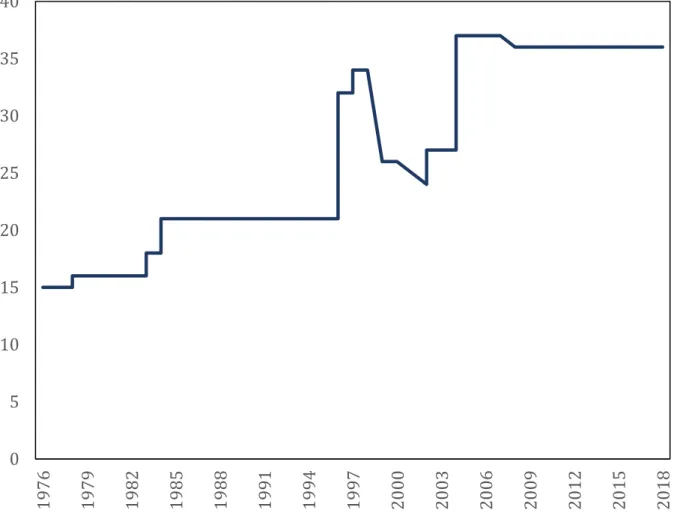
The effective sample varies over time. Although the sample includes 48 currencies, not all currencies are available from the beginning of the period, some for obvious reasons like the Euro, others due to data limitations or simply because some currencies cease to exist during our sample period, the Euro replaced currencies like the German Mark, the Italian Lira or the French Franc. Also as data for emerging countries become available, the number of data points in each point in time increased. Fig. 1 illustrates this, by plotting the number of currencies with available data for each month of the sample.
8
Figure 1.
Evolution of number of currencies in the Sample
Fig. 1. Plots the number of available currencies (i.e., currencies with available data for spot and forward exchange rate) for each month of the sample period that starts in January 1976 and ends in December 2018. As it is possible to identify, in 2001 there was a drop in the currencies available due to the inclusion of the Euro and the exclusion of all the currencies that ceased to exist.
As can be inferred, the sample does not cover the 48 currencies at the same time due to the data availability and the exclusion or inclusion of currencies in the sample. The theoretical maximum of 24,768 observations (516 months x 48 currencies) is not verified due to this, the sum of actual observations is 18,003. This implies almost a 50% increase from the sample in Menkhoff et al. (2012), which in literature also had a significative sample size increase when compared to research that came before their paper.
0 5 10 15 20 25 30 35 40 19 76 19 79 19 82 19 85 19 88 19 91 19 94 19 97 20 00 20 03 20 06 20 09 20 12 20 15 20 18
9
4. Methodology
In this section, the methodology used to implement the investment strategies and to create the currency risk factors will be discussed. The section will be divided into two parts. In the first part, it is discussed the methodology used to create two the two widely known currency-investment strategies, the carry trade, and the currency momentum. It is important to note that transaction costs were considered, thus, it is presented for both strategies, gross and net returns. Net returns were calculated considering transaction costs, which were based on the bid-ask spread.
However, Lyon, (2001) suggests that the BBI/Reuters bid-ask spread is based on indicative quotes, thus opening the possibility to an overestimation of the bid-ask spread. The actual effective spreads in the foreign exchange market can be lower. Based on this, the net results calculated considering transaction costs, using the BBI/Reuters bid-ask spread, should be interpreted as the lower bound on the profitability of the strategies presented in this dissertation, and, are shall to be understood as the true and precise returns the investment strategies would have achieved during the time span of the analysis.
On the second part of this section, the methodology used for the creation of currency-based factors will be presented. It is also important to focus that conventional risk factors are not used, since Burnside, Eichenbaum, and Rebelo (2011) “have stated that although conventional risk
factors have some explanatory power for stocks, these factors are not able to explain both the carry trade and currency momentum”. Having this in mind, the decision to not further try to
verify if conventional risk factors could explain the carry trade and the currency momentum strategies was taken. This dissertation only tries to analyze if non-conventional risk factors based on currency returns can explain both the carry trade and the currency momentum. The currency-based factors created were based on Lustig et al. (2011) and on Menkhoff et al (2012), the dollar risk factor, denoted as DOL, and the volatility risk factor, denoted by VOL, respectively.
10
4.1 The Carry Trade
This popular strategy consists of borrowing low-interest rate currencies and lending high-interest rate currencies, it is motivated by the failure of the uncovered high-interest rate parity. When transaction costs are ignored, the payoff for this strategy can be calculated as follows:
𝑦𝑡[(1 + 𝑟𝑡∗𝑆𝑡+1
𝑆𝑡 − (1 + 𝑟𝑡)]
(1) In this equation, the variable St denotes the spot exchange rate expressed as dollars per foreign
currency unit. The variables rt and rt* represent interest rates, in this case, rt denotes the domestic interest rate and rt* denotes foreign interest rate respectively. Following the approach of Burnside, Eichenbaum, Kleshchelski, and Rebelo (2011), yt denotes the size of the bet measured in U.S Dollars, which following these authors, is normalized to one U.S Dollar. The amount of dollars borrowed, yt, is, thus calculated as follows:
𝑦𝑡 = { +1, 𝑖𝑓 𝑟𝑡< 𝑟𝑡
∗,
−1, 𝑖𝑓 𝑟𝑡≥ 𝑟𝑡∗.
(2)
Although applying the carry trade using Equation (1) and Equation (2) theoretically would be a simple procedure, it is a process that becomes hard to apply due to data issues. There is no available data for all the interest rates required. However, the carry trade can also be implemented by using the concepts of forward discount and forward premium. So, in order to implement the carry trade, an investor must buy the foreign currency forward when it is at a forward discount (Ft < St) and selling the foreign currency forward when it is at a forward
premium (Ft ≥ St).
In order to use this alternative, an investor is required to decide what is the size of the bet. In this approach the number of foreign currency units sold forward, wt, is normalized to one U.S
and it is calculated as follows:
𝑤𝑡 = { +1/𝐹𝑡, 𝑖𝑓 𝐹𝑡 ≥ 𝑆𝑡, −1/𝐹𝑡, 𝑖𝑓 𝐹𝑡 < 𝑆𝑡.
11
With this, an investor decides what is the number of foreign currency unit he is required to sell forward, the payoff denominated in dollars for this investment strategy at the time, t+1 is denoted
as zt+1 and is calculated as follows:
𝑧𝑡+1= 𝑤𝑡(𝐹𝑡− 𝑆𝑡+1). (4)
In order to understand why an investor can decide not to use Equation (1) and Equation (2), it is necessary to explain the implications of the covered interest-rate parity, this parity implies that investing in the domestic currency must be equal to exchanging the domestic currency to the foreign currency, investing in the foreign market and exchanging again the currency at the end of the period with a forward agreement acquired in the initial moment. This is simply equated as follows:
(1 + 𝑟𝑡) = 𝐹𝑡
𝑆𝑡(1 + 𝑟𝑡
∗). (5)
If covered interest-rate parity (Equation (5)) holds, the immediate implication is that the payoffs to the strategies defined in Equations (2) and (3) are proportional to each other. As already explained, due to data limitations, this dissertation’s focus is on Equation (3), that does not require data on interest rates.
However, to use Equation (3), covered interest rate parity must hold, and Akram, Rime, and Sarno (2008) empirically demonstrated that the covered interest-rate parity holds even at very short horizons. Following this conclusion, Equation (3) is used throughout the dissertation and there is no verification if the covered interest-rate parity holds for the time span of the sample. The carry trade strategy just described does not take into consideration transaction costs and will be referred to from this moment on as “carry trade without transaction costs”. In the carry trade without transaction costs, it is assumed that investors can buy and sell currency without incurring in transaction costs, i.e., the strategy does not take into consideration the bid-ask spread. In this dissertation, the effect that transaction costs have in the carry trade strategy is also analyzed.
12
The ask (bid) exchange rate is the rate at which agents participating in the foreign exchange market can buy (sell) foreign currency from (to) a dealer. In the “carry trade with transaction costs”, bid-ask spreads are not only taken into consideration in the calculation of the payoffs for the carry trade but also when investors are deciding to buy or sell foreign currency forward. When the bid-ask spread is taken into consideration, investors make their decision differently. However, the number of foreign currency units sold forward, wt. continues normalized to one
U.S Dollar and is calculated as follows:
𝑤𝑡 = { +1/𝐹𝑡𝑏, 𝑖𝑓 𝐹 𝑡𝑏/𝑆𝑡𝑎 > 1, −1/𝐹𝑡𝑎, 𝑖𝑓 𝐹 𝑡𝑎/𝑆𝑡𝑏 < 1, 0 𝑜𝑡ℎ𝑒𝑟𝑤ℎ𝑖𝑠𝑒. (6)
With this, an investor decides what is the number of foreign currency unit he is required to sell forward, the payoff denominated in dollars for this investment strategy at the time, t+1 is denoted
as zt+1 and is calculated as follows:
𝑧𝑡+1= { 𝑤𝑡(𝐹𝑡𝑏− 𝑆𝑡+1𝑎 ), 𝑖𝑓 𝑤𝑡 > 0, 𝑤𝑡(𝐹𝑡𝑎− 𝑆𝑡+1𝑏 ), 𝑖𝑓 𝑤𝑡 < 0, 0 𝑜𝑡ℎ𝑒𝑟𝑤ℎ𝑖𝑠𝑒. (7) 4.2 Momentum
This strategy involves selling (buying) a foreign currency unit forward if it was profitable to sell (buy) a foreign currency unit at time t – t. The currency excess return, 𝑧𝑡+1𝑘 , to a U.S. investor
for holding a foreign currency is given by:
𝑧𝑡+1𝑘 = 𝑟𝑡∗− 𝑟𝑡− ∆𝑠𝑡𝑘 ≈ 𝑓𝑡𝑘− 𝑠𝑡+1𝑘 , (8) Transaction costs are also taken into consideration. These will only apply when studying momentum strategies, where investors form portfolios of currencies, following Menkhoff et al. (2012) approach, the net return of a currency that enters the portfolio in moment t and exits the portfolio at the end of the month is zk
t+1 = ftb – st+1a for a long position and zkt+1 =-fta + st+1b for
a short position. When a currency enters the portfolio but stays in the same portfolio at the end of the month, the net return of that currency is zk
t+1 = ftb – st+1 for a long position and zkt+1 = -fta
+ st+1 for a short position. Lastly, if a currency that was already in the portfolio in the month
before (t-1) exits in the portfolio at the end of the month, t has a net return of zk
t+1 = ftb – st+1a
for a long position and zk
t+1 = -fta + st+1b for a short position. Adjusting returns this way means
13
they do not have to trade the spot market leg of the position. This occurs since the sample is comprised of forward contracts with a maturity of one month. It is also assumed that investors need to establish a new position in every single currency in the first month of the sample (January 1976) and that all positions are sold in the last month of the sample (December 2018). This dissertation addresses two questions regarding currency momentum. The first question is how profitable momentum in the FX market really is? While the second is what are the factors that can explain currency momentum and the carry trade?
To address the profitability of the strategy following Menkhoff et al (2012) two dimensions were considered, the holding period and the formation period of portfolios.
To address the second question and following Rebelo et al (2011), Menkhoff et al (2012), and Lustig et al (2011), the bet an investor makes in each point in time was standardized to one U.S Dollar and both the formation period and the holding period are set to one month.
Portfolio formation: six portfolios were created at the end of each month based on lagged returns of the previous f = 1,3 6, 9, 12 months, from this point onwards f will denote the formation period of the portfolios and these portfolios were held by h = 1, 3, 6, 9, 12 months, from this point onwards, h will denote the holding period of the portfolios. At the end of each month, considering all the six portfolios created by each possible combination of formation and holding period, 150 unique portfolios are created.
To construct the six portfolios, all the available currencies were divided based on the lagged returns, this number of months used to calculate the lagged returns is equal to the formation period. The one-sixth of the currencies with the lowest lagged returns were assigned to Portfolio 1 (denoted as “Low”), the next sixth to Portfolio 2, and so on, and the one-sixth of currencies with the highest lagged returns are allocated to Portfolio 6 (denoted as “High”). This procedure creates a time-series of six currency portfolios’ excess returns and its process is similar to the one used by Titman et al (2001) when constructing momentum portfolios in the equity market. As in Titman’s equity momentum in most cases, the analysis is made in the high minus low portfolio, which is the portfolio that goes long in the winner currencies (Portfolio “High”) and goes short in the loser currencies (Portfolio “Low”). These portfolios are denoted by MOMf,h
where f and h are the formation and holding period, respectively, as stated above. As stated by Menkhoff et al (2002) an important feature of the MOM portfolios is that they are dollar neutral since the dollar component cancels out when taking the difference between (any) two portfolios.
14
To access the power of explaining the currency momentum, as in Rebelo et al (2001) the size of the bet in all point in time must be normalized to one U.S Dollar and both the formation and the holding period is set to one month. Thus, the portfolio MOM1,1 that has the size of the bet
normalized to one U.S Dollars is used when trying to access what factors have the ability to explain the currency momentum strategy.
4.3 The Dollar factor
Following Lustig et al (2011), the dollar factor (DOL), it is simply the average currency excess return. This factor can be understood as the average portfolio return of a U.S investor that invests in all the foreign currencies available in the foreign market, it is “essentially the currency
“market” return in dollars available to a U.S investor, which is driven by fluctuations of the U.S dollar against a broad basket of currencies” (Lustig et al 2011).
4.4 The Volatility factor
The volatility factor is based on Menkhoff et al (2012)’s approach, the factor is a proxy to measure the global volatility that the foreign exchange market depicts. Following the authors, this factor is calculated using daily exchange rates. It is the averaged of all absolute daily log return changes in monthly terms.
To calculated this factor, it is necessary to calculate the absolute daily log return as follows:
|𝑧𝑡𝑘| = |∆𝑠𝑡| (7)
This, as stated above, is calculated each day and for all the currencies available in the sample. After this, all available currencies are averaged on any given day and average daily values are transformed into monthly frequencies. Thus, global foreign exchange volatility in any given month t is given by:
𝜎𝑡𝐹𝑋 = 1 𝑇𝑡∑ [ ∑ ( |𝑧𝑡𝑘| 𝐾𝑡 ) 𝑘∈𝐾𝑡 ] . 𝑡∈𝑇𝑡 (7)
Where K, denotes the number of available currencies on any given day t and Tt denotes the total
15
Figure 2.
Global Volatility Factor
This figure shows the evolution of the volatility factor. The sample period starts in January 1976 and ends in December 2018.
As stated in Menkhoff et al (2012), this proxy for volatility has similarities to some measures of realized volatility, such as the one shown by Andersen et al (2001). This method uses absolute returns instead of squared returns to minimize the distortion that outlier returns would have in the analysis. This argument is of extreme importance for the choice of proxy since the dataset includes several emerging markets, that include several outliers that could have distorted the analysis if this method was not chosen. Figure 2. shows a time-series plot of VOL, where it is possible to see that the measure clearly captures some of the most known crises like the Dotcom bubble or the Financial Crisis of 2008. Making this proxy appear to be a good representation of the market when this one is in distress.
0 0.2 0.4 0.6 0.8 1 1.2 1.4 19 76 19 78 19 80 19 82 19 84 19 86 19 88 19 90 19 92 19 94 19 96 19 98 20 00 20 02 20 04 20 06 20 08 20 10 20 12 20 14 20 16 20 18
16
5. Result
This section will present the main empirical results regarding the profitability of both the currency momentum strategy, the carry trade, and if the currency factors can explain any of these strategies. Firstly, the momentum strategy results will be presented, followed by the results in the carry trade and lastly, the explanatory power of the currency factors.
5.1 Characterizing Currency Momentum Returns
In Table1. it is presented the average excess returns for all the high-minus-low momentum portfolios created, i.e., all the high-minus-low portfolios with holding and formation period of
h, f =1,3,6,9,12 months. In order to assess the risk of the strategy, it is presented in Table2. the
Sharpe ratios for those strategies.
Table 1
Average Annualized Momentum returns.
This table shows annualized average returns for different momentum strategies. The columns show holding periods (h) and the rows indicate the formation period (f) in months. The numbers in brackets are t-statistics. The sample period starts in January 1976 and ends in December 2018.
Excess Returns Holding period h f 1 3 6 9 12 1 10.69 9.53 8.19 7.48 5.36 [6.87] [6.43] [5.24] [5.37] [3.71] 3 10.40 7.83 7.36 5.88 3.19 [6.89] [4.98] [4.69] [4.19] [2.2] 6 11.03 8.90 6.10 7.01 3.70 [6.59] [5.23] [3.59] [4.47] [2.31] 9 9.90 9.19 8.21 6.48 4.53 [5.63] [5.4] [5] [3.91] [2.76] 12 9.36 8.32 6.06 5.20 4.37 [5.6] [5.05] [3.92] [3.4] [2.87]
17 Table 2
Average Annualized Momentum Sharpe Ratios.
This table shows Sharpe Ratios for different momentum strategies. The columns show holding periods (h) and the rows indicate the formation period (f) in months. The numbers in brackets are t-statistics. The sample period starts in January 1976 and ends in December 2018.
Excess Returns Holding period h f 1 3 6 9 12 1 1.05 0.98 0.80 0.82 0.57 [6.72] [6.31] [5.17] [5.3] [3.69] 3 1.03 0.73 0.72 0.64 0.34 [6.59] [4.69] [4.63] [4.15] [2.19] 6 1.01 0.80 0.55 0.69 0.36 [6.46] [5.16] [3.57] [4.42] [2.31] 9 0.87 0.83 0.77 0.60 0.42 [5.54] [5.32] [4.94] [3.88] [2.75] 12 0.86 0.78 0.61 0.53 0.44 [5.51] [4.99] [3.89] [3.38] [2.86]
Momentum strategies yield substantial and statistically significant average annualized excess returns of about 5-11% for holding periods of one month. The profits of these strategies begin to fade when the holding period starts to increase. When this happens, the average annualized excess returns are in the limit only about 3% (for MOM3, 12). However, there is also portfolios
with higher holding periods that yield positive and statistically significant returns, e.g in MOM6, 9, the average annualized excess return is about 7%, while the strategy MOM6, 6 yields
average annualized returns considerably lower of about 6%. The results are in line with the results presented in Menkhoff et al. (2012),
As stated, results tend to be stronger for a holding period and formation of one month, and as in Menkhoff et al. (2012), there is a focus on this strategy through the analysis. The MOM1, 1
strategy holds not only the highest excess average return of 10.69% but also the highest Sharpe ratio of 1.05.
18
Figure 3.
Momentum Cumulative Returns.
This figure shows the cumulative log excess returns for three different momentum Portfolios,
MOM1,1, MOM6,1, and MOM12,1, for the entire sample period, that starts in January 1976 and
ends in December 2018.
Figure 3. shows the cumulative excess return of the momentum strategies, it is possible to see
that an investor that would have invested in the strategy MOM1,1 IN January 1976 would have
had accumulated returns of almost 500%.
One important conclusion that it is possible to take with Figure 3., is that there is no evident correlation between the momentum portfolios and the current situation of the economy, business cycle. However, it is also possible to see that the returns for momentum strategies seemed to slow down after 2010. In fact, from 2010 to 2018, the average excess return for MOM1, 1 was -0.30%.
Since the sample in Menkhoff et al. (2012) ends in 2010, the authors didn’t come across this event and this dissertation does not try to explain why this occurs. However, although
0 1 2 3 4 5 19 76 19 79 19 82 19 85 19 89 19 92 19 95 19 98 20 02 20 05 20 08 20 11 20 15 20 18 HML (1,1) HML (6,1) HML (12,1)
19
momentum strategies seem profitable. There is evidence to believe that these, once profitable strategies, stopped being profitable after 2010.
5.1.1 Transaction Costs
This dissertation tries to understand what role transaction costs have in the currency momentum strategies. To understand if transaction costs can explain these strategies, the full quoted bid-ask spread was imposed.
Table 3.
Average Annualized Momentum including Transaction Costs returns.
This table shows annualized average returns for different momentum strategies. The columns show holding periods (h) and the rows indicate the formation period (f) in months. The numbers in brackets are t-statistics. The sample period starts in January 1976 and ends in December 2018.
Excess Returns Holding period h f 1 3 6 9 12 1 5.62 0.92 3.44 0.17 -1.74 [2.09] [0.46] [1.87] [0.08] [-0.95] 3 4.02 1.79 2.95 2.72 -6.44 [2.89] [0.93] [1.61] [1.51] [-3.64] 6 7.25 1.94 -0.65 -1.32 -1.14 [4.02] [1.01] [-0.35] [-0.74] [-0.7] 9 5.13 0.81 -0.16 -4.82 -1.86 [2.67] [0.42] [-0.09] [-2.39] [-1.13] 12 3.41 0.45 -1.77 -3.34 -1.56 [1.94] [0.25] [-1.01] [-1.79] [-1.02]
20 Table 4.
Average Annualized Momentum including Transaction Costs Sharpe Ratios.
This table shows Sharpe Ratios for different momentum strategies. The columns show holding periods (h) and the rows indicate the formation period (f) in months. The numbers in brackets are t-statistics. The sample period starts in January 1976 and ends in December 2018.Excess Returns Holding period h f 1 3 6 9 12 1 0.32 0.07 0.29 0.01 -0.15 [2.09] [0.46] [1.86] [0.08] [-0.95] 3 0.44 0.15 0.25 0.27 -0.58 [2.85] [0.98] [1.62] [1.77] [-3.77] 6 0.62 0.16 -0.05 -0.11 -0.11 [3.99] [1.01] [-0.35] [-0.74] [-0.7] 9 0.41 0.06 -0.01 -0.37 -0.17 [2.66] [0.42] [-0.09] [-2.39] [-1.13] 12 0.30 0.04 -0.16 -0.28 -0.16 [1.93] [0.25] [-1.01] [-1.79] [-1.02]
In Table 3. it is reported that the average annualized excess return for the currency momentum strategies taking into account transaction costs. As already mentioned, based on Lyon’s (2001) this spread is known for being too large relative to the effective spread. Having this conclusion in mind, one could argue that these results are likely to underestimate the real returns of currency momentum strategies; not considering transaction costs at all would clearly overestimate the results of these strategies. The result is line with Burnside, Eichenbaum, Kleshchelski, and Rebelo, 2006, and Burnside, Eichenbaum, and Rebelo, 2007, that state that transaction costs could be an important factor to understand momentum returns in the currency market.
When the full quoted spread is applied, the average excess annual returns for the strategy that yields the highest gross returns and Sharpe ratio, MOM1, 1, drop from about 11% to 6%.
Transaction costs remove most of the returns for the other momentum strategies as well, reaching an extreme case in MOM9, 9 where the average annual excess return drops from
roughly 6% without considering transaction costs, to about -5% when transaction costs are considered.
21
5.2 Characterizing Carry Trade Returns
In this section, the properties of the carry trade are examined. It is shown the mean and the variance of the payoffs for the carry trade with and without transaction costs.
The focus of the analysis is on the payoffs of an equally weighted portfolio of carry trade strategies. The equally weighted portfolio is constructed by betting 1/nt USD, where nt
represents the number of each individual currency carry trade available in the sample at time t.
Table 5.
Average Annualized Carry Trade Statistics
In this table, it is presented the average annualized mean returns, the annualized standard deviation and the annualized Sharpe ratio for the carry trade without and with transaction costs for the period of the sample, which starts in January 1976 and ends in December 2018
No Transaction Costs With Transaction Costs Mean Standard Deviation Sharpe Ratio Mean Standard Deviation Sharpe Ratio 11.25 4.68 1.54 4.02 4.42 0.90 [10.12] [9.65] [6.21] [4.19]
In the analysis, all the statistics are reported on an annual basis. Table 6. reports the mean, standard deviation and the Sharpe ratio of the monthly payoffs to the equally weighted carry trade portfolio, with and without transaction costs.
Contrary to Burnside et al (2011), this dissertation only reports statistics for one currency, the USD. Burnside et al (2011) showed statistics for two home currencies, the USD and GBP. Due to the data treatment, it is possible to only report for one home currency, for a bigger time span. The average annualized payoff from the equally weighted carry trade portfolio without transaction costs is about 11 with an annualized standard deviation of about 7%, when full quoted bid-ask spread is included, the average annualized payoff from the equally weighted carry trade portfolio drops to about 4% and the standard deviation also drops to about 4%. When transaction costs are ignored, the Sharpe ratio of the equally weighted carry trade portfolio is 1.54. When transaction costs are considered, and full quoted bid/ask spreads are
22
included the sharp ratio drops to 0.90. Again, it is necessary to remember that according to Lyon (2001), it is necessary to think of the returns of the carry trade with transaction costs as the minimum returns, since the full quoted bid-ask spread is overestimated. Even though this, both sharp ratios are statistically significant
The results are in line with Burnside et al (2011). However, the payoffs in this dissertation are slightly higher than in Burnside et al (2011), this result can come from three sources.
The first source is the data set, which in this dissertation is higher than the one used in Burnside et al (2011), the second possible source is also related to the data set, the authors in the paper, only use 20 pairs of currencies, while in this dissertation and following Menkhoff et al (2012), 48 pairs of currencies are used, in which emerging markets are included. The final source is that in Burnside et al (2001), the authors verify if the covered interest rate parity holds for every time t and for currency in the sample, and if there is the case that the covered interest rate parity is not verified, the data point was removed from the analysis, leaving the sample with a sample that had at least one currency missing. In this dissertation, Akram, Rime, and Sarno (2008) findings were used and as stated, no verification was made to see if the covered interest rate parity is verified.
Even though the payoffs are slightly higher, the conclusion that Burnside et al (2001) achieved is still valid for the analysis. Transaction costs, while quantitively important, do not explain the profitability for the carry trade. Following the approach of Burnside et al. (2001), the focus of the analysis is focused to the carry trade without transaction costs due to the lack of explanatory power that transaction costs have in explaining the carry trade.
Table 6.
Carry Trades Average Annualized Statistics
This table shows annualized mean and standard deviation for the average returns of the equally weighted carry trade and for the average of individual currencies. The sample period starts in January 1976 and ends in December 2018.
Equally Weighted Portfolio
Average of Individual Currencies Mean Standard Deviation Sharpe Ratio Mean Standard Deviation Sharpe Ratio 11.25 7.28 1.54 7.36 11.41 0.65
23
Table 6. reports annualized statistics for the payoffs to the equally weighted portfolio and summary statistics for the individual-currencies carry trades. The latter was calculated taking the average of the statistics applied to each of the 48 currencies in the sample.
From Table 6., it is possible to extract that an investor has large gains from diversification. The average Sharpe ratio across all individual carry trade strategies is 0.65 while for the equally weighted portfolio of carry trade strategies, the Sharpe ratio is 1.54. The difference in the Sharpe ratios does not come from the average payoffs. Individual carry trade strategies have an average annualized profit of about 7% while the equally weighted portfolio has an average annualized payoff of about 11%.
The difference in the Sharpe ratios arises from the much lower volatility of the equally weighted portfolio that has an annualized volatility of about 5%, contrasting to the much higher volatility of the average of the individual currencies of about 11%.
5.3 Currency Risk Factors
In this section, it is shown the answer to the second question of this dissertation, it was already shown that both strategies are profitable. However, it is also necessary to address what can explain the profitability of these strategies. To answer this question, two factors were created. The first was the dollar factor (DOL) Lustig et al. (2011), which is the average excess return of all the currencies in the sample, and it can also be calculated by averaging the returns of the six momentum portfolios created. The second factor created was the FX volatility factor (VOL) Menkhoff et al (2011), which is a proxy for global volatility, it is the average standard deviation of the daily log changes in the spot rates for all the currencies in the out sample against the U.S Dollar.
It is important to note that to do a regression analysis on the momentum strategy, following Burnside et al. (2011), the size of the bet in each portfolio was normalized to one U.S Dollar.
24
Table 7.
Regression Analysis
This table shows coefficient estimates for the regressions made with the VOL and DOL currency factors on both carry trade and the momentum investment strategies. The numbers in brackets are t-statistics. The sample period starts in January 1976 and ends in December 2018.
Carry Trade Momentum
18.95 9.92 [5.75] [5.45] VOL -0.02 -0.01 [-2.59] [-3.65] DOL 0.28 0.27 [7.03] [12.4] R2 2.81 2.43
In Table 7. it is shown the regression analysis of the normalized momentum portfolio and the carry trade without transaction costs on the two pairs of currency risk factors: DOL and VOL. When analyzing the regression on the carry trade, we can see that both factors are statistically significant at the 1% level. The VOL factor has a beta of -0.02, which means that for every unit of volatility, the carry trade is negatively impacted, this is consistent with the results found by Burnisde et al. (2011). The DOL factor has a positive beta and positively impacts the results of the carry trade by 0.28, being the carry trade positively impacted by the DOL factor.
In the carry trade investors borrows low-interest rate currencies and lends high-interest rate currencies, this result indicates that when global volatility in the foreign exchange market increases, an investor gets less return by holding high-interest rate currencies and that it gets more returns to hold low-interest rate currencies. this means that low-interest rate currencies provide a hedge to increases in global volatility in the foreign exchange market.
The intuition behind the DOL factor beta is explained in Burnside et al. (2011). The author explains in detail the reason for the beta finding in the DOL factor, by the construction of the factor, this finding is expected. The DOL factor is, as stated above, simply the average of excess returns for all currencies in the sample, making this validity check on the results presented throughout the dissertation.
The regression on the momentum strategy yields the same result for the DOL factor and for the VOL factor. The DOL factor has a beta of 0.02, positively affecting the momentum strategy, this also can be interpreted by the skewness of the distribution. When the average of the excess
25
returns in all currencies in the sample increase, this happens by a steeper increase in the currencies on Portfolio 6 (Winners) than by an increase in Portfolio 1 (Losers), since the momentum goes long on Portfolio 6 and short on Portfolio 1.
The VOL factor beta in the momentum portfolio negatively impacts the return of the strategy and has a value of -0.01.
Overall, the results are in accordance with the existing literature. However, both regressions have low R2, meaning that there are more factors that can explain these two strategies.
6. Conclusions
This dissertation empirically studied both momentum in the foreign exchange market and the carry trade strategy. It also the explanatory power of currency risk factors, following recent literature, normal risk factors was disregarded since they have no explanatory power for both these strategies, this result was documented by several authors, Burnside et al. (2011) was one of them.
Regarding the momentum strategy, we conclude that this strategy yields high returns of up to 11% per year. However, this strategy is highly impacted by transaction costs, which take up to 50% of the momentum returns. Furthermore, it is also found that models built from DOL and VOL factors, currency factors, have some success explaining the momentum strategy. However, the models cannot explain the entire strategy which is seen by the low R2. Leading
to believe that there are more factors that can have success when explaining this strategy. The dissertation also found that momentum strategies start to lose profitability after the financial crisis. And a finding that Menkhoff et al. (2012) also found that currency momentum is time-varying, which can be a problem for investors with a short-term horizon.
There is also evidence that momentum is present not only in the equity market (Titman et al (1993)) but also a factor that is present through all asset classes as Asness et al. (2013) tried to show.
When analyzing individual currencies momentum, this dissertation also reached a conclusion reached by Menkhoff et al. (2012). The author states that, “Momentum returns stem primarily
from currencies that are hard to hedge and have high country risk”, this goes in line with recent
literature stating that in the equity momentum, returns are concentrated in high credit risk stocks, Avramov et al. (2007), and that momentum’s return in corporate bonds mainly comes
26
from high yield bonds, Jostova et al. (2010). To summarize, these findings leave to believe that there is a common source of return across the different asset classes.
When discussing our findings regarding the carry trade, they are once again in line with existing literature. The carry trade yields return of about 8% and contrasting to the momentum strategy is not explained by transaction costs and when models are built from the currency factors, DOL and VOL, have some success in explaining the carry trade. However, as in the momentum strategy, there is a reason to believe that there are more factors that may have succeeded in explaining the carry trade.
When referencing the carry trade, it is important to reference the rare disasters and peso problems hypothesis. Authors like Farhi & Gabaix (2008), Jurek (2009), Farhi et al. (2009), and Burnside et al. (2011) argue that the high average returns that the carry trade has been explained by a low-probability event that does not occur in the sample that would imply extremely negative returns. If this is the case, then investors need to be compensated with high average returns when the peso-event does not occur.
Burnside et al. (2011) developed and implemented a strategy to characterize the peso event. The authors used currency options to create a hedged carry trade that would eliminate the large negative payoff, thus arguing that the carry trade is explained by the peso event.
27
7. References
Akram, Q. Farooq, Dagfinn Rime, and Lucio Sarno. "Arbitrage in the foreign exchange market: Turning on the microscope." Journal of International Economics 76.2 (2008): 237-253.
Akram, Q. Farooq, Dagfinn Rime, and Lucio Sarno. "Does the law of one price hold in international financial markets? Evidence from tick data." Journal of Banking & Finance 33.10 (2009): 1741-1754.
Asness, Clifford S., Tobias J. Moskowitz, and Lasse Heje Pedersen. "Value and momentum everywhere." The Journal of Finance 68.3 (2013): 929-985.
Bilson, John FO. "The" speculative efficiency" hypothesis." (1980).
Brunnermeier, Markus K., Stefan Nagel, and Lasse H. Pedersen. "Carry trades and currency crashes." NBER macroeconomics annual 23.1 (2008): 313-348.
Burnside, Craig, et al. "Do peso problems explain the returns to the carry trade?." The Review of Financial Studies 24.3 (2010): 853-891.
Burnside, Craig, et al. "Investor overconfidence and the forward premium puzzle." The Review of Economic Studies78.2 (2011): 523-558.
Burnside, Craig, et al. The returns to currency speculation. No. w12489. National Bureau of Economic Research, 2006.
Burnside, Craig, Martin Eichenbaum, and Sergio Rebelo. "Carry trade and momentum in currency markets." Annu. Rev. Financ. Econ. 3.1 (2011): 511-535.
Burnside, Craig. "The cross section of foreign currency risk premia and consumption growth risk: Comment." American Economic Review 101.7 (2011): 3456-76.
Burnside, Craig. Carry trades and risk. No. w17278. National Bureau of Economic Research, 2011.
Chan, Kalok, Allaudeen Hameed, and Wilson Tong. "Profitability of momentum stragegies in the international equity markets." Journal of financial and quantitative analysis35.2 (2000): 153-172.
Chordia, Tarun, and Lakshmanan Shivakumar. "Momentum, business cycle, and time‐varying expected returns." The Journal of Finance 57.2 (2002): 985-1019.
28
Chui, Andy CW, Sheridan Titman, and KC John Wei. "Individualism and momentum around the world." The Journal of Finance 65.1 (2010): 361-392.
Cooper, Michael J., Roberto C. Gutierrez Jr, and Allaudeen Hameed. "Market states and momentum." The Journal of Finance 59.3 (2004): 1345-1365.
Fama, Eugene F. "Forward and spot exchange rates." Journal of monetary economics 14.3 (1984): 319-338.
Fama, Eugene F., and Kenneth R. French. "Multifactor explanations of asset pricing anomalies." The journal of finance 51.1 (1996): 55-84.
Farhi, Emmanuel, et al. Crash risk in currency markets. No. w15062. National Bureau of Economic Research, 2009.
Gebhardt, William R., Soeren Hvidkjaer, and Bhaskaran Swaminathan. "The cross-section of expected corporate bond returns: Betas or characteristics?." Journal of Financial Economics 75.1 (2005): 85-114.
Gorton, Gary B., Fumio Hayashi, and K. Geert Rouwenhorst. "The fundamentals of commodity futures returns." Review of Finance 17.1 (2012): 35-105.
Griffin, John M., Xiuqing Ji, and J. Spencer Martin. "Momentum investing and business cycle risk: Evidence from pole to pole." The Journal of Finance 58.6 (2003): 2515-2547.
Jegadeesh, Narasimhan, and Sheridan Titman. "Profitability of momentum strategies: An evaluation of alternative explanations." The Journal of finance 56.2 (2001): 699-720.
Jegadeesh, Narasimhan, and Sheridan Titman. "Returns to buying winners and selling losers: Implications for stock market efficiency." The Journal of finance 48.1 (1993): 65-91.
Jordà, Òscar, and Alan M. Taylor. "The carry trade and fundamentals: Nothing to fear but FEER itself." Journal of International Economics 88.1 (2012): 74-90.
Jostova, Gergana, et al. "Momentum in corporate bond returns." The Review of Financial Studies 26.7 (2013): 1649-1693.
Lesmond, David A., Michael J. Schill, and Chunsheng Zhou. "The illusory nature of momentum profits." Journal of financial economics 71.2 (2004): 349-380.
29
Lustig, Hanno, and Adrien Verdelhan. "Comment on" Carry Trades and Currency Crashes"." NBER Macroeconomics Annual 2008, Volume 23. University of Chicago Press, 2009. 361-384.
Lustig, Hanno, and Adrien Verdelhan. "The cross section of foreign currency risk premia and consumption growth risk." American Economic Review 97.1 (2007): 89-117.
Lustig, Hanno, Nikolai Roussanov, and Adrien Verdelhan. "Common risk factors in currency markets." The Review of Financial Studies 24.11 (2011): 3731-3777.
Lyons, Richard K. The microstructure approach to exchange rates. Vol. 333. Cambridge, MA: MIT press, 2001.
Menkhoff, Lukas, and Mark P. Taylor. "The obstinate passion of foreign exchange professionals: technical analysis." Journal of Economic Literature 45.4 (2007): 936-972. Menkhoff, Lukas, et al. "Carry trades and global foreign exchange volatility." The Journal of Finance 67.2 (2012): 681-718.
Menkhoff, Lukas, et al. "Currency momentum strategies." Journal of Financial Economics 106.3 (2012): 660-684.
Menkhoff, Lukas, et al. "Currency value." The Review of Financial Studies 30.2 (2016): 416-441.
Okunev, John, and Derek White. "Do momentum-based strategies still work in foreign currency markets?." Journal of Financial and Quantitative Analysis 38.2 (2003): 425-447.
Okunev, John, and Derek White. "Do momentum-based strategies still work in foreign currency markets?." Journal of Financial and Quantitative Analysis 38.2 (2003): 425-447.
Osler, Carol L., Alexander Mende, and Lukas Menkhoff. "Price discovery in currency markets." Journal of International Money and Finance 30.8 (2011): 1696-1718.
Rafferty, Barry. "The returns to currency speculation and global currency realignment risk." Work. Pap., Duke Univ (2010).
Rouwenhorst, K. Geert. "International momentum strategies." The journal of finance 53.1 (1998): 267-284.