ACPD
14, 24753–24810, 2014 Molecular characterization of free tropospheric aerosol collected at the PMO K. Dzepina et al. Title Page Abstract Introduction Conclusions References Tables Figures J I J I Back CloseFull Screen / Esc
Printer-friendly Version Interactive Discussion Discussion P a per | Discus sion P a per | Discussion P a per | Discussion P a per |
Atmos. Chem. Phys. Discuss., 14, 24753–24810, 2014 www.atmos-chem-phys-discuss.net/14/24753/2014/ doi:10.5194/acpd-14-24753-2014
© Author(s) 2014. CC Attribution 3.0 License.
This discussion paper is/has been under review for the journal Atmospheric Chemistry and Physics (ACP). Please refer to the corresponding final paper in ACP if available.
Molecular characterization of free
tropospheric aerosol collected at the Pico
Mountain Observatory: a case study with
long range transported biomass burning
plumes
K. Dzepina1,2, C. Mazzoleni2,3, P. Fialho4, S. China2,3, B. Zhang2,5, R. C. Owen2,*, D. Helmig6, J. Hueber6, S. Kumar2,3,**, J. A. Perlinger5, L. Kramer2,7,
M. P. Dziobak7, M. T. Ampadu1, S. Olsen8,***, D. J. Wuebbles8, and L. R. Mazzoleni1,2,7
1
Department of Chemistry, Michigan Technological University, Houghton, MI, USA
2
Atmospheric Science Program, Michigan Technological University, Houghton, MI, USA
3
Department of Physics, Michigan Technological University, Houghton, MI, USA
4
Department of Agricultural Sciences, University of the Azores, Angra do Heroísmo, Portugal
5
Department of Civil and Environmental Engineering, Michigan Technological University, Houghton, MI, USA
6
ACPD
14, 24753–24810, 2014 Molecular characterization of free tropospheric aerosol collected at the PMO K. Dzepina et al. Title Page Abstract Introduction Conclusions References Tables Figures J I J I Back CloseFull Screen / Esc
Printer-friendly Version Interactive Discussion Discussion P a per | Discus sion P a per | Discussion P a per | Discussion P a per | 7
Department of Geological and Mining Engineering and Sciences, Michigan Technological University, Houghton, MI, USA
8
Department of Atmospheric Science, University of Illinois, Urbana Champaign, IL, USA
*
now at: US EPA, Research Triangle Park, North Carolina, USA
**
now at: National Center for Medium Range Weather Forecasting, Noida, India
***
now at: Xyratex International Ltd, Sacramento, CA, USA
Received: 15 August 2014 – Accepted: 23 August 2014 – Published: 25 September 2014 Correspondence to: K. Dzepina ([email protected])
and L. R. Mazzoleni ([email protected])
ACPD
14, 24753–24810, 2014 Molecular characterization of free tropospheric aerosol collected at the PMO K. Dzepina et al. Title Page Abstract Introduction Conclusions References Tables Figures J I J I Back CloseFull Screen / Esc
Printer-friendly Version Interactive Discussion Discussion P a per | Discus sion P a per | Discussion P a per | Discussion P a per | Abstract
Free tropospheric aerosol was sampled at the Pico Mountain Observatory located at 2225 m a.m.s.l. on Pico Island of the Azores archipelago in the North Atlantic. The observatory (38◦2801500N; 28◦2401400W) is located ∼ 3900 km east and downwind of North America, which enables studies of free tropospheric air transported over long
5
distances, mainly from North America. Aerosol samples collected on filters from June to October 2012 were analyzed to characterize organic carbon, elemental carbon and
inorganic ion species. The average ambient concentration of aerosol was 0.9 µg m−3;
on average organic aerosol contributes the majority of mass (57 %), followed by sul-fate (21 %) and nitrate (17 %). Filter-collected aerosol measurements were positively
10
correlated (with an r2≥ 0.80) with continuous aerosol measurements of black
car-bon, aerosol light scattering and number concentration. Water-soluble organic carbon (WSOC) species extracted from two aerosol samples (9/24 and 9/25) collected con-secutively during a pollution event were analyzed using ultrahigh-resolution Fourier transform ion cyclotron resonance mass spectrometry. FLEXPART retroplume
analy-15
sis shows the sampled air masses were very aged (average plume age > 12 days). Approximately 4000 molecular formulas were assigned to each of the mass spectra in the range of m/z 100–1000. The majority of the assigned molecular formulas have un-saturated structures with CHO and CHNO elemental compositions. These aged WSOC compounds have an average O/C ratio of ∼ 0.45, which is relatively low compared to
20
O/C ratios of other aged aerosol and might be the result of evaporation and increased fragmentation during long-range transport. The increase in aerosol loading during the measurement period of 9/24 was linked to biomass burning emissions from North America by FLEXPART retroplume analysis and Moderate Resolution Imaging Spec-troradiometer (MODIS) fire counts. This was confirmed with biomass burning markers
25
detected in WSOC species and with the morphology and mixing state of particles as determined by scanning electron microscopy. The presence of markers characteristic of aqueous-phase reactions of biomass burning phenolic species suggests that the
ACPD
14, 24753–24810, 2014 Molecular characterization of free tropospheric aerosol collected at the PMO K. Dzepina et al. Title Page Abstract Introduction Conclusions References Tables Figures J I J I Back CloseFull Screen / Esc
Printer-friendly Version Interactive Discussion Discussion P a per | Discus sion P a per | Discussion P a per | Discussion P a per |
aerosol collected at the Pico Mountain Observatory had undergone cloud processing before reaching the site. Finally, the air masses on 9/25 were more aged (∼ 15 days) and influenced by marine emissions, as indicated by organosulfates and other species characteristic for marine aerosol such as fatty acids. The change in air masses for the two samples was corroborated by the changes in ozone and the non-methane
hydro-5
carbons ethane and propane, morphology of particles, as well as by the FLEXPART retroplume simulations. This manuscript presents the first detailed molecular charac-terization of free tropospheric aged aerosol intercepted at a lower free troposphere remote location in the North Atlantic.
1 Introduction
10
The low scientific understanding in the properties and transformations of atmospheric aerosol is the key uncertainty in determining the anthropogenic climate forcing through its direct, semi-direct and indirect radiative effects (IPCC, 2013). Organic aerosol (OA) can comprise 20–90 % of atmospheric aerosol mass (Kanakidou et al., 2005; Zhang et al., 2007), and are the least understood component of aerosol. Atmospheric OA
in-15
clude both primary and secondary OA (POA and SOA, respectively). POA are emitted directly into the atmosphere, while SOA are produced by homogeneous nucleation, oxidative reactions of gaseous organic precursors and condensation of their products onto pre-existing particles, and aqueous phase reactions in cloud, fog and particulate water (Hallquist et al., 2009). The properties of aerosol in regions downwind of emission
20
sources are impacted by the outflow of pollutants, their chemical transformation, and sinks. In particular, remote locations can be dominated by SOA (Zhang et al., 2007). Ambient water-soluble organic carbon (WSOC) compounds are estimated to account for up to 80 % of OA mass (Saxena, 1996; Sun et al., 2011), but these species are still not well characterized on a molecular level (Reemtsma, 2009). A significant fraction
25
of the WSOC is comprised of higher molecular weight humic-like substances (HULIS) (Graber and Rudich, 2006) and biogenic SOA (Schmitt-Kopplin et al., 2010; Mazzoleni
ACPD
14, 24753–24810, 2014 Molecular characterization of free tropospheric aerosol collected at the PMO K. Dzepina et al. Title Page Abstract Introduction Conclusions References Tables Figures J I J I Back CloseFull Screen / Esc
Printer-friendly Version Interactive Discussion Discussion P a per | Discus sion P a per | Discussion P a per | Discussion P a per |
et al., 2012). The identification of WSOC composition is challenging. There are thou-sands of species present as WSOC that have a wide range of elemental compositions and molecular weights, with multiple functional groups such as carboxyl, hydroxyl, car-bonyl, nitro, nitrate, and sulfate. Molecular characterization of WSOC is important for understanding its roles in fundamental processes such as impacts on optical
proper-5
ties such as light absorption and scattering (Dinar et al., 2006; Shapiro et al., 2009; Nguyen et al., 2013), chemical reduction/oxidation mediation (Kundu et al., 2012), and aerosol water uptake and reactivity (Ervens and Volkamer, 2010; Ervens et al., 2011). Aqueous SOA formation in clouds might explain the current model under-predictions of OA concentrations, especially at high altitudes (Carlton et al., 2008). Determination
10
of the OA molecular composition is a challenging task. Theoretical calculations indi-cate the possibility of millions of OA chemical species (Goldstein and Galbally, 2007; Aumont et al., 2005), although recent research reports a more uniform composition of OA, which suggests a far smaller number of compounds (Jimenez et al., 2009; Kroll et al., 2011; Laskin et al., 2012; Mazzoleni et al., 2012). Analytical methods capable of
15
characterizing OA at the molecular level are necessary to tackle this problem.
In the last few decades, instruments based on mass spectrometry have become the gold standard for OA measurements (Canagaratna et al., 2007; Pratt and Prather, 2012a, b; Laskin et al., 2012). The most important characteristics of a mass spec-trometer for the analysis of complex mixtures such as ambient OA are its mass
res-20
olution and accuracy (Lobodin et al., 2012). The mass spectrometer with the highest mass resolution and accuracy is the Fourier Transform Ion Cyclotron Resonance Mass Spectrometer (FT-ICR MS; He et al., 2001). In the FT-ICR MS instrument, excited ions induce an ion current proportional to their exact mass that is detected as a frequency vs. time spectrum, and with the use of FT this spectrum is converted to intensity vs.
25
m/z. Typically FT-ICR MS mass resolving power and accuracy used for analysis of
am-bient aerosol are 200 000–400 000 and < 2 ppm, respectively (Mazzoleni et al., 2010). When combined with an appropriate ionization technique, FT-ICR MS is capable of
ACPD
14, 24753–24810, 2014 Molecular characterization of free tropospheric aerosol collected at the PMO K. Dzepina et al. Title Page Abstract Introduction Conclusions References Tables Figures J I J I Back CloseFull Screen / Esc
Printer-friendly Version Interactive Discussion Discussion P a per | Discus sion P a per | Discussion P a per | Discussion P a per |
ideally suited for the analysis of complex mixtures of ambient OA. Electrospray ion-ization (ESI) is a soft ionion-ization technique that leaves the sample molecules intact and minimizes their fragmentation, and thus is ideal for coupling with FT-ICR MS for detailed molecular level characterization of OA (Nizkorodov et al., 2011). ESI ionizes polar molecules and when operated in the “negative mode”, ions are formed in solution
5
by deprotonation and thus are negatively charged. Negative ESI is especially useful for the ionization of multifunctional oxidized compounds such as carboxylic and dicar-boxylic acids. FT-ICR MS was successfully used for the analysis of ambient OA (Woz-niak et al., 2008; Schmitt-Kopplin et al., 2010; Mazzoleni et al., 2012) and dissolved organic matter (OM) in rain (Altieri et al., 2009a, 2009b, 2012; Mead et al., 2013; Zhao
10
et al., 2013), fog water (Mazzoleni et al., 2010), and sea spray aerosol (Schmitt-Kopplin et al., 2012).
The long-range transport of aerosol from Asia to North America has received consid-erable attention (Ramanathan et al., 2007; Dunlea et al., 2009), but less attention has been placed on aerosol transported from North America to Europe. The Pico
Moun-15
tain Observatory (PMO) is an ideal site for observations of free tropospheric air masses and pollutants from North America after trans-Atlantic transport (Val Martin et al., 2006, 2008a). The observatory is located at 2225 m a.m.s.l. in the summit caldera of a dor-mant volcano on Pico Island in the Azores archipelago in the North Atlantic (Supple-ment Fig. S1). The observatory is typically above the marine boundary layer height of
20
850–1100 m a.m.s.l. during summer (Kleissl et al., 2007), and is rarely affected by local emissions. Deeper marine boundary conditions with heights up to 1700 m a.m.s.l. have been reported for colder months (Kleissl et al., 2007) and of about 1500 m a.m.s.l. for the other islands of the Azores archipelago (Remillar et al., 2012), although it al-ways remains lower than the altitude of PMO. The measurements at the PMO
be-25
gan in July 2001 with a focus on gaseous species, black carbon and meteorological parameters. Previous measurements at PMO and dispersion model simulations indi-cated that outflow of North American tropospheric ozone and its precursors are fre-quently encountered at PMO. These results were crucial in explaining the evolution of
ACPD
14, 24753–24810, 2014 Molecular characterization of free tropospheric aerosol collected at the PMO K. Dzepina et al. Title Page Abstract Introduction Conclusions References Tables Figures J I J I Back CloseFull Screen / Esc
Printer-friendly Version Interactive Discussion Discussion P a per | Discus sion P a per | Discussion P a per | Discussion P a per |
North American gaseous pollution and identified the significant impact of CO, O3, NOx
and NOy from boreal biomass burning pollution on background air composition over
the North Atlantic (Honrath et al., 2004; Lapina et al., 2006; Val Martin et al., 2006; Owen et al., 2006; Pfister et al., 2006), and enhanced understanding of the oxidation of non-methane hydrocarbons (NMHC) (Helmig et al., 2008; Honrath et al., 2008).
Fi-5
alho et al. (2005, 2006) developed a method to determine the contribution of black carbon (BC) and dust from the aethelometer measurements. Although typically aver-age free tropospheric aerosol concentrations are relatively low, long-range transport events bring in BC and dust mass concentrations at elevated levels. A recent analysis of peroxycarboxylic nitric anhydrides (PANs) measured at the PMO showed that they
10
are transported to the observatory during colder, spring months, but not in warmer summer months due to their thermal instability (K. Dzepina, J. Roberts and the Pico Mountain Observatory team, personal communication, 2014), consistent with previous estimates (Val Martin et al., 2008b).
This paper reports the first detailed chemical characterization of tropospheric aged
15
aerosol sampled at the PMO during the summer of 2012. Detailed analysis of WSOC molecular composition results from ultrahigh resolution FT-ICR MS measurements was performed for two aerosol samples collected during 24–26 September when a pollution event with the highest loading of fine particles was observed. Molecular composition of WSOC, on-line measurements, and laboratory analysis of aerosol are used together
20
with the simulations of particle dispersion model and satellite data to deduce the emis-sion sources and transformational processes of the fine particles sampled at the PMO.
2 Measurements and methods
2.1 Aerosol measurements at the Pico Mountain Observatory
New aerosol instrumentation was installed at PMO in 2012, including a 2-channel
op-25
ACPD
14, 24753–24810, 2014 Molecular characterization of free tropospheric aerosol collected at the PMO K. Dzepina et al. Title Page Abstract Introduction Conclusions References Tables Figures J I J I Back CloseFull Screen / Esc
Printer-friendly Version Interactive Discussion Discussion P a per | Discus sion P a per | Discussion P a per | Discussion P a per |
aerosol number concentration for channel 1 with particle size range of 0.3–5 µm), a nephelometer (EcoTech Aurora 3000, Warren, RI, USA) to measure aerosol light scattering and backscattering fraction at three wavelengths (450, 525 and 635 nm), an aerosol sample collector (custom-made at Michigan Tech) for scanning and trans-mission electron microscopy analysis, and four high-volume air samplers (Hi-Vols;
5
EcoTech HiVol 3000, Warren, RI, USA). The four Hi-Vols were installed in close prox-imity (∼ 50 m) to the PMO, and they were used to collect samples from June through
October 2012. They were operated at an average volumetric flow rate of 84 m3h−1
for 24 h collection of PM2.5(particulate matter with aerodynamic diameters ≤ 2.5 µm).
High-volume cascade impactors (Tisch Environmental, TE-231 single stage High
Vol-10
ume Cascade Impactor, Cleves, OH, USA) were used for size selection. PM2.5 was
collected on quartz filters (Whatman, 20.3 cm × 25.4 cm Quartz Microfibre Filters, CAT
No. 1851–865, Cleves, OH, USA), and particles > PM2.5 were captured on a
sepa-rate filter (Tisch Environmental, 14.3 cm × 13.7 cm Quartz Filters, Part No. TE-230 QZ,
Cleves, OH, USA); the results reported here refer only to the PM2.5 samples. Quartz
15
filters were wrapped in aluminum foil, baked for 12 h at 550◦C, then inserted into anti-static bags (Uline 22.9 cm ×30.5 cm Reclosable Static Shielding Bags Pleasant Prairie, WI, USA) and stored at room temperature until use. Typically, filters were inserted in all four Hi-Vols during one visit to the site, and the Hi-Vols were programmed to sample consecutively for 24 h each. We should note that the site is reachable via a strenuous
20
hike on rugged terrain (Honrath et al., 2004). Sampled filters were refrigerated locally until cold transport to the US where they were kept in a freezer until further analysis. A total of 36 filters were collected in 2012, but only 18 were selected for further labora-tory analysis (Table 1) since the remaining 18 filter samples were wet from cloud and precipitation events. Due to the wet periods, we were unable to collect suitable field
25
blanks during the 2012 campaign. Thus, a laboratory blank was used to evaluate arti-facts associated with quartz filters. All measurement times reported in this manuscript are given in local time which is the same as UTC.
ACPD
14, 24753–24810, 2014 Molecular characterization of free tropospheric aerosol collected at the PMO K. Dzepina et al. Title Page Abstract Introduction Conclusions References Tables Figures J I J I Back CloseFull Screen / Esc
Printer-friendly Version Interactive Discussion Discussion P a per | Discus sion P a per | Discussion P a per | Discussion P a per |
A seven wavelength aethalometer (Magee Scientific, model AE31, λ= 370, 470, 520,
590, 660, 880 and 950 nm) equipped with a “high sensitivity” circular spot size chamber
was used to measure the aerosol attenuation coefficient. Ambient air was sampled at
a flow rate of 7.7 dm3min−1 through a whole air inlet without size cut-off. Particulate matter accumulated on a quartz fibre filter tape (Q250F from Pallflex©). The instrument
5
was setup to automatically advance the tape every 24 h with a measurement interval of 5 min.
Quartz filter samples from 9/24 and 9/25 were further investigated for morphologi-cal analysis using electron microscopy. Four small portions (5 mm × 5 mm) were used
from different areas of each filter to obtain a representative sample. The samples were
10
mounted on aluminum stubs and coated with a 1.8 nm thick platinum layer using a Sput-ter coaSput-ter (Hummer 6.2). The coated filSput-ters were imaged using a Hitachi S-4700 field emission scanning electron microscope (FE-SEM). Elemental compositions of individ-ual particles were investigated using Energy Dispersive X-Ray spectroscopy (EDS).
2.2 Measurement of OC, EC and inorganic ions
15
Aerosol samples were analyzed for organic and elemental carbon (OC and EC, re-spectively) and the reported results are an average of at least three measurements. OC and EC content was determined with an OC : EC analyzer (Sunset Laboratory Inc., Model 4, Tigard, OR, USA), which uses the thermo-optical transmittance method (Birch and Cary, 1996). OC and EC measurements were also performed for the blanks and
20
the corresponding result was subtracted from the aerosol sample result. The blank OC
values were 13 % (SD= 8 %) of average measured ambient OC mass. The blank EC
values were below the detection limit and thus no EC blank subtraction was done. Samples were also analyzed for inorganic (NO−3, SO2−4 , Cl−, NO−2, Br−, F−, and
PO3−4 ) and organic anions (acetate, propionate, oxalate and formate) with ion
chro-25
matography (ICS-2000 ion chromatograph with an IonPac AS11 separator column, Dionex Corporation, Bannockburn, IL, USA). Samples were prepared for anion analysis
ACPD
14, 24753–24810, 2014 Molecular characterization of free tropospheric aerosol collected at the PMO K. Dzepina et al. Title Page Abstract Introduction Conclusions References Tables Figures J I J I Back CloseFull Screen / Esc
Printer-friendly Version Interactive Discussion Discussion P a per | Discus sion P a per | Discussion P a per | Discussion P a per |
by placing seven punches of 1.7 cm diameter into 12 mL of nanopure water and soni-cating them twice for 30 min (total of 60 min) at room temperature. Reported results are
an average of two measurements. NO−3, SO2−4 and Cl− only were present at
concen-trations above the detection limit. Results reported here have been laboratory blank subtracted for Cl− only; Cl− in the laboratory filter blank was 48 % (SD= 21 %) of Cl−
5
found in aerosol samples. Blank measurements for NO−3 and SO2−4 were below the
detection limit.
2.3 Ultrahigh-resolution ESI FT-ICR MS analysis of WSOC 2.3.1 Aerosol sample preparation
The preparation of aerosol samples for FT-ICR MS analysis was done using
Strata-10
X (Phenomenex,Torrance, CA, USA) reversed-phase solid-phase extraction (SPE) to concentrate the analytes and remove inorganic ions (Mazzoleni et al., 2010, 2012; Zhao et al., 2013). All solvents used to prepare samples for ESI FT-ICR MS analysis were of HPLC grade purity or higher. Strata-X SPE cartridges were conditioned with an application of three solvents in the following order: 3 mL of methanol, 3 mL of
acetoni-15
trile and 3 mL of optima grade HPLC water. Exactly half of 9/24 and 9/25 filters and a laboratory filter blank were cut into smaller pieces and sonicated for 30 min twice, first time in 30 mL and second time in 20 mL water. The pH was not adjusted. The 50 mL
aqueous extracts were applied at a slow rate (approx. 1 mL min−1) to enable aerosol
organic species to partition to the SPE stationary phase. SPE cartridges were rinsed
20
with water and the WSOC species retained on the SPE stationary phase were eluted with a 2 mL solution composed of water and acetonitrile in a 1 : 9 ratio. Prepared ex-tracts were stored in a freezer until cold overnight shipment on freezer packs to the Woods Hole Oceanographic Institute Fourier Transform Mass Spectrometry facility for analysis.
ACPD
14, 24753–24810, 2014 Molecular characterization of free tropospheric aerosol collected at the PMO K. Dzepina et al. Title Page Abstract Introduction Conclusions References Tables Figures J I J I Back CloseFull Screen / Esc
Printer-friendly Version Interactive Discussion Discussion P a per | Discus sion P a per | Discussion P a per | Discussion P a per |
2.3.2 ESI FT-ICR MS instrumental parameters
Aerosol WSOC samples and blanks were analyzed at the Woods Hole Oceanographic Institute Fourier Transform Mass Spectrometry facility using the ultrahigh-resolution 7 tesla FT-ICR mass spectrometer (LTQ FT Ultra, Thermo Scientific, San Jose, CA) equipped with an ESI source. Samples were infused directly into the ESI interface
5
and the ESI parameters were adjusted to obtain a stable ion current with minimum ion injection time into the mass analyzer. After optimization, the infusion flow rate was
4 µL min−1and the ESI needle voltage was −3.9 kV. Between measurements, the
sam-ple delivery apparatus was flushed with at least 500 µL of pure water and acetonitrile and their solution in 1 : 9 ratio until background noise levels were reached. Three
repli-10
cate measurements of negative and positive ion mass spectra were collected using full-scan analysis for the range of m/z values 100 to 1000 with the mass resolving power set at 400 000 (at m/z 400). In this paper, we report only the findings from the negative ion mode measurements. Automatic gain control was used to consistently fill the linear
ion trap quadropole mass analyzer (LTQ) with the same number of ions (n= 106) for
15
each acquisition and to avoid space charge effects from overfilling the mass analyzer.
The instrument was externally calibrated in negative ion mode with a standard solu-tion of sodium dodecyl sulfate and taurocholic acid. Mass accuracy for the spectra was
< 2 ppm. For each sample, more than 200 individual mass spectra recorded in the time
domain were collected and stored as transients using Thermo Xcalibur software.
20
2.3.3 Data processing and assignment of molecular formulas
The analysis of ambient aerosol by FT-ICR MS method yields thousands of elemen-tal compositions per sample (e.g., Mazzoleni et al., 2010, 2012). The aim of data processing is to interpret and represent data in an understandable and clear form. Transient co-addition and molecular formula assignment of ultrahigh-resolution
FT-25
ICR MS data was performed with Composer software (Sierra Analytics, Modesto, CA version 1.0.5) as described in detail in previous publications (Putman et al., 2010;
ACPD
14, 24753–24810, 2014 Molecular characterization of free tropospheric aerosol collected at the PMO K. Dzepina et al. Title Page Abstract Introduction Conclusions References Tables Figures J I J I Back CloseFull Screen / Esc
Printer-friendly Version Interactive Discussion Discussion P a per | Discus sion P a per | Discussion P a per | Discussion P a per |
Mazzoleni et al., 2012). Briefly, 200 recorded transients were first co-added for im-proved analyte detection (Kujawinski et al., 2002; Stenson et al., 2003). Internal
re-calibration of the mass spectra was not done and the mass accuracy was sufficient to
assign the majority of the detected ions. The molecular formula calculator was set to allow up to 100 carbon (C), 400 hydrogen (H), 100 oxygen (O), 3 nitrogen (N) and 1
5
sulfur (S) atoms per molecular formula composition. The molecular formula calculator is based on the PREDATOR algorithm (Blakney et al., 2011) and uses a Kendrick mass defect (KMD) analysis (Hughey et al., 2001) to sort ions into user-defined homologous series. Kendrick transformation (Kendrick, 1963) helps in identifying homologous series of compounds that differ in number of base units (e.g., CH2, Oxwhere x is an integer
10
> 0, and CH2O) only. KMD for an elemental composition of a compound C observed in
a mass spectrum containing base unit B (e.g., CH2) can be calculated from Kendrick
Mass (KM) as:
KM= C(observed mass) ·B(nominal mass)
B(exact mass) (1)
KMD= Nominal Kendrick Mass − KM (2)
15
All molecular formulas presented here were assigned using the CH2 homologous
series. Note that accurate formula assignments can be achieved with molecular formula
extensions other than CH2(e.g., Kujawinski and Behn, 2006). Homologous compounds
that differ by number of base units only will have the same KMD. KMD for the entire
20
mass spectrum and selected base unit can be visualized in a Kendrick mass plot, in which KMD is plotted vs. nominal Kendrick mass (NKM). This visual representation aids in recognition of elemental compositions of the same type and class.
A user-defined de novo cutoff for the homologous series is used in the
molecu-lar formula assignments. De novo cutoff is the m/z value above which the
molecu-25
lar formula assignments are made only for the ions that belong to homologous
se-ries starting below the cutoff. We used a two-step approach here following the work
ACPD
14, 24753–24810, 2014 Molecular characterization of free tropospheric aerosol collected at the PMO K. Dzepina et al. Title Page Abstract Introduction Conclusions References Tables Figures J I J I Back CloseFull Screen / Esc
Printer-friendly Version Interactive Discussion Discussion P a per | Discus sion P a per | Discussion P a per | Discussion P a per |
can be determined for species having CHO elemental composition for masses up to 1000 Da with small measurement error (< 1 ppm). However, this is not possible for species with elemental compositions including N, S and other heteroatoms. Therefore, we performed the following two methods of molecular formula assignments. Method A:
elemental composition including C, H, O, N and S with a de novo cutoff at m/z 500;
5
and Method B: elemental composition including only C, H and O with de novo cut off
at m/z 1000. The results presented here are the combination of both methods without double counting. An assignment threshold of six times the root mean square values of the signal-to-noise ratio between m/z 988–990 was applied to the data. These as-signment thresholds were 0.9, 0.2 and 0.1 % for 9/24, 9/25 and and laboratory filter
10
blank, respectively. For the three replicates of each sample measured by FT-ICR MS, only the molecular formula assignments found in all three replicate analyses were re-tained. Molecular formulas with measurement errors larger than 3 ppm were discarded. Chemical rules and assumptions for additional quality assurance of the assigned for-mulas were adopted from Koch et al. (2005) and are described in detail in Putman
15
et al. (2012).
Structural properties of molecular formulas can be inferred from the hydrogen
defi-ciency, which is defined as the difference between the number of H atoms in a molecule
and its completely saturated acyclic analogue. This difference corresponds to the
num-ber of double bonds and rings in a molecule (McLafferty and Turecek, 1993; Lobodin
20
et al., 2012) and is referred to as the double bond equivalents (DBE) for a molecule in the general form of CcHhNnOoSsas:
DBE(CcHhNnOoSs)= c −h
2+
n
2+ 1 (3)
Another metric to estimate the degree of molecular saturation and structure is the
25
aromaticity index (AI). AI is defined as the minimum number of C-C double bonds and rings required to rationalize these molecular features based on elemental composition (Koch and Dittmar, 2006). AI is calculated for CcHhNnOoSsmolecular compositions by
ACPD
14, 24753–24810, 2014 Molecular characterization of free tropospheric aerosol collected at the PMO K. Dzepina et al. Title Page Abstract Introduction Conclusions References Tables Figures J I J I Back CloseFull Screen / Esc
Printer-friendly Version Interactive Discussion Discussion P a per | Discus sion P a per | Discussion P a per | Discussion P a per |
taking into account the C bonds with heteroatoms as:
AI= DBEAI/CAI= (1 + c + o + s − 0.5 · h)/(c − o − s − n) (4)
The elemental composition from each of the molecular assignments, accessible with ultrahigh-resolution of FT-ICR MS, enables the calculation of their O/C, H/C and
5
OM/OC ratios. O/C (H/C) elemental ratio is calculated as the ratio of the number of O (H) vs. C atoms directly from detected elemental composition. OM/OC ratio is calculated as the ratio between measured or estimated mass and calculated mass of carbon in assigned molecular formulas. Properties of samples can also be evaluated by relative abundance weighting, which is determined by Eqs. (5)–(8) for each elemental
10 composition CcHhNnOoSs: O/Cw=P wi· Oi P wi· Ci (5) H/Cw=P wi· Oi P wi· Hi (6) DBEw=P wi· DBEi P wi (7) OM/OCw=P wi· OM/OCi P wi (8) 15
where wi is the relative abundance for each individual molecular formula i . The sum
includes all molecular formula assignments in a sample or its subset. Error of the weighted values is calculated by propagating the standard deviation (1σ) of the rel-ative abundance used to weight the values for the group (Mazzoleni et al., 2012; Zhao
20
ACPD
14, 24753–24810, 2014 Molecular characterization of free tropospheric aerosol collected at the PMO K. Dzepina et al. Title Page Abstract Introduction Conclusions References Tables Figures J I J I Back CloseFull Screen / Esc
Printer-friendly Version Interactive Discussion Discussion P a per | Discus sion P a per | Discussion P a per | Discussion P a per |
2.4 FLEXPART particle dispersion model
Air mass history was determined using the Lagrangian particle dispersion model (LPDM) FLEXPART (version 8.2, Stohl et al., 1998). FLEXPART was used to determine the air mass history of plumes arriving at the PMO by simulating the release of thou-sands of passive tracer air parcels at the PMO location and advecting them backwards
5
in time, providing a representation of the spatial distribution of the air mass at an upwind time referred to as a “retroplume”. The meteorology dataset was comprised of a combi-nation of 6 h meteorological final analysis data at 00:00, 06:00, 12:00, and 18:00 UTC, and 6 h Global Forecast System data at 03:00, 09:00, 15:00, and 21:00 UTC. All other model settings matched those used in Owen et al. (2006).
10
Retroplumes were also combined with anthropogenic and fire CO emission invento-ries to predict plume sources and ages (Owen and Honrath, 2009). For each upwind period, the portion of each retroplume in the 0–300 m layer was multiplied with the emission inventory to compute contributions of both emission types.
3 Results and discussion
15
3.1 Chemical characterization of the Pico Mountain Observatory samples
The analysis of the bulk chemical composition of filter-collected samples during 2012 shows that organic compounds often comprised the largest mass fraction of to-tal aerosol, as presented by an overview in Table 1. Measured OC was converted to OM using the OM/OC ratio of 1.8 adopted from Pitchford et al. (2007)
repre-20
senting the literature consensus for remote areas. After blank subtraction, the aver-age ambient mass concentration (± standard deviation, 1σ) of filter-collected species
(OM+EC+SO2−4 +NO−3+Cl−) at the PMO during 2012 was 0.9 ± 0.6 µg m−3. On
aver-age, organics represent the largest mass fraction of the total measured aerosol species (57±21 %) followed by sulfate (21±12 %), nitrate (17±14 %), chloride (3±4 %), and EC
ACPD
14, 24753–24810, 2014 Molecular characterization of free tropospheric aerosol collected at the PMO K. Dzepina et al. Title Page Abstract Introduction Conclusions References Tables Figures J I J I Back CloseFull Screen / Esc
Printer-friendly Version Interactive Discussion Discussion P a per | Discus sion P a per | Discussion P a per | Discussion P a per |
(2 ± 2 %). Figure 1a gives an overview of chemical composition of aerosol collected on filters at PMO during summer 2012. The OM/OC ratio of 1.8 adopted in our analysis is slightly higher than the OM/OC ratio of ∼ 1.7 calculated from FT-ICR MS analysis of WSOC elemental compositions (Table 2). As described in Mazzoleni et al. (2010), the elemental composition of each of the assigned molecular formulas enables calculation
5
of OM/OC ratios. However, since the highly oxygenated low molecular weight species (MW ≤ 100) are not well retained on the SPE column, they would not be detected and thus were not part of the calculated OM/OC ratios. This can lead to somewhat lower OM/OC ratios than those determined using other methods (e.g., Hallar et al., 2013 and references therein). Therefore, an OM/OC value of 1.8 is appropriate for use here
10
and might be the lower limit of OM/OC.
Figure 1b–d shows continuous measurements of BC mass concentration, the
aerosol light scattering coefficient and number concentration for time periods
overlap-ping with the filter-collection periods. We averaged those aerosol measurements over the filter-collection sampling periods (Fig. 1a), and the average BC mass concentration
15
varies between 0.82 and 74 ng m−3 (Table 1), the average light scattering coefficient
varies between 0.2 and 16.3 M m−1, while the particle number varies between 0.3 and
21 particles m−3. Correlations between total filter-collected aerosol mass and on-line
aerosol measurements are very good, as shown in Supplement Fig. S2 (with an r2 of
0.80, 0.90 and 0.93 for BC mass concentration, the aerosol light scattering coefficient
20
and number concentration, respectively). This indicates that these three very di
ffer-ent types of aerosol measuremffer-ents captured the same trends during the overlapping sampling periods (Fig. 1).
3.2 Characterization of air masses during 24–26 September 2012
This section explains the choice of two filter-collected samples for detailed
molecu-25
lar characterization by ultrahigh-resolution FT-ICR MS. The two samples are named 9/24 and 9/25 representing the date when sampling of each filter started. The filter-collection period for 9/24 is 24 September 2012 at 15:00–25 September 2012 at 15:00
ACPD
14, 24753–24810, 2014 Molecular characterization of free tropospheric aerosol collected at the PMO K. Dzepina et al. Title Page Abstract Introduction Conclusions References Tables Figures J I J I Back CloseFull Screen / Esc
Printer-friendly Version Interactive Discussion Discussion P a per | Discus sion P a per | Discussion P a per | Discussion P a per |
and for 9/25 is 25 September 2012 at 15:00–26 September 2012 at 15:00 (Table 2). In this paper, unless noted otherwise, “9/24” and “9/25” always refer to the filter samples collected during these time periods.
An increase in the measured aerosol mass concentration and light scattering was observed during September 2012. As shown in Fig. 1, the highest loading of
filter-5
collected aerosol was observed in 9/24, followed by decreased mass concentrations in 9/25. Similar trends were also observed for the continuous measurements (Fig. 1b– d) of BC mass concentration, aerosol light scattering and particle count. The observed values were much higher than during other periods overlapping with the daily filter mea-surements. The observed elevated aerosol concentrations are explained by the arrival
10
of air masses from North America with biomass burning influenced aerosol. Septem-ber 2012 was a dry month and several US states were experiencing a period of intense drought (NOAA National Climatic Data Center, 2012). Consequently, widespread wild-fires were observed in the US northwest and northern Rockies (e.g., Idaho, Montana, Washington and Oregon). While the monthly number of wildfires of 3734 was the 2nd
15
lowest during 2000–2012 observation period, the average monthly fire size was the 2nd highest for the same period with a total burn area of 1 077 766 acres. The wildfire ac-tivity during September 2012 in the northwestern US is corroborated by the Moderate Resolution Imaging Spectroradiometer (MODIS) satellite daily fire counts in Supple-ment Fig. S3 (NASA and University of Maryland, 2002), which also shows that the most
20
intense wildfire activity was in the northwestern US (Fig. S3 in the Supplement). The Level 3 Aerosol Optical Depth (AOD) Dark-Target (Levy et al., 2007) products (1◦× 1◦) retrieved by MODIS Terra/Aqua at 550 nm (http://disc.sci.gsfc.nasa.gov/giovanni) indi-cate a large increase in AOD from mid to late September over northwestern US (data not shown), suggesting an increase in aerosol load over the northwestern US during
25
this period, coinciding with the fire counts.
The FLEXPART retroplumes also support our findings, indicating different aerosol
compositions and mass concentrations in the two samples. The resulting retroplumes show that the transport patterns changed tremendously within 48 h and thus brought
ACPD
14, 24753–24810, 2014 Molecular characterization of free tropospheric aerosol collected at the PMO K. Dzepina et al. Title Page Abstract Introduction Conclusions References Tables Figures J I J I Back CloseFull Screen / Esc
Printer-friendly Version Interactive Discussion Discussion P a per | Discus sion P a per | Discussion P a per | Discussion P a per |
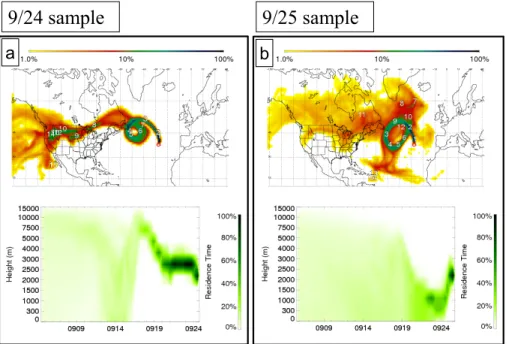
air masses with different chemical signatures to the PMO (retroplumes representative
for the two measurement periods, and all retroplumes during 9/24 and 9/25 are given in Figs. 2 and Supplement Figs. S4 and S5, retrospectively). During the measurement period of the 9/24 sample (retroplumes are shown in Fig. S4 in the Supplement), the average modeled age of the CO associated with this plume was 12 days. A large
5
portion of the retroplumes intersects the northwestern US regions of intense wildfires activity during 13–15 September 2012 (Fig. 2 and Supplement Fig. S3). A few retro-plumes (Supplement Fig. S4e–g) were lifted to the free troposphere within the next day and encountered a high pressure system before arriving at PMO. Retroplumes during the 9/25 sample collection (Fig. S5 in the Supplement) have a CO tracer age of 15
10
days and are characterized by gradual shift of the transport heights from the middle free troposphere to the marine boundary layer and lack of influence from the US. For example, retroplumes subsided drastically and entered marine boundary two days be-fore arriving at PMO (Supplement Fig. S5e–h). Therebe-fore, the air masses arriving at PMO during the measurement period of 9/24 are highly influenced by the US biomass
15
burning, while the ones that arrived during 9/25 are more strongly influenced by the marine boundary layer. Simulated contributions of FLEXPART CO from various sources during September 2012 are given in Supplement Fig. S6.
We also examined the occurrence of upslope flow due to mechanical lifting during September 2012 by using the same methodology as Zhang et al. (2014). No
occur-20
rence of upslope flow was observed for the period of 24–26 September 2012 selected for detailed study in this work. This suggests that filter-collected samples during those
dates were not affected by local emissions due to mechanically lifted upslope flow.
3.2.1 Non-methane hydrocarbon measurements
Measurements of gas-phase species such as NMHC and ozone for 24–26 September
25
offer additional means to determine the origin of air masses sampled at the
observa-tory. Methods for the NMHC and ozone measurements have been described in detail elsewhere (Helmig et al., 2008; Tanner et al., 2006; Oltmans and Levy II, 1994). The
ACPD
14, 24753–24810, 2014 Molecular characterization of free tropospheric aerosol collected at the PMO K. Dzepina et al. Title Page Abstract Introduction Conclusions References Tables Figures J I J I Back CloseFull Screen / Esc
Printer-friendly Version Interactive Discussion Discussion P a per | Discus sion P a per | Discussion P a per | Discussion P a per |
observed change in the air masses during filter measurements of 9/24 and 9/25 is supported by the measurements of ethane and propane in Fig. 3e, which are shown together with the filter-measured species and continuous aerosol measurements for comparison (Fig. 3a–d). Ethane and propane mixing ratios increased during the mea-surement period of the 9/24 sample and decreased during the meamea-surement period of
5
the 9/25 sample. As shown, the mixing ratio of ethane (propane) increased from 0.78 (0.09) ppbv at 19:20 in the evening of 24 September to a maximum of 1.25 (0.22) ppbv at 09:30 in the morning of 25 September. This was followed by a clear decrease in ethane and propane to average mixing ratios of 0.76 and 0.06, respectively, during the measurement period of the 9/25 sample. Decreases in NMHC mixing ratios were also
10
evident in a drop of ln(propane/ethane) (Fig. 3e). The same trend was observed in the ozone mixing ratios during the case study period (Fig. 3f). The decreases in ethane, propane, and ozone mixing ratios, as well as in ln(propane/ethane) suggest a signifi-cant change in the air masses transport and history, from less aged and more polluted air masses during measurement period of 9/24 to more aged and cleaner during
mea-15
surement period of 9/25. The full record of gas-phase species mentioned above and measured during periods overlapping with Hi-Vols sampling is shown in Supplement Fig. S7.
3.2.2 Scanning electron microscopy (SEM) analysis
Representative SEM images for 9/24 and 9/25 are shown in Fig. 4a and b,
respec-20
tively. Over 2000 individual particles from each of the 9/24 and 9/25 samples were classified based on their morphology to investigate relative abundance of spherical particles. A higher fraction of spherical particles was observed on 9/24 (∼ 43 %) com-pared to 9/25 (∼ 18 %). However, the fraction of near spherical particles was slightly lower on 9/24 (∼ 23 %) compared to 9/25 (∼ 29 %). The spherical particles observed
25
on 9/24 and 9/25 are likely tar balls (TBs) (Fig. 4c–d). TB are spherical, organic amorphous particles composed of carbon and oxygen and one of the major types of particles in biomass burning aerosol (Adachi and Buseck, 2011; China et al., 2013;
ACPD
14, 24753–24810, 2014 Molecular characterization of free tropospheric aerosol collected at the PMO K. Dzepina et al. Title Page Abstract Introduction Conclusions References Tables Figures J I J I Back CloseFull Screen / Esc
Printer-friendly Version Interactive Discussion Discussion P a per | Discus sion P a per | Discussion P a per | Discussion P a per |
Pósfai et al., 2003, 2004; Tivanski et al., 2007). The EDS analysis of spherical and near spherical particles shows that they are mostly composed of C and O, consistent with the hypothesized identification. The diameter range of the TBs observed for fresh (minutes to ∼ 1 h aged) biomass burning plumes is typically 30 to 500 nm (Adachi and Buseck, 2011; Pósfai et al., 2004), while a broader range (50–1600 nm) is observed
5
for relatively aged (∼ 1–2 h aged) plumes (China et al., 2013). The TBs observed here have diameters in the range of 70–1800 nm and a plume age > 12 days. The relative abundance of TBs depends on the plume age. For example, fractions of TBs up to 90 % have been reported in 1–2 h aged plumes (China et al., 2013; Hand et al., 2005; Pósfai et al., 2003, 2004), but smaller fractions of TBs (∼ 15 %) have been observed in fresh
10
aerosol (Adachi and Buseck, 2011). As described by China et al. (2013), up to 50 % of soot particles emitted from biomass burning are heavily coated (embedded) with other
material. Thus, we visually classified the soot particles for 9/24 and 9/25 (N= 433 and
550, respectively) using the classification described by China et al. (2013) to investigate if the mixing of the soot after long-range transport was heavily coated (embedded soot),
15
partly coated, thinly coated, or mixed/attached with other material (soot-inclusion). We found that ∼ 46 % of the soot particles with respect to the total number of classified soot particles of 9/24 were heavily coated (Fig. 4e–h) compared to ∼ 17 % only in 9/25. The higher fraction of heavily coated soot particles observed for 9/24 suggests that the air mass on 9/24 was most likely influenced by a biomass burning plume. The
20
fractions of other types of mixing for classified soot particles for 9/24 and 9/25 are 34 and 58 % for partly coated, 11 and 17 % for bare and 7 and 8 % for soot-inclusion.
The SEM analysis presented in this work was performed to investigate the typical morphology of particles collected during 24–26 September 2012 case study and their possible sources. Note that the spherical particles (possibly tar balls) detected by SEM
25
analysis during the case study are not likely to be water-soluble. Therefore, the ultra-high resolution mass spectrometry analysis of WSOC compounds presented below probably does not probe them.
ACPD
14, 24753–24810, 2014 Molecular characterization of free tropospheric aerosol collected at the PMO K. Dzepina et al. Title Page Abstract Introduction Conclusions References Tables Figures J I J I Back CloseFull Screen / Esc
Printer-friendly Version Interactive Discussion Discussion P a per | Discus sion P a per | Discussion P a per | Discussion P a per |
3.3 Molecular level characterization of the 9/24 and 9/25 samples 3.3.1 Mass spectra and molecular formula assignments
The exact mass measurements of the ultrahigh resolution FT-ICR MS allow for
unequiv-ocal molecular formula assignments of WSOC in the form of CcHhNnOoSs, where c,
h, n, o and s are numbers of C, H, N, O and S atoms. Molecular formulas were
as-5
signed to 68–78 % of the total ion current depending on the sample and whether the assignment of molecular formulas was performed by method A or B. The three repli-cate measurements of 9/24 and 9/25 analyzed by method A with C, H, N, O and S resulted in 72 and 78 % assignments of total ion current. Additional molecular formulas at the higher m/z values were assigned with method B for species containing C, H
10
and O only. When methods A and B were combined, the assignments yielded a to-tal of 3960 and 4770 monoisotopic molecular formulas for 9/24 and 9/25 (Table 2).
Polyisotopic formula assignments containing naturally occurring13C and34S were also
detected in aerosol samples. The vast majority of all assigned monoisotopic formulas
contains corresponding13C assignments (91–95 %), while 69–100 % of32S-containing
15
monoisotopic ions also contain formula assignments with34S, consistent with previous
findings (e.g., Mazzoleni et al., 2012).
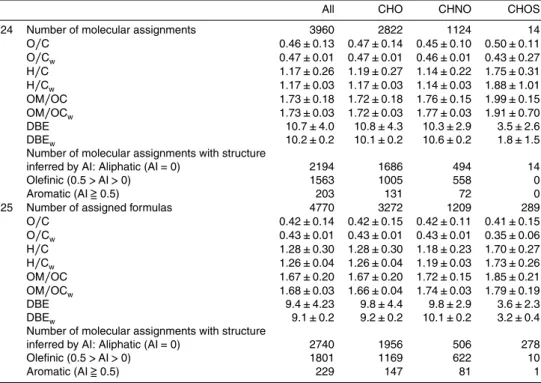
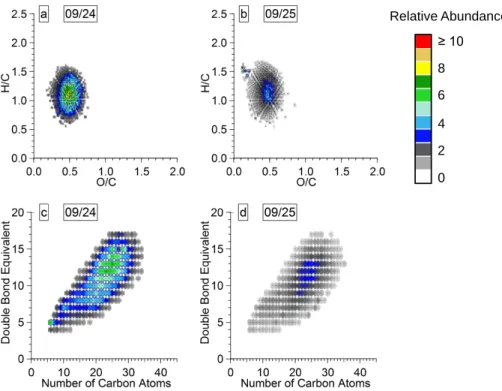
The reconstructed mass spectra of molecular formulas assigned to 9/24 and 9/25 WSOC (Fig. 5) indicate a high isobaric complexity due to the large number of monoiso-topic anions (Table 2). Examples of the isobaric complexity are illustrated for the range
20
of m/z 409.0–409.3 (Fig. 5c and g) with 12 and 21 molecular assignments for 9/24 and 9/25. Mass spectra of both WSOC samples are characterized by high m/z values with maximum relative abundance of detected ions in the range of m/z 400–500. Ap-proximately 2/3 of all detected molecular assignments are found at high m/z > 400. This is a unique feature of the WSOC at PMO that has not been observed in other
sam-25
ples analyzed with FT-ICR MS. Previously, maximum relative abundance of molecular assignments detected in aerosol (Wozniak et al., 2008; Schmitt-Kopplin et al., 2010; Mazzoleni et al., 2012) and cloud water (Zhao et al., 2013) were observed between
ACPD
14, 24753–24810, 2014 Molecular characterization of free tropospheric aerosol collected at the PMO K. Dzepina et al. Title Page Abstract Introduction Conclusions References Tables Figures J I J I Back CloseFull Screen / Esc
Printer-friendly Version Interactive Discussion Discussion P a per | Discus sion P a per | Discussion P a per | Discussion P a per |
m/z 200–400. Moreover, WSOC samples collected from various other locations do
not have a significant number of compounds detected above m/z 400 (e.g., Wozniak et al., 2008; Mazzoleni et al., 2010). The higher molecular weight ranges observed in PMO WSOC samples are likely a result of the aging processes during the long-range transport.
5
The assigned molecular formulas were divided into four groups based on their el-emental composition and named after the atoms included: CHO, CHNO, CHOS and CHNOS. The highest number of molecular assignments were CHO group species, which account for ∼ 70 % of the total number of assigned species (Table 2). CHO species have the highest observed relative abundance values with a maximum in the
10
range of m/z 400–500 (Fig. 5). All molecular formulas assigned to the CHO group in
both samples were characterized by distinct spacing of CH2 homologous series. The
second most abundant group of species was CHNO with ∼ 26 % of molecular assign-ments (Table 2). The maximum relative abundance of the CHNO group was at slightly higher m/z values compared to CHO compounds. We observed a surprisingly small
15
number of S containing species. There were 14 and 289 CHOS molecular formulas in 9/24 and 9/25, representing 0.4 and 6 % of all assignments. The CHOS species de-tected in 9/24 had low relative abundance and only two ions had relative abundance
> 1.5 % (C12H26SO4 and C14H30SO4). Most of the CHOS assignments in 9/25 also had low relative abundance (< 2 %), but 12 have relative abundance > 5 %. Finally,
20
a very small number of low relative abundance CHNOS compounds were detected
in 9/24 and 9/25 (N= 7 and 28). It is not likely that nitrooxy organosulfates will be
observed after long-range transport, especially given that WSOC compounds contain such a small number of S containing species. Thus, the CHNOS molecular formula assignments were not included in the analysis presented here.
25
Overall, the Kendrick plots of the molecular assignments for the two samples (Fig. 6a and c) have higher values of both KMD and NKM with a narrower distribution compared to Zhao et al. (2013). This narrow and uniform distribution has not been observed in other Kendrick plots of aerosol WSOC (e.g., Kourtchev et al., 2013) and may be an
ACPD
14, 24753–24810, 2014 Molecular characterization of free tropospheric aerosol collected at the PMO K. Dzepina et al. Title Page Abstract Introduction Conclusions References Tables Figures J I J I Back CloseFull Screen / Esc
Printer-friendly Version Interactive Discussion Discussion P a per | Discus sion P a per | Discussion P a per | Discussion P a per |
indication of highly processed aerosol. Ultrahigh-resolution FT-ICR MS measurements of a Suwannee River Fulvic Acid standard, a model for HULIS, yield very similar dis-tribution in the Kendrick plot (Stenson et al., 2003), confirming the very aged and pro-cessed nature of PMO aerosol WSOC. Due to the presence of thousands of molecular assignments, it is difficult to see the details of the Kendrick plot. Therefore, Fig. 6b
5
shows an excerpt of the Kendrick plot for 9/24 in order to illustrate the molecular com-plexity. Numerous molecular assignments are apparent and the separation in
homolo-gous series is evident with the same KMD differing by number of CH2base units only.
As examples, we highlighted three homologous series belonging to the CHO, CHNO and CHOS groups: (CH2)1−19C3H4O4, (CH2)1−5C6H3NO2, and (CH2)1−2,5,7C7H16SO4,
10
respectively.
The molecular formulas of ions in the FT-ICR mass spectrum can be accurately calculated due to its high resolution and accuracy; this enables the calculation of el-emental ratios. This is visualized using van Krevelen diagrams (Kim et al., 2003) with the H/C ratio plotted against the O/C, or N/H or S/H ratio (Wu et al., 2004). The van
15
Krevelen diagrams for the 9/24 and 9/25 in Figs. 6d and f show a narrow and ho-mogeneous distribution with aliphatic and olefinic species (Table 2). For example, the range of values of O/C ratio for aerosol WSOC collected at the PMO vs. the Storm Peak Laboratory (Mazzoleni et al., 2012) is 0.13–1.48 vs. 0.07–1.80. As discussed in the following sections, this tight distribution might be characteristic of very processed
20
aerosol. Molecular assignments in the van Krevelen diagram are aligned to lines re-flecting different chemical trends and reactions. Examples of those lines are visualized in Fig. 6e, including: (i) saturation or unsaturation, (ii) oxidation or reduction; and (iii) functionalization (i.e., alkylation in this diagram) or fragmentation. Mass resolved H/C diagrams are given in Fig. S8 in the Supplement to confirm the quality of molecular
25
assignments of ultrahigh-resolution FT-ICR mass spectra. The similarity in the distri-butions of species in the mass resolved H/C diagram reported here to those reported previously (Schmitt-Kopplin et al., 2010) is noted and further discussed in the sections below.
ACPD
14, 24753–24810, 2014 Molecular characterization of free tropospheric aerosol collected at the PMO K. Dzepina et al. Title Page Abstract Introduction Conclusions References Tables Figures J I J I Back CloseFull Screen / Esc
Printer-friendly Version Interactive Discussion Discussion P a per | Discus sion P a per | Discussion P a per | Discussion P a per |
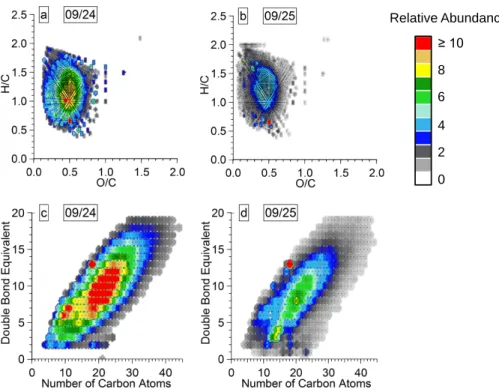
DBE (Eq. 3) and AI (Eq. 4) values help in inferring the structures of the molecular for-mulas. The DBE for 9/24 and 9/25 cover a wide range of values (Figs. 6g and 6i) con-sistent with the molecular complexity of the samples described above. The distribution of molecular assignments in DBE vs. number of carbon atoms is both wide and uniform, which might be characteristic for highly aged and processed aerosol. Numerous
homol-5
ogous series of species overlap at each DBE value. Figure 6h highlights examples of homologous series with DBE values of 10–12 for CHO (C14H10O10 (CH2)n, C15H10O11 (CH2)n and C14H6O7 (CH2)n), and CHNO groups (C14H11NO10 (CH2)n, C16H13NO11
(CH2)n and C16H11NO11 (CH2)n). AI analysis of PMO WSOC supports the
observa-tions from the elemental ratios and DBE values. In both samples, most of the species
10
have aliphatic (∼ 55 %) and olefinic (∼ 40 %) character with only a small contribution from aromatic species (∼ 5 %) (Table 2). This finding is in agreement with previous studies of ambient aerosol (Schmitt-Kopplin et al., 2010; Mazzoleni et al., 2010, 2012; LeClair et al., 2012), which also found that a majority of species have aliphatic and olefinic character.
15
3.3.2 Molecular formulas assignments of the CHO group
The CHO species presented in the isoabundance van Krevelen diagram (Fig. 7a and b) for 9/24 and 9/25 have average O/C ratios of 0.47 and 0.42 and average H/C ratios of 1.19 and 1.28 (Table 2). Overall, the range of observed O/C ratios is 0.1–1.5 and the range for H/C ratios is 0.4–2.2. The highest relative abundance species in 9/24 are
20
near O/C ∼ 0.5 and H/C ∼ 1.1 and those in 9/25 are near O/C ∼ 0.4 and H/C ∼ 1.2. There are eight low relative abundance (< 3 %) molecular assignments with an O/C ≥ 1 in each sample. Both samples have a wide distribution of elemental ratios around the maximum in the van Krevelen diagrams. The distribution of elemental ratios of the CHO group is similar to the aerosol samples reported by Mazzoleni et al. (2012) and
25
much tighter than the cloud water samples reported by Zhao et al. (2013) measured at the Storm Peak Laboratory.
ACPD
14, 24753–24810, 2014 Molecular characterization of free tropospheric aerosol collected at the PMO K. Dzepina et al. Title Page Abstract Introduction Conclusions References Tables Figures J I J I Back CloseFull Screen / Esc
Printer-friendly Version Interactive Discussion Discussion P a per | Discus sion P a per | Discussion P a per | Discussion P a per |
The DBE of the CHO molecular assignments for PMO samples (Fig. 7c and d) spans a wide range of values (0–19) and increases with the carbon number. The average DBE values are 10.8 and 9.8 for 9/24 and 9/25. The average DBE values of CHO compounds are much higher than the average DBE values of ∼ 6 observed in studies of WSOC in continental samples (Mazzoleni et al., 2012; Lin et al., 2012a; Zhao et al.,
5
2013), which indicates they are more unsaturated. The CHO species are equally dis-tributed among the range of DBE values with the highest relative abundance species in 9/24 and 9/25 found between DBE 5–14 and 3–14. The high relative abundance compounds (relative abundance ≥ 10 %) of 9/24 have 7–30 carbon atoms and the highest relative abundance compounds (relative abundance ≥ 20 %) have molecular
10
assignments with 17–24 carbon atoms (Fig. 7c). DBE values of 9/25 follow a similar pattern (Fig. 7d) and its high relative abundance CHO compounds have 8–31 carbon atoms (relative abundance ≥ 5 %), with the highest relative abundance compounds (rel-ative abundance ≥ 10 %) among molecular assignments having 12–26 carbon atoms. Clearly, the highest relative abundance CHO species of 9/25 have a wider distribution
15
of DBE values than those on 9/24. The weighted O/C ratios of 0.47 and 0.43 for the CHO group (Table 2) of 9/24 and 9/25 are similar to those observed for other samples collected at the Storm Peak Laboratory, a high-altitude observatory near Steamboat Springs, CO, USA. Mazzoleni et al. (2012) reported a value of 0.48 for aerosol sam-ples and Zhao et al. (2013) reported a value of 0.47 for cloud water samsam-ples both from
20
the Storm Peak Laboratory. A slightly higher O/C ratio of ∼ 0.5 was observed for fog water samples collected in Fresno, CA (Mazzoleni et al., 2010). The weighted H/C ratios for 9/24 and 9/25 observed in this work are 1.17 and 1.26, which is lower than previous values of ∼ 1.5 reported for WSOC samples of aerosol (Wozniak et al., 2008; Mazzoleni et al., 2012), cloud water (Zhao et al., 2013), fog water (Mazzoleni et al.,
25
2010), and rainwater (Altieri et al., 2009a). The low H/C and high DBE values suggest a higher degree of unsaturation for PMO samples and this is in agreement with longer aging times during which processing can lead to more SOA formation (Ng et al., 2011). The O/C ratios of PMO samples are consistent with those reported for aged biomass
ACPD
14, 24753–24810, 2014 Molecular characterization of free tropospheric aerosol collected at the PMO K. Dzepina et al. Title Page Abstract Introduction Conclusions References Tables Figures J I J I Back CloseFull Screen / Esc
Printer-friendly Version Interactive Discussion Discussion P a per | Discus sion P a per | Discussion P a per | Discussion P a per |
burning aerosol measured by an Aerodyne Aerosol Mass Spectrometer (AMS) (Aiken et al., 2008). Ultrahigh resolution MS elemental ratios have been found to both agree (Bateman et al., 2012) and disagree (O’Brien et al., 2013) with the ones measured by an AMS, although a direct comparison of elemental ratios measured by FT-ICR MS and AMS has not yet been reported.
5
A number of molecular formulas matching biomass burning markers (Simoneit, 2002) were observed in PMO samples. Burning products of biopolymers such as cellulose, lignin and lignans can represent major amounts of OA originating from biomass burn-ing. Levoglucosan is one of the main particle-phase markers of cellulose decomposi-tion and its molecular formula (C6H10O5) was observed with relative abundance values
10
of 3.4 and 0.6 % in 9/24 and 9/25. Note this formula could come from other com-pounds having the same molecular formula such as galactosan and mannosan (Si-moneit et al., 2001). In both 9/24 and 9/25 we also observed formulas that could be lignin pyrolysis products such as vanillic acid (C8H8O4; relative abundance= 11.1
and 2.0 %), syringaldehyde (C9H10O4; relative abundance = 9.2 and 2.0 %) and
sy-15
ringic acid (C9H10O5; relative abundance = 7.3 and 1.4 %). In all cases, higher rel-ative abundance values were observed in the mass spectra of 9/24. Burning of the lignin produces phenol (C6H6O), guaiacol (2-methoxyphenol; C7H8O2) and syringol
(1,3-dimethoxyphenol; C8H10O3) (Simoneit, 2002). Phenols can also be formed in the
atmosphere by oxidation of aromatics and HULIS (Graber and Rudich, 200). These
20
molecular formulas were found in 9/24 and 9/25 with higher relative abundance
on 9/24, including: phenol (relative abundance = 3.5 and 0.6 %), guaiacol (relative
abundance= 2.8 and 0.7 %), and syringol (relative abundance = 7.0 and 1.5 %). Sun
et al. (2010) observed that aqueous-phase oxidation of guaiacol and syringol yields a substantial fraction of dimers and higher oligomers. Key dimer markers were
iden-25
tified as C16H18O6 and C14H14O4. Their results indicated that fog and cloud process-ing of phenolic species could be an important mechanism for the production of low-volatility SOA. The dimer markers C16H18O6and C14H14O4 are also present in PMO
ACPD
14, 24753–24810, 2014 Molecular characterization of free tropospheric aerosol collected at the PMO K. Dzepina et al. Title Page Abstract Introduction Conclusions References Tables Figures J I J I Back CloseFull Screen / Esc
Printer-friendly Version Interactive Discussion Discussion P a per | Discus sion P a per | Discussion P a per | Discussion P a per |
respectively; for 9/25: relative abundance = 4.4 and 2.4 %, respectively). This
sug-gests that the samples collected at PMO were influenced by biomass burning aerosol, processed by clouds and remained in the particle-phase after the evaporation of water. Similar observations of aqueous-phase processing of biomass burning aerosol were previously reported for cloud water (Zhao et al., 2013) and fog water samples
(Maz-5
zoleni et al., 2010).
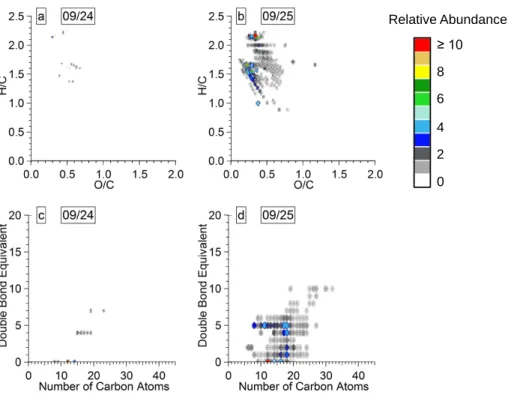
3.3.3 Molecular assignments of the CHNO group
Aerosol WSOC CHNO species collected at PMO have a tight distribution of elemen-tal ratios in the isoabundance van Krevelen diagram (Fig. 8a and b). For 9/24, O/C and H/C ratios span the range of 0.2–0.75 and 0.6–1.6 with higher relative abundance
10
molecular formulas (relative abundance ≥ 4 %) in the range of 0.3–0.6 and 0.8–1.4. Similar values were observed for 9/25. Average O/C ratios for 9/24 and 9/25 were 0.45 and 0.42 and average H/C ratios were 1.14 and 1.18. A comparison of the dis-tribution of the CHO and CHNO molecular assignments in the van Krevelen diagrams (Figs. 7 and 8, respectively) shows that they are found in similar ranges. The CHNO
15
species have an overall tighter distribution than CHO. Consequently, the average val-ues of elemental ratios for CHO and CHNO species are similar for each sample, which may be an indication of the same emission sources and transformation processes. The O/C ratios of the CHNO compounds are lower than those previously observed for continental samples of fog (∼ 0.5, Mazzoleni et al., 2010), aerosol (0.57, Mazzoleni
20
et al., 2012) and cloud water (0.72, Zhao et al., 2013). Similarly, CHNO molecular species detected in continental rainwater samples (Altieri et al., 2009a, b) are more
oxygenated (O/C= 1.6) and saturated (H/C = 1.9) than PMO aerosol WSOC. Lower
elemental ratios of PMO WSOC might be a result of oxidation leading to increased molecular fragmentation due to the long-range transport of the collected aerosol.
Ru-25
ral aerosol collected at a ground site had elemental ratios similar to those reported here, and might have been influenced by biomass burning as indicated by the de-tection of marker species such as lignin and nitro-aromatics (Wozniak et al., 2008).