Design and
implementation of an
algorithmic trading
system for the Sifox
application
Mário André Ferreira Pinto
Dissertação de Mestrado apresentada à
Faculdade de Ciências da Universidade do Porto em Ciência de Computadores
2014
Design and im p le m en ta ti o n of an a lg o rith m tr ad in g sy ste m fo r th e Si fo x a p p lic ati o n Má rio An dré F erre ira Pi nto FCUP 2014 2.º CICLODesign and
implementation of an
algorithmic trading
system for the Sifox
application
Mário André Ferreira Pinto
Mestrado Integrado de Engenharia de Redes e Sistemas Informáticos
Departamento de Ciência de Computadores 2014
Orientador
Daniel Lima Eusébio, BSc., Finantech
Coorientador
I would like tho thank my supervisor Daniel Eusébio and his team at Finantech. The knowledge and experience they shared will accompany me through my professional life, and was an important part of my entry on the financial world. I also would like to thank the support of my supervisor at the Department of Computer Science, Prof. Inês Dutra, for the reassurance, the kind words and the helpful advice in developing this document.
I am grateful to BPI Investment Banking Manager Pedro Costa for his availability and time on providing a insight on the most common trading algorithms and trader priorities.
A special thanks to my parents for all the support and patience. Thank you for providing all the means that allowed me to follow my own path.
I would like to thank my friends from the Faculty of Science of Oporto University, for the important support provided. The gaming nights, the jokes and laughs, helped me to keep going forward. Among them, I would like to emphasize my thanks to Mafalda, Daniel, Cristiano, Ramalho, Pedro, Luís, Carlos and Miguel.
Finally, a special thanks to my lunch buddies, José, Nuno and Carla. Their companionship and advice was very important.
Abstract
The financial markets thrive on information, as its existence makes them increasingly more efficient. As new information technology was developed, the exchanges quickly adopted them, eager to take advantage of the opportunities provided. The new technology allowed for faster communication, greater accessibility to the markets and the new infrastructure helped decreasing the cost of doing business. Today, a trader with a large number of accounts to manage, has his time stretched thin, as the information available for analysis is abundant, if not overwhelming. The new properties of the electronic exchange, mainly on the order book, allows the use of algorithms that can be useful for automating some trading processes. This automation can improve the trader time management and efficiency.
In this thesis we provide algorithmic functionality to the Sifox trading application. We analyzed the requirements and issues of three market-impact algorithms (TWAP, VWAP and POV) and designed a prototype which we integrated in the Sifox application. During the development, for the VWAP algorithm, we tested several models for volume prediction, obtaining best results for a exponentially weighted mean average of eleven days for the Google stock. We further develop our prototype including these findings.
Os mercados financeiros prosperam com a existência de informação, ficando mais eficientes. À medida que novas tecnologias de informação foram desenvolvidas, a Bolsa apressou-se a adoptá-las, tendo em conta as novas oportunidades fornecidas. Esta nova tecnologia permitiu uma maior velocidade de comunicação, facilidade de acesso aos mercados e, com a nova infraestrutura, ajudou a reduzir o custo de fazer negócio. Hoje em dia, um trader, com um grande número de clientes, tem dificuldade em gerir o tempo disponível, pois a informação necessária para análise é abundante ou até mesmo avassaladora. As novas propriedades do mercado digital, nomeadamente as relativas ao livro de ordens, permitem o uso de algoritmos que são uteis para automatizar certas tarefas no processo de negociação. Esta automatização pode melhorar a capacidade de gestão e a eficiência de um trader. Nesta tese fornecemos à plataforma de negociação Sifox, a capacidade de utilizar algoritmos. Analisámos os requisitos e as dificuldades de três algoritmos (TWAP, VWAP e POV), cuja função é a redução do impacto no mercado , e projectámos um protótipo que integrámos na aplicação Sifox. Durante o desenvolvimento, testámos para o algoritmo VWAP vários modelos de previsão de volume. Os melhores resultados obtidos foram com uma média exponencial pesada de onze dias para as acções da Google. Desenvolvemos o prototipo acrescentando estes resultados.exacarbate
Contents
Abstract ii
Resumo iii
List of Tables vi
List of Figures viii
1 Introduction 1
2 Investment Banking 4
2.1 Equities . . . 4
2.2 Financial markets . . . 5
2.3 Limit Order Book and Order Types . . . 7
3 Algorithmic Trading 10 3.1 Definition . . . 10 3.2 Architecture . . . 10 3.3 Trading Algorithms . . . 12 3.4 TWAP . . . 14 3.5 VWAP . . . 15 3.6 Participation Rate . . . 17 iv
3.7 Order placement strategy and Execution Probability . . . 19 3.8 Evaluation . . . 23 4 Prototype Development 25 4.1 Architecture Overview . . . 26 4.2 Algorithms . . . 28 4.2.1 TWAP . . . 29 4.2.2 Participation Rate . . . 31 4.2.3 VWAP . . . 32
4.3 Volume Profile Model Construction . . . 32
4.3.1 Data-set . . . 33 4.3.2 Tick Size. . . 34 4.3.3 Evaluation Method . . . 35 4.3.4 Models . . . 35 4.3.5 Results . . . 38 4.3.6 Integration . . . 38 5 Conclusion 42 5.1 Critical Discussion . . . 42 5.2 Future Work . . . 43 Bibliography 46 A Appendix 47 A.1 Acronyms . . . 47
A.2 Alpha calculation for EWMA . . . 48
A.3 Priority Queue Implementation . . . 48
List of Tables
4.1 Sample of volume profile construction from the data obtained via Google API. a) Data as received by the google API. b) Volume agregattion by Date, each tick has a size of 15 minutes, except the first and last ones. First and last tick correspond to close and open bid. c) Conversion to volume percentage. . . 34
4.2 Chi-Squared evaluation results applied to the three mean methods for volume profile calculation. The best result is presented in bold and bellongs to EWMA with 11 days. 38
A.1 Alpha value calculation. Results of the alpha value calculation process applied to 22 and 11 trading day data. The best values are shown in boldl. a) alpha range between 0 and 1. b) Calculations for α ± ∆ with alpha being the best obtained value and ∆ = 0.1 . c) Calculations for α ± ∆ with ∆ = 0.01.. . . 49
1.1 Photography of the New York Stock Exchange in 1959 (left) and 2005 (right). . . . 2
2.1 Structure of the financial markets as defined by [4]. The three main markets are the Money Market (short-term money loans) the Foreign Exchange Market (trading of foreign coin) and the Capital Market (long-term and mid-term trade of financial instruments).. . . 6
3.1 Algorithmic trading system components and their relations. The algorithms described here belong to the Trade Execution component. . . 11
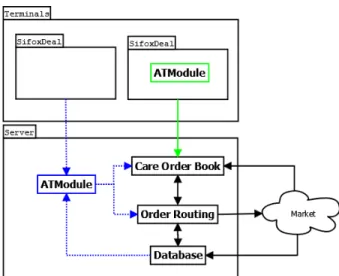
4.1 Algorithm Module placement alternatives on the Finantech solution. The dotted blue line represents the path taken when the module is in the server side. The green full line represents the module placement on the Client side directly on the SifoxDeal application. . . 26
4.2 UML diagram of the Algorithm Module implementation in the SifoxDeal application, focusing on the AlgorithmManager and Algorithm classes. . . 27
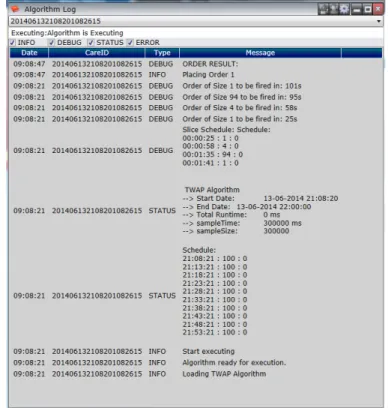
4.3 Screenshot displaying the Algorithm Log system. . . 29
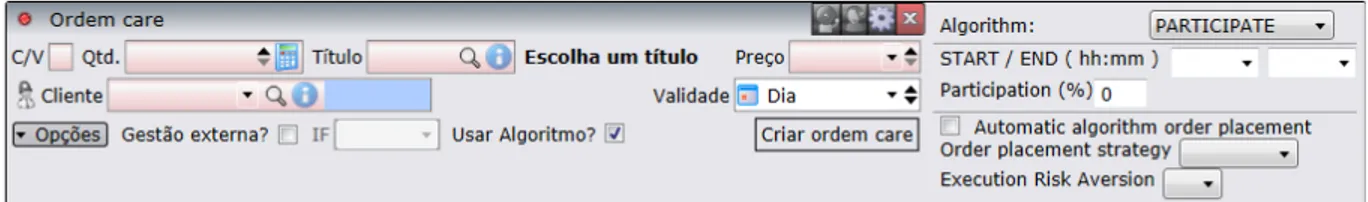
4.4 The GUI of the TWAP algorithm for order placement.. . . 29
4.5 The GUI of the POV algorithm for order placement. . . 31
4.6 The GUI of the VWAP algorithm for order placement.. . . 32 vii
LIST OF FIGURES viii
4.7 Intraday percentage of volume variation and the associated cumulative error from five consecutive days (19 to 25 February, GOOG stock). a) Intraday percentage of volume variation between five consecutive days in different time scales. The first and last tick are respectively the open and close. b) Cumulative error per tick size. The first and last tick are respectively the open and close. The error is calculated as the absolute difference between the points of all five consecutive days. . . 36
4.8 Description of the volume profile implementation. 1 - At the end of the trading period, intraday data is compiled and retrieved; 2 - The information is fed into the model and the volume profile is created and stored in the database; 3 - When an order is set for execution, the profile is retrieved; 4- Calculations are made to fit the profile in the current order time-span; . . . 39
Introduction
Men screaming and waving papers in their hands, shouting and receiving orders is the semi-romanticized view of the financial markets for a great number of people. Today, with the constant advances of technology, that image is getting further away from the truth. Although some of those men still persist, much of the trading has moved to the machine’s domain. Now in a exchange pit, the number of computers exceed those of humans (Fig. 1.1), and investing in stock is as easy as pointing and clicking with a mouse . But it isn’t only on the trading floor that the change had an impact, the market itself has changed. Markets thrive on information. There is a natural need to move goods to profitable markets, but the knowledge on which of those markets might be can lag behind, sending the product to a less profitable one1. It is stated by Stigler [28] that the price dispersion between markets is a measure of ignorance, taking this into consideration, it‘s no wonder that the development of information related technology has contributed for an increase of efficiency and productivity of the financial markets. As a past example of this relationship we have the introduction of the telegraph and the construction of the trans-Atlantic cable, which increased the speed and flow of information, having a huge effect on market price dispersion, narrowing it, making it more efficient [27]. These effects can only be exacerbated with the development of new technologies, driving the markets to a greater state of efficiency. A trader, that has been dependent on his world understanding and market insight to act and react to the exchange moves and whims, sees his efficiency threatened as the data availability and speed of information increases. Now, information that must be analyzed for a successful run at the market is abundant, even overwhelming, as news and market data grow bigger and become more readily available. Furthermore the development of communication technology and electronic access to the markets (DMA) allow for a growing number of investors to participate. These developments can reduce the efficiency of a trader in comparison to one that uses automated or
1
As stated in the Merchant’s Magazine, page 18 [1], “The products of the world, which, if left free to move naturally would be attracted to the most profitable markets, are frequently impelled towards unprofitable ones because the knowledge of which are the best ones becomes known in most cases only after the product has been shipped to an unprofitable one.”.
CHAPTER 1. INTRODUCTION 2
Figure 1.1: Photography of the New York Stock Exchange in 1959 (left) and 2005 (right).
semi-automated methods. The ability to create automation in some stages of the trading process greatly improves the reaction time of a trader, by processing and incorporating the information as it arrives and managing a growing number of accounts. This can increase the trader efficiency and profit margin. In the new electronic market, algorithmic trading is an essential tool for the trader and is widely used. In 2014 first quarter, algorithmic trading was responsible for 17 to 25% of the total market volume per month [25].
Finantech is a software development company producing solutions for the Portuguese financial markets [8]. Its products aim to fulfill the needs of financial institutions in all their market operations. Their main solution, the Sifox platform offers an integrated and wide array of services, ranging from the front and back-office to compliance and risk management services, facilitating the communication, management and execution of market operations. As at the time of this writing, the algorithm component they offer is restricted only to the interface, being the execution outsourced to online brokers. The lack of that particular service has an impact on the company. The use of third party services entails the loss of some control regarding the development process, as any alteration to their interface must be followed and implemented as quickly as possible. But more important than that loss of control is the issue of marketability. One thing is to market the application as having support to algorithmic trading via a third party interface (which is important), other is declaring the product implements algorithmic trading, bringing all the client needs to one place, the Sifox application. It‘s of strategic importance to Finantech the addition of algorithmic trading to its product portfolio. This addition will add value to its solution and help to further compete on the market.
Our objective in this internship consists in obtaining understanding of how the market operates and to develop a functioning prototype of an algorithmic trading platform into the Sifox solution, taking into account its already created infrastructure. We study the basics of financial market and,
through the analysis of our client needs and most wanted features we implement the most commonly used trading algorithms, allowing some space for customization.
In order to work with a system closely related to the financial market it is very important to understand its inner workings and vocabulary. This knowledge is not only essential for making informed decisions about the algorithms, but also to ease the communication of information in the company environment. In the second chapter we will briefly explain the inner workings of the financial market, getting into detail on information regarding order placement and order book management. In the proceeding chapter we will define algorithmic trading, describing its general architecture, the algorithm theories and evaluation methods. In section 4 we describe the technologies used to implement and integrate the algorithms in the system as well as details regarding the implementation of each different algorithm. We finally present some results for benchmark use for the presented algorithms, concluding with a critical consideration about this report and a description of future work.
Chapter 2
Investment Banking
2.1
Equities
A company that finds itself in need for capital, for whatever reason, has at its service a number of ways to fulfill that need. The money can be raised by going into debt, borrowing it from an entity (usually a bank) or by issuing bonds (debt issued by the company). The contraction of debt is not without cost. In debt financing with the money borrowed comes associated an interest rate that must be paid, raising the total amount of capital due in the short term and conditioning the refinancing of the institution. An alternative to entering in debt is to get funded by selling a part of the fixed assets of the company by issuing stocks, this is referred to as equity financing[3]. An equity (or more commonly known as stock or share) represents ownership and, the number of stocks one has, represents the percentage owned of the enterprise. The bigger the number of socks, more investment and consequently, more stake on the company. The equity term not only comprises the common stock, it can be also used to refer to the possibility of future acquisition of stock, like, for example, the case of options, warrants and stock convertible bonds.
A stockholder that invests his capital in the fixed assets by buying shares is given a limited partnership on the company. The limited participation is important, because it entails limited liability. In a limited liability partnership the shareholder is only responsible for the amount of money he invested. If there is the need for a liquidation because, for example a bankruptcy, the investor does not have to turn in personal property in order to cover the debts. The only capital lost is the investment money, that can be fully or partially regained if, after all the creditors have been paid, some assets remain. To own part of a company also grants some rights. Although the stockholder doesn’t have direct control over the company’s policies or strategies he can exert control via his voting right at the general meetings. This influence is limited to the election of board members and is restricted by the number of stock possessed. A minority shareholder has voting rights, but his participation is very
small compared to a major one. A shareholder is considered major if he owns more than 50% of the stocks, has more than one representative in the board of directors, or is he himself the director of the company. Other important consequence of owning part of a company through investment are the returns obtained. An investor will usually invest in a company he believes will bring him benefits, by generating future profits. There would be no point in investment and stocks if there were no possible returns on the investment made. A company is expected to provide returns for the investments made and the most direct representation of those returns is the dividends. The dividends are part of the profit attributed to the shareholders in proportion to the capital invested in the institution and its regulation is subject of company policy. A company is not obliged to pay dividends for various reasons, either because they need money for liquidity issues or growth strategies, nevertheless some kind of compensation is expected to be delivered to the investors, as well as an increase in dividends enough to cover the inflation over time. Because of these requirements, the dividends can also be seen as the cost of getting funded in a public offering. Comparatively with debt financing the potential cost in the long-term is greater, because of the increase in dividends amount over time, but this is easily offset by the various advantages provided, like the permanence of the capital, the low-risk of not being exposed to refinancing and the flexibility of deciding when and how to pay dividends. Companies may opt to give compensations to their shareholders in the form of their stock, by influencing its behavior and price. This can be an alternative to distribute dividends. The correct application of the profit money outside of dividends and management decisions can affect stock price and its market behavior, granting shareholders the option of obtaining returns on their investment by selling their shares to others, in the secondary market.
2.2
Financial markets
The financial market is the place where the trading of securities and commodities occur. It comprises a set of different markets, (as described in figure 2.1) each specialized in some instrument and with different defined rules. Generally, when we refer to the exchange or market, we are talking about the section of the capital market that handles equities, where the trading of stocks occur. This market is additionally divided in two sections: (1) the primary and, (2) secondary markets [4] . The primary market is where the issuing company goes to sell itself and get the investment cash, the investors trade money for shares and a promise of future returns1. After a stock is issued in the primary market is usually also available in the secondary market, the place where we will operate. In the secondary market shareholders trade with others having no interaction with the issuing company. This market is of extreme importance for the issuing company as the shares represented here reflect the health of the enterprise and its desirability to investors. A liquid secondary market with good conditions will allow investors to cash in their investment instantly and hopefully obtain returns, this adds to
1
CHAPTER 2. INVESTMENT BANKING 6
Figure 2.1: Structure of the financial markets as defined by [4]. The three main markets are the Money Market (short-term money loans) the Foreign Exchange Market (trading of foreign coin) and the Capital Market (long-term and mid-term trade of financial instruments).
the value of the investment, as the possibility to obtain great returns with ease will attract more partners. When we imagine the stock market, we are essentially envisioning the secondary market. These markets, present all around the world, are operated, managed and owned by private financial entities whose technology and services provide access and interaction with the exchanges. The most important financial services providers are the ICE group2, owner of the NYSE EURONEXT3, and the NASDAQ OMX group4. These companies manage the most important markets and provide access to intermediaries whose objective is to facilitate the meeting of buyers and sellers, the brokers.
The advancement of technology has changed the way trades take place in the market and how information is obtained. New technologies were quickly adopted and currently the most important exchanges operate almost entirely electronically, allowing us to access the market and place orders via online platforms[6]. The trades used to be processed by personnel on the trading floor, using the public outcry method, have moved to data centers, and most of the trades are now electronically matched5. It is important to understand the trading process and how the orders are matched in order to have insight on which strategies will work and their consequences.
2 https://www.theice.com 3 https://nyse.nyx.com 4 http://www.nasdaqomx.com/ 5
2.3
Limit Order Book and Order Types
Usually, in secondary markets, trades are based on an auctioning system and at its heart there is a limit order book, used to keep record of unfulfilled trades [12]. When the orders first arrive in the exchange, they are processed in a first-arrived-first-served (FIFO) fashion. Trades whose price immediately matches one existent on the book are processed, and the transaction information is disseminated through the exchange, while those with no matching price stay on the book. The unexecuted orders that constitute the limit order book will be either buy orders or sell orders. A buy order, or commonly referred to as a bid, consist of a price and a quantity one is willing to pay for shares of a certain company. A sell request, or ask order, is similar to a buy order, but represents the desire to offload stock. These orders exist in the book ordered by a specific set of rules, that will dictate the priority of transaction for these orders. At the moment of the arrival, the orders will be sorted by arrival price (price priority). On the top of the book there will be the orders with the best price. The best price is relative to the order type (buy or sell) and means the most competitive. A most competitive bid (buy request) is one with the highest price, a best ask is one with the lowest sell price. After price priority they will be ordered by arrival time. Having not been matched the two different request orders are separated by a gap, the difference between the best Ask and Bid, called the spread. In order for a transaction to happen, the spread must be beaten (the gap crossed) by the side who wants to make the trade. The orders contained in the book are not static and can be subject to constant and quick change. The owner of a order is able to cancel or edit it, but doing so will incur on priority penalty, as in practice the change is nothing more as the canceling and submitting of a new order. Although market orders are essentially restricted to those two sides (ask and bid) , the market execution conditions and validity parameters can be tweaked granting them different functionalities. The use of different order types depends heavily on the broker being used and their support on the exchange6. In order to have a good execution and achieve the desired result, it is essential for anyone that operates on the markets to have knowledge of the methods that will allow them to execute the chosen strategy.
The execution conditions available on most markets are the following:
• Limit Orders - An order with an imposed price limit. The order will stay visible on the limit order book until it is executed at the price limit or better. This type of order guarantees the price but does not guarantee execution, because the market can move away from the targeted price and never return.
• Market Orders - An order without price limit targeted at the best Bid/Ask price of the moment. This type of order suffers from the possibility of slippage, that is, the price targeted might not be the price sold. If our order is slower than another, we will possibly miss the Bid/Ask price
6
A difference can be seen between orders supported by the same group (ICE) in different equities markets, like Euronext [5] and NYSE [18].
CHAPTER 2. INVESTMENT BANKING 8
and get the order matched on the next available price. This slip of the target price can make one incur in great losses. As such, a Market Order does not guarantee the price and in high liquidity markets always guarantees fulfillment.
• Stop Orders - A Buy/Sell Market Order, triggered by a security reaching a certain price. When the selected trading equity reaches a prearranged price hit, a market order is sent. Usually this type of order is used by traders as a best practice, to stop losses by selling when a price drops too low7. In the first phase execution is not guaranteed, but when price triggers, it behaves like a Market Order with all its properties.
There is also the possibility for the creation of execution conditions that are variations of the above, or even the same, but because of their objective, they can get different denominations (like the Stop-Loss Orders). One that is quite used is the Limited Market Order (plus or minus one) this order is nothing more than a Limit Order with the price set to the current best bid/ask, having the possibility of being one tick above or bellow.
Other property of the order relative to the market is the validity. As the name suggests, validity is the span of time the order is considered as valid and is available for execution. The order validity which the Sifox application supports are the following8:
• Day Validity (DAY) - Order remains in the book until the end of the trading day.
• Fill and Kill / Immediate Or Cancel validity (FAK / IOC) - An order is sent, gets fulfilled as much as it can, then it is canceled.
• Fill or Kill (FOK) - The order is sent to the market to be fulfilled, if it cannot be fulfilled in its entirety, the order is canceled.
• Good Till Canceled (GTC) - Order stays in the book until fulfillment or a cancel order is issued (in EURONEXT up to a period of one year is supported).
The validity is combined with the order type, a side (buy/sell), a price (or no price, in case of a market order), a quantity and is sent to a specific market for matching and execution.
The execution and validity properties and how the book is organized, influence our order fulfillment and its execution costs, it will decide if our order will be executed, walk the book or simply stay visible
7
It is interesting to notice that while using a stop order to prevent losses (stop-loss) is considered to be a best trading practice (simply by obeying the rule of trading with limits), it can be responsible for major capital loss. A sudden fast market variation or a minor crash, can activate the price limit, and because the orders are placed autocratically and of the Market Orders type, the potential for slippage will be huge. Furthermore the Stop-Loss can exacerbate the impact of those fall even further, by causing a chain reaction and lower the price even more[24].
8Some of these validity types are defined by EURONEXT at
https://europeanequities.nyx.com/pt-pt/trading/order-validity using other denominations, for consistency with the system we will be using the Sifox Deal application
to all. The limit order book and its functioning is of pivotal importance to several strategies, its inner working is incorporated in most of the order placement strategies.
Chapter 3
Algorithmic Trading
3.1
Definition
The term is difficult to define, due to its confusion or interchangeable use with several other related terms. Generally, and the definition we adopt, algorithmic trading is the use of a computer program to create automation in one, or several, steps of the trading process. The definition given is very broad and usually the algorithms can be sub-categorized, depending on the technology used, objective or where in the traders pipeline the automation occurs. On the general definition of algorithmic trading we include the following sub-categories:
• Systematic Trading (ST) - Systems that use trading strategies based on a set of pre-defined rules received as Human input.
• High-frequency Trading (HTF) - The term is usually used in systems characterized with fast execution speed (in the order of milliseconds) and holding stock for a short time-span. Usually an HFT algorithm proceeds without the intervention of a Human.
It is important to note that the use of the Direct Market Access (DMA) or other online platforms, supplied by a lot of brokers, is not considered Algorithmic Trading. DMA is only a platform for electronic trading, allowing a more direct access to the markets, every decision and trade operation still has to be made by the trader.
3.2
Architecture
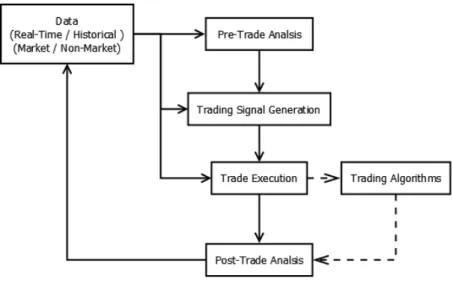
An algorithmic trading system can have several well defined components, each in charge of a specific aspect of the trading process [22]. The components are the data, pre-trade analysis, trading signal
Figure 3.1: Algorithmic trading system components and their relations. The algorithms described here belong to the Trade Execution component.
generation, trade execution and post-trade analysis (Figure 3.1).
The Data component interacts with all the other components and is the basis of the system. Its function is to gather and clean information retrieved from market or non-market sources. This is an important component, not only because it is used by every section of the system, but also because of the relationship between the performance of the system and the quality of the data. Due to the importance and dependency of the system on this component, all data obtained must be cleaned in order to treat wrong, incomplete and meaningless data that, if left untouched, can create noise capable of impairing the strategy used. In our algorithms the most common data source will be the market data, current and historical. However, there are systems that can use other non-related market data in order to produce market evaluations, like news, tweets and data obtained by mining social media sites.1
In pre-trade analysis, financial and derivative data (like news, or social media) are used in order to predict trends. These predictions will inform us what type of portfolio to build in order to trade and on which side of the trade we should be (buy or sell). Some of the techniques used to get a market prediction include fundamental analysis, technical analysis and quantitative analysis. Our system does not use pre-trade analysis due to its function being mainly execution support. The decision of what stock to trade and which algorithm to use comes from the trader and has no input from the system we are building.
1
Usually the type of data obtained via social media can be used as a trend indicator [23]. The use of this information raises growing concerns, as hacked accounts can disseminate false news with serious market repercutions. The blame usualy falls on the HFT that with its full automation and speed, lacking human constant supervision, judges bad data and acts accordingly [16].
CHAPTER 3. ALGORITHMIC TRADING 12
The trading signal generation component will place a value and a quantity on our chosen portfolio. This component usually uses information obtained in the pre-trade and apply other technical analysis techniques using relevant market data in order to obtain the expected goal, be it maximizing profits, minimizing trade costs or even developing an entry and exit strategy, as well as risk management. This component can be easily confused with the pre-trade analysis and the trade execution. Its main difference from the pre-trade analysis is that the decisions made can evolve to possible trades, it gives more concrete information that can be part of a strategy, and not just a recommendation on the selection of the portfolio. It diverges from trade execution by not actually executing or giving execution details for the trade, like a schedule.
The Trade execution layer will make decisions regarding the actual placement of orders in the market, that is, its execution strategy. Having received a quantity and a time frame, the component must read market conditions and create orders that fulfill a stated objective. Even if that requires dividing the orders, will never go against the previous component decisions. Trading venues, schedules, order types and order quantities are several options this component must decide.
Finally, in post-trade analysis, new information, obtained from the algorithm interaction with the market, is incorporated as new data in the application. This feedback will allow for strategies corrections and application control.
Giving the proposed architecture, and per our definition of a trading algorithm, the system must have at least two components, being the Data one of them. The algorithms we implement belong to the trade execution component, their main objective is to guarantee an efficient placement of the order. Our Data component is obtained through the Sifox application and data retrieved from specialized finance sites, like Google and Yahoo finance, in order to obtain historical values. We do not offer decision support tools, all the other components are the responsibility of the trader. It is he/she that will decide on what stock to trade, the venue, the signal, the quantity and the possible price limits to be used in the trading day.
3.3
Trading Algorithms
Currently all the major companies in investment banking offer algorithmic services packages to their clients. These packages usually consist of trade execution algorithms, that aim to facilitate trading and minimize trading costs for the client. The selection of the correct algorithm to fit a certain objective and market conditions is of extreme importance for a trader. The algorithms can be categorized according to their function[13] in the following manner:
• Impact-Driven - Minimize the impact of the trade on the market. Orders with big quantities can have a negative impact on the market, as its required quantity can be larger than the
number of orders offered at a certain price level, causing the order to “walk on book” and be fulfilled at increasingly worst market prices. In order to obtain a better trade for big blocks, this must be taken into account, and dispersion of quantity along the trading day should occur. • Cost-Driven - The objective of cost driven algorithms is to reduce the general cost of trading. They must take into consideration all factors that can influence the cost. Similar to the impact-driven algorithms, they must take into consideration market impact, but not to the point of avoiding it in its totality. If an impact to the market must be made to achieve a cost effective trade, they will proceed to act on it.
• Opportunistic - These algorithms want to obtain liquidity and trade in the best possible way, finding opportunities and taking them, disregarding market impact and trading cost to achieve their goal.
The characterization of the algorithms by their functions seems closely related to the mechanics they use to achieve their objectives. The following categories, proposed by Yang et al. [30], further divide the algorithms, helping to the understanding of their purpose based on their internal mechanics:
• Schedule-Driven - These algorithms follow a well known schedule, having no or very little variation. The use of a schedule allows for a predictable division of order quantity to be fulfilled in small intervals (from one hour to 5 minutes). In general, thanks to their schedule, these algorithms are the most passive and therefore are used to reduce market impact of large orders. Although they are regarded as passive algorithms, the sub-orders themselves can vary in aggressiveness. Depending on the trader objective and the risk one is willing to take, the actual placement of the orders can be different. For example, using market orders for aggressive strategies and limit orders when willing to take the risk. This mechanic is one that relates to the objective of impact-driven algorithms.
• Evaluative - A middle ground between schedule-driven and opportunistic. The Evaluative algorithms combine the two approaches. They try to obtain the best possible trade while reducing as much as possible the impact they have on the market. They can use historical data and quantitative analysis to figure out a schedule and incorporate real-time data in order to obtain the best cost. Balancing these two factors they try to achieve the best cost, the same objective as a cost-driven algorithm.
• Opportunistic - Dynamic aggressive algorithms that constantly react to market change trying to obtain the upper hand. These are usually the liquidity seeking algorithms, they take advantage of the market evolutions at real time. It has the same name as the previous categorization.
In a meeting we attended with Pedro Costa, BPI Investment Banking Manager, it came to our understanding that only a small set of algorithms is procured by their clients. The most commonly
CHAPTER 3. ALGORITHMIC TRADING 14
used algorithms are the impact-driven ones. We believe that this preference happens not only because they are specifically requested by clients who do not have sufficient knowledge to use more case specific algorithms, but also because they allow a trader to better manage orders with big quantities. This allows the traders to focus on orders that they deem more important, automating those less critical that otherwise would require constant monitoring. The most common used algorithms, and the one we will be focusing are:
• Participation Rate / POV (Participation Over Volume) • TWAP (Time-Weighted Average Price)
• VWAP (Volume-Weighted Average Price)
In order to obtain information of how the algorithms perform, and what parameters they take, we read several documents of algorithm implementation of the competition, available online. This information is, as expected, very superficial. The publications must disclose the strategy for the interest of the clients but at the same time, their inner workings have to be kept secret because of the competition. Still, these documents provided much needed insight in the principle of the algorithms, pointing out features that they should have and serving as a guideline to the trader concerns and what he/she was expecting.
We will now describe the algorithms one by one. Unless otherwise noted, all examples will be made as if we were selling securities. Usually buying and selling are symmetric when taking into account the algorithm strategy, they are not symmetric however in terms of order placement. In order placement the conditions of the market vary according to the side (buy or sell) we are on, so predictions and analysis believing the sides possess symmetry, can be wrong.
3.4
TWAP
TWAP is an impact-driven algorithm, whose purpose is to trade a block of stock over a period of time, causing the minimal amount of impact on the market [13]. To achieve this, the algorithm simply fractions the quantity of stock available in equal parts over a period of time, hoping to achieve a value as close as possible to the twap. The twap, as calculated using the formula 3.1, is the benchmark used to evaluate the quality of the algorithm execution. The objective is to have a twap value of our executed trades close to the market value.
T W AP =
P
P rice
N umber of T rades (3.1)
execution, depending of market conditions. It can suffer from serious signaling risk, by giving information of its operation. If we place orders of the same quantity at the same time interval we can fall prey of competitors that might be looking for patterns indicating the usage of this type of algorithms. This is a dangerous behavior, as an observer with that information can cause an unfavorable market movement, given that he now has information regarding our intentions and that gives him the upper hand in negotiating. Because of this risk there exists the need to mask our orders by not sending them at regular time intervals and with the same quantity. These alterations must not change in any way the algorithm behavior or disrupt its purpose. The actual order placement is also an important factor that must be taken into consideration. Just sending the order at market or limited price might not achieve the best price or targeted execution, by selecting a favorable order execution strategy we can improve the results and overall algorithm performance.
The schedule is generated by dispersing a given quantity per time, that does not however guarantee us the total execution of the order. The guarantee of execution is dependent on the strategy used. There is also the possibility of using order execution parameters that will interfere with the certainty of execution. If the parent order has a limiting price, the algorithm cannot override it, causing the non fulfillment of orders if the market trends away from us. We could use some kind of catch up logic, where we would accumulate the unexecuted volume and dispatch it at our earliest convenience in the next scheduled time. Using these kinds of strategies would go against the main theory behind the algorithm, as market impact would rise with increased quantity to be traded, causing a poor performance.
The parameters the algorithm needs are the quantity to trade and the price limit. The time-span of execution and other implementation parameters are optional.
3.5
VWAP
The VWAP algorithm, like TWAP, is also an impact-driven algorithm, thus making use of a schedule. Its use is to automate the trading of blocks equities in a passive manner, in order to have the minimum possible impact on the market [13]. In order to achieve the result, it will slice the order in quantities that are proportionally similar to the volume being made by the market. At the time-span defined by the algorithm, if the current stock volume being traded correspond to a percentage of the final total market volume, we want to mimic that percentage taking into account our own quantity. This algorithm strategy, as indicated by its name, is based on the vwap benchmark. This benchmark is widely used due to the fact of being considered unbiased in relation to other indicators that employ non-representative points (for example the twap). The VWAP achieves this by taking into consideration the weight a transaction has. A trade with a higher volume has more impact on the market volume, and therefore contributed more. The use of transaction weigh mitigates the effect
CHAPTER 3. ALGORITHMIC TRADING 16
that some prices, like closing time prices, have on the evaluation of the true trade value [2]. The formula is given by summing the multiplication of the traded shares volume (V ) at their respective price (P ), over a particular time (j) and then divide them by the total number of traded shares (P
jVj) to get the weighted mean (formula 3.2).
V W AP = P j(Vj× Pj) P jVj (3.2)
Any interval of time can be taken into account, but usually it is calculated from start to finish of the trading day. If we consider the VWAP the closest value to the fair price of a share, we can define the market impact cost of a transaction by comparing it to the trade we made. A trader top priority, while using this strategy, is to minimize the market impact so he will be considered successful if the trades he participates on that day give a market impact of exactly zero.2
M arket Impact Cost = V olume W eighted Average P rice − Buy P rice (3.3)
M arket Impact Cost = −V olume W eighted Average P rice + Sell P rice (3.4)
Looking at the formula previously described (3.3 and 3.4) in order to achieve the desired cost of zero market impact, in the best case, our prices must be equal to the VWAP or at least as close as possible. To get the closest possible value we would need to participate in each available trade exactly in proportion of our order relative to the final market value and at the same price value. This is not possible, because we do not know what is our order size relative to the final volume but, more importantly, we cannot know when will trades happen and their characteristics. Instead of this approach, it is shown by Kissel et al. [14], that the best strategy is, instead of considering all trades, to divide the trade period in slices and use the volume and average execution price of that period (formula3.5).
V W APj =
X
VjP¯j (3.5)
Assuming we can obtain the same average price of each slice, to approximate the value is to find the slices that minimize the difference between the VWAP benchmark and our average execution price. The solution is to participate in proportion with the orders in each slice. In order to do that we must find beforehand which percentage of the final volume each slice will have so we can divide the
2If a trader is truly concerned about market impact he will want the trades to be inline with the vwap benchmark. In
practice hovever that might not be true, as a positive market impact means also that the trades where better than average.
order quantity and proceed with the schedule.
As expected, the final volume is only known at the end of the trading period, which is a problem. By the time we know for certain the value of the final traded volume, all trades in which we wanted to participate will be over and we have missed our opportunity. We can try to predict the final volume of that day, but by doing so, we would incur on errors. The prediction of just one value, that is quite volatile among trading days, would not give us any reliable information on how the trade volume progresses along the day. Instead we will believe that the volume follows a pattern in relation to its final volume and its variation is of no consequence. For example, it is known that the volume of certain equities is not random but follows a pattern achieving peaks at the open and close time. There is also the possibility that, in some markets, the volume at the time of the opening hours of other exchanges can induce on volume variation. By observing this effects using historical intraday data we can create a volume profile of the stock which the algorithm will use to create the schedule.
3.6
Participation Rate
Also known as Participation Over Volume (POV), the participation algorithm aims to fulfill a percentage of the market traded volume [13]. POV is an impact-driven algorithm, its purpose is to reduce market impact by trading inline with the volume. The algorithm monitors the quantity of all the trades executed, since the order submission start date, and calculates how many stock it has to trade in order to keep close to a chosen target percentage of that volume. This may categorize the algorithm as an evaluative one, taking into consideration that it reacts to the market, but it is really schedule-driven, the schedule is dynamic and only known at the time a trade is executed but is predictable. In its simpler form and assuming that the market is liquid enough to support it, this algorithm guarantees complete execution. In practice though that will not be the case, thanks to the restrictions we must enforce to ensure a safe execution.
In order to participate a volume according to the target value, we cannot just place an order containing the percentage needed for volume completion. If we reacted to a trade that just occurred with an order quantity of exactly the needed to obtain the participation target number we would fail, because in the next instant the total volume has changed by an amount equal to our order placement. To avoid that situation, we need to offset our quantity placed according to the impact we will have on the market. In case we fail to do so, the algorithm will be always a step behind, and a cycle can form, never achieving stabilization. We must participate in the desired quantity as defined by formula 3.6.
Quantity = V olume ∗ P articipation T arget
1 − P articipation T arget (3.6) As with TWAP the POV algorithm is subjected to signaling risk, having the risk a particularly
CHAPTER 3. ALGORITHMIC TRADING 18
stronger impact [17] causing the algorithm to be easily manipulated. Every time a trade occurs if the algorithm rushes to place an order a pattern can arise. A competitor could easily use this information, and our performance could drop. Other issue that could hinder our performance is the competition between algorithms of the same type. If we had two or more of the same algorithms running, they would compete with eachother, tying to fill their order volume as fast as possible. In this case once one completes a trade, the other has to issue more orders, because the market volume has changed. If the order book has enough orders and the order prices are not limited, the performance of both algorithms would decrease quickly. To prevent these actions we must regulate the order placement, trading more periodically with the volume by adding a deviation to the target percentage. By allowing the algorithm to incur in taking the percentage with error, we can either get ahead or behind the target value, and plan the placement of our order. This would also allow an increase in options for our algorithm by creating a parameter regarding the aggressiveness of execution, that would define how closely we would track the target values. Having this margin for execution we could even propose the placement of orders outside of the schedule in order to do opportunistic trades. Of course if the market is liquid enough this behavior might not be necessary, we will not have problems in signaling a Human competitor if a huge amount of different trades are happening in the market, but still, we can fall prey to proprietary algorithms.
Apart from measures against the signaling risk we will also need safeguards to guarantee the performance does not degrade to an unsuportable state, incurring in possible big losses. Volume spikes can degrade our execution and should be taken into account. A large spike will degrade the prices on the order book by taking away liquidity and may force the drop of orders on the book to an unfavorable state. Tracking the volume closely would exacerbate the problem, because after the spike we would go to the market and force execution, getting the worst deal. This can be solved by not tracking closely the value, ignoring the volume spike or by placing a limit price on our orders. With this measure we would gain better execution but at the expense of order completion and depending on the trader objective, this could be desirable or not.
The price limit is a parameter of the algorithm and can be used to counter volume spikes, by limiting our entrance in bad trades, but can also create those spikes and force a possible non-completion of the algorithm. If we place a price limit and the security market value drops under it, the algorithm cannot place orders that go against that value. If we continue monitoring the volume while the price is against the limit, after the recovery the algorithm will find itself with a lot of ground to cover and will be overly aggressive in order to maintain the target value. This spike can be prevented if the trades made bellow the limit value are ignored, not being counted for the final total volume. An alternative is to use future prediction and start compensating pre trade, fulfilling more quantity than that needed to achieve the target percentage, when we know the price will go under our limit value, or even use a smoother catch up logic. The catch up logic has the same issues the TWAP had regarding market impact, but we can support it if market conditions regarding liquidity allows for an
increase of small volume traded without severe market impact.
3.7
Order placement strategy and Execution Probability
An aspect that must be taken into account by all algorithms is the placement strategy. The schedule will dictate how the algorithm should divide its orders to achieve its objective, the placement strategy is responsible for the actual placement of the order on the market. It assigns a price and decides which order type it should have. This strategy is of paramount importance to our module because it will have direct influence on how well the algorithm performs on the short term, aiming to minimize the transaction cost. The cost we are willing to pay, the transaction cost, is directly related to our ability to execute our order in the required time-frame. When we want a guaranteed transaction, we are sure that will be completed in an arbitrary time-frame, we have to pay an increasing price. By putting our order with a more desirable price we will incur in a loss, but because of the properties of the limit order book, our order will be closer to the top of the queue (if it is a sell order, lowering the price will make it more desirable for the buy). If the market trends in the opposite direction we will have to change our order so it can follow it. By doing so we are trading the execution for profit, as our order will have to be cancelled and submitted at a new worse price. By going long (holding our stock and placing it at a more favorable price) we are trading guarantee of execution for price. This is exacerbated if the time we have to dispatch the order is limited and small. If we have some information that will benefit us, or a tight schedule to follow, being able to comply with the time constraint is important, we will not only want to guarantee execution but also do it in the allotted time period. This reduces our option for waiting for a better situation, meaning we will have to manage the execution risk that can impact the execution cost. A more desirable order for the market, one that has the most competitive price, will have priority on the book and be more quickly executed. In an unpredictable market, changing the position on the order book might not be enough, the price can trend in an opposite direction, leaving us behind. We may add to the cost in order to guarantee immediate execution. The extra cost we must pay is the spread. By paying to go over the spread we will directly consume an order at the current worst possible price, because we had to actively press forward and make the transaction. We can pay this cost by submitting a market order. This cost however can be bigger if we allow for slippage to occur. If our order arrives later than other concurrent orders, we might fail the price we thought it would be achieved at the moment of submission, and instead get a worse (or better) one. In short, its a dilemma, a trader must juggle the execution timing and price, paying more for fulfillment or waiting and possibly achieve a better price.
The algorithms will have to manage these options at the order placement moment and they will base their decision depending on the objective (guaranteed execution or best price) defined by the parameters submitted by the user. Please note that order placement strategy is not to be mistaken for the algorithm strategy. The strategy of the algorithms answers the questions before the
CHAPTER 3. ALGORITHMIC TRADING 20
order placement “How much quantity should my orders have?” and “What time should I place it?”. Questions such as “How much should the order be priced, in order to guarantee the best relation between price and execution time?” is part of the order placement strategy. The placement strategy can be based on the notion of probability of execution.
The Execution Probability indicates the likelihood of an order placed at time t with price p be executed in the t + 1 instant. The analysis of the trader objective is an important consideration to have, as it influences the strategy to be used. Harris [11] defines three stylized trading problems, focusing on small volumes ( due to market impact problems ), that represent the diferent trader objectives. The small volume restriction is on importance to us, as the algorithm scheduling handles that particular problem by negating the quantity impact on the market. We can consider that order submissions do not affect the market. The three trading problems are the following:
• Liquidity Traders (LT) - These traders need to fulfill an order before a deadline is reached. They will try to obtain the best possible price but their priority is guarantee the order is executed. Usually they start working the market in a passive fashion, but as the deadline approaches they take a more aggressive stance.
• Informed Trader (IT) - An Informed Trader has private information about price changes and believe that that information will soon be available to everyone. They have time constraints, as they need to react quickly, in order to profit from their information. Unlike the Liquidity Traders they are not obliged to trade before the deadline and will only trade if it is profitable. • Value-Motivated Traders (VT) - A Value-Motivated Trader is always receiving private information of security values. Usually they are continually estimating the value of the securities they follow, and need immediate execution if they believe an abrupt price change will happen, otherwise they will place limit orders and try profiting from pricing errors. Unlike Informed Traders, they have continuous price information and are not constrained by a deadline.
The order placement strategy that will be used on the algorithms have all the qualities to be related to the first type, it is a problem regarding the Liquidity Traders. After having a schedule, our primary objective is to dispatch the orders with the best available price in the most swift manner, until the given due date, as a liquidity trader would require. Furthermore, the algorithm is somewhat obliged to trade, preventing it to belong to the other types, due to the promise of execution that it offers to the trader. If a trade is not made, the quantity of unfulfilled orders can accumulate, damaging the defined schedule and the intended objective of reduced market impact.
In the literature there are several strategies that use some specific market indicators ( such as volume, book imbalance, book depth) in order to get insight on order placement. Yingsaeree [31] further divides these strategies in static or dynamic types. The Dynamic type possesses the ability of monitoring the placed orders and changes them as it pleases (taking into account the properties
of the limit order book). The Static types only allow one shot orders, having no ability to change them. Simply because our order book can use dynamic order strategies, this does not mean that the static types should be neglected as information contained in them can be useful, furthermore, the implementation of dynamic orders may prove a challenge taking into account the infrastructure of the SifoxDeal application and the available data. The small time-span for order execution, obtained from the schedule of the algorithms may also cause the unavailability of dynamic order. Dynamically altering orders requires time, for the editing of orders, communication and analysis of factors, time that in a tight schedule will not be available. Also, once the order changes, it goes back to the bottom of the queue for the same price range further limiting the execution time. As such the static option can be the only option for some order placement.
Handa and Schwartz [10] investigate the use of market and limit orders as a strategy. They conclude that using limit orders is detrimental if the market only reacts to information and there is no market imbalance. An uninformed trader will loose by placing limit orders (when competing with informed traders). However, if there is enough market orders causing market imbalance, moving the price to reach the limit order value, there will be a gain. In case of order non-execution the following two options are given: not execute or execute at the end of trading period at closing price. The second option will result in an additional cost, the cost of exchanging a limit order into a market order. They conclude that patient traders, those that are willing to wait are the ones that will benefit the most from the placement of limit orders and that there is not a big turnover difference between using market or limit orders. We can use this information by only placing limit orders when the market has enough market orders, reflected on volatility and number of trades, to catch our limit orders in our allotted time interval. It is also of our interest as we predicted, to not execute the orders at the end of the closing period to force their execution, for the non-execution cost produces worst results than the limit orders. This however indicates that simply using a market order could be enough. From our observations this would not be the case or sufficient. For example in the VWAP algorithm we must guarantee the mean price, or better, in order for the execution to be more successful. By using more information we might be able to hit a sweet spot with the limit order, achieving the best cost/execution tradeoff.
Nevnvaka et al. [19] combine market orders with limit orders to obtain a better execution, somewhat contradicting Handa and Schwartz [10] findings. They propose using a risk-return curve based on historical data capable of finding the efficient pricing frontier. The return graph will indicate how far to place an order in order to achieve the least execution price. The risk profile (being the risk of non-execution, mid-spread volatility and volume volatility combined by defined it as the standard deviation of returns) , indicates the risk of non-execution, the more we hide on the book the higher the risk. Combining these two profiles we get a curve that relates risk and the return. With it we can choose a strategy by picking price improvement or risk. In this case the risk (non-execution) is a more important factor due to the type of problem we are trying to solve (Liquidity Trader). Some
CHAPTER 3. ALGORITHMIC TRADING 22
considerations need to be taken into account regarding some variables in this process, that can be controlled in order to achieve better performance of this model. It is indicated that special care must be given to Order Size, Time of the Day, Time Window and Market Conditions. Big order sizes force the orders to be more aggressive in order to complete. This will not be an issue with the algorithms since the schedule they do is exactly for the restriction of big orders. The time window available for order completion changes considerably this approach [19]. A small time window means less time for the market to hit our limit order, while a large one gives more time for that to happen. Taking into account market properties and with a small time window we might be more successful if the order is placed directly on the market. Time of day can influence the order speed due to the variations of volume and should be considered if the trading period is long. The trading volume, and volatility are the most important factors of the market conditions, and our model data should be constructed with these values in mind. Concluding the article the authors point out that this approach can be a generalization and the optimal strategy can change over time, where we must reevaluate the pricing strategy. It is proposed the creation of a function that using the described elements will produce our limit distance. We can use the ideas on this article to create a risk-return and use this to express the probability of execution, attributing an option to our placement strategy that will enable the trader to change the risk parameters for the placement strategy.
There is the idea that if the book permits order adjustment, its use will make for better results. By altering a limit order we can place it in a more favorable position, hence beating the price of a static limit order. Furthermore, in the current electronic market, there is the potential of more information being available that can allow for a better execution [20]. Before the only available information was the best bid / ask, and the price of the executed trades, now with eletronic trading, we have access to more details of the book, capable of seeing the outstanding limit orders and their parameters, in any depth. The incorporation of these new variables allied with dynamic order adjustment can improve performance on the algorithms. Wang and Zang [29] propose a dynamic focus strategy (DF), adjusting the volume of market orders by monitoring one of two parameters, the inventory unexecuted volume or the order book imbalance. For quantitative analysis they propose a formula based on a sigmoid function that reacts to those parameters taking into account the remaining time. They claim that the method can also be applied to limit orders in order to achieve better performance. Taking into account that order book imbalance offers very little performance improvement [20] and is seen as a future trading cost predictor, the inventory DF strategy is best suited for the algorithms described. In our work we incorporated some of these ideas when developing the order placement strategy that will be common to all algorithms. In our opinion, the order placement is the most relevant part in the trading system, as this is the one that will define the losses and profits, therefore it is the part that should receive more attention and be allocated more resourses. If we manage to find a method that reduces transaction cost, independent of the algorithm used, the overall performance can greatly increase and we can also provide more options for a trader. To demonstrate further the importance of
the order execution we reefer to the documentation provided by companies that provide algorithmic solutions. In their documentation, the description of the algorithm is guarded. The trader knows what type of algorithm is (the scheduling principle is usually common knowledge) and to what extent the option they input alter the execution, but the actual order strategy is never shown or even hinted. Usually their order placement strategy is marketed as a new and better special system and is followed by graphical plots of execution performance as proof of their worth. This is the core and one of the best kept secrets of the trade execution section of algorithmic trading (Fig. 3.1).
3.8
Evaluation
It is not in the scope of this report to compare the algorithms among themselves. It is not useful to know if one algorithm provides better results than other, for some market conditions, but we do require to know , among the variations of our implementation, which one obtains better performance. This introduces the problem of defining what is the best algorithm and how do we proceed to compare their variations. Usually we evaluate an algorithm by determining the amount of resources, in terms of time and space, required for its execution. It this case however we are less interested on performing complexity analysis and more focused on measuring the quality of the solution. It is easy to make the mistake of thinking that different algorithms try to achieve different objectives, that their schedules are created in a specific form and that they try to solve slightly different kinds of problems. A trader that uses the POV algorithm might be looking to end the day with a percentage of the volume, but the theory behind the algorithm operation is not concerned to obtaining that percentage as its ultimate goal. The algorithm uses the percentage as a means to an end, because it theorizes that by following the schedule provided it will achieve better results on its trades, by reducing market impact. In reality the algorithms share the same ultimate price driven objective: profit [26]. They use different tactics specific to different market situations to try to consistently achieve good returns while minimizing the risk. In this case the profits obtained are the result of two components of the algorithm, the schedule calculation and the order placement strategy.
In trading, each day is different from the previous one and the decisions are made as the orders arrive on the market. This makes testing the algorithms a dificult problem, as they can be seen as belonging to the online algorithms class. By definition an online algorithm is an algorithm that receives a sequence data as discrete pieces and has no prior knowledge of the contents of the next piece. Decisions must be made as new information is received and this constitutes a problem if an optimization is to be made, due to the lack of details about the future. These types of algorithms contrast with the offline algorithm variety, which have access to the whole information in one go, allowing them to make better decisions. In algorithmic trading, although some information regarding future patterns can be obtained, the data received in order to make decisions is provenient from the market intraday movements, which are known to be unpredictable to a certain degree. One of the
CHAPTER 3. ALGORITHMIC TRADING 24
ways to analyze online algorithms is by means of competitive analysis. By comparing the algorithm to an optimal offline counterpart (the same algorithm with access to the full data and knowledge of it) we can obtain a measure of the quality between the optimal, offline solution, and the online solution. Since we use a quantitative metric based on the returns obtained, we do not need to do a comparison with the optimal solution, to determine which variation performs best. However, doing a comparison against an optimal solution can give us a basis point to compare how well the algorithms perform in general.
Ideally, we would test our algorithms in the real live market, but that is risky and unwise. The advantage of doing such a test would be the unpredictability and our impact on the market would be felt and considered for evaluation, the disadvantage would be the possible loss of capital. So in order to test the algorithms we must use historical data, which will be suboptimal as the market impact that we will induce will not be accountable.
![Figure 2.1: Structure of the financial markets as defined by [4]. The three main markets are the Money Market (short-term money loans) the Foreign Exchange Market (trading of foreign coin) and the Capital Market (long-term and mid-term trade of financial i](https://thumb-eu.123doks.com/thumbv2/123dok_br/15670374.1061789/16.918.126.790.149.413/figure-structure-financial-markets-foreign-exchange-capital-financial.webp)