Sandra Sofia Mota Rodrigues
Development of chemo-sensing schemes based on
analyte-triggered modulation of CdTe quantum
dots photoluminescence for analytical purposes
Tese do 3º Ciclo de Estudos Conducente ao Grau de Doutoramento em Ciências Farmacêuticas na Especialidade de Nanotecnologias
Trabalho realizado sob a orientação do Professor Doutor João Luís Machado dos Santos e co-orientação do Professor Doutor José Luís Fontes da Costa Lima
É autorizada a reprodução integral desta tese apenas para efeitos de investigação, mediante declaração escrita do interessado, que a tal se compromete.
“Most people say that it is the intellect which makes a great scientist. They are
wrong: it is character.”
Pai,
Mãe,
Ana,
Inês,
João Pedro,
Lúcio.
… não posso (nem consigo) encerrar este capítulo da minha vida sem lembrar algumas pessoas que me ajudaram a ser feliz!
Ao Professor Doutor José Luís Costa Lima, agradeço a oportunidade pelo facto de poder fazer parte do Laboratório de Química Aplicada. O seu acolhimento único e a sua exigência de qualidade fazem com que me sinta uma privilegiada por ter integrado a sua equipa de investigação.
Ao meu “mestre” (des)orientadr, Professor Doutor João Santos, pelo apoio transmitido e interesse demonstrado, bem como pelas críticas detalhadas e sugestões essenciais à consecução deste projeto. O trabalho aqui apresentado só foi possível conjugando as suas (muitas) experiências, argumentações, opiniões, conhecimentos e visões complementares. Agradeço também a confiança, disponibilidade, simpatia e a boa disposição, sempre demonstradas.
MUITO OBRIGADA por me ter aceite como sua aluna de doutoramento! Pupila
Ao Professor Doutor Leonardo Teixeira (UFBA) agradeço a disponibilidade e preciosa contribuição para a concretização do trabalho realizado no Brasil.
Aos restantes Professores do Laboratório de Química Aplicada, pela sua amabilidade, simpatia e recetividade. Ao Professor Doutor Rui Lapa deixo um agradecimento particular pela atenção que teve para comigo desde o primeiro contacto e, também, pela sua simpatia, amabilidade e ajuda.
Ao David Ribeiro,…
… MERCI BEAUCOUP MON AMI!
Sem a tua ajuda esta tese não teria sido a mesma coisa ! ………….. OBRIGADA! MUITO OBRIGADA!
À D. Manuela, pela simpatia e disponibilidade que sempre demonstrou.
OBRIGADA por tudo amiguinhas!
Sei que caminharam constantemente ao meu lado e estiveram sempre presentes para o melhor e para o … “menos bom”. Amigas do passado, presente e futuro um muito obrigada por TUDO! Estarão sempre nas minhas reminiscências e na minha vida.
A todos os colegas do laboratório pela forte solidariedade com que me acolheram e me têm continuamente encorajado a seguir em frente. Muito obrigada por todo o apoio e incentivo
À Lucía (Benjamin mucho), Adriana (Pirinha) e Andreia, amigas além-fronteiras, obrigada pela cumplicidade, pela partilha de confidências, pelo carinho, pela força e ânimo e pela amizade que se manterá, mesmo que os nossos caminhos se separem.
A todas as pessoas que passaram e deixaram uma palavra de conforto, esperança, sabedoria e energia.
Agradeço à Faculdade de Farmácia da Universidade do Porto o facto de me ter admitido como estudante de doutoramento, disponibilizando todos os meios necessários para a realização deste trabalho. Agradeço, também, à Fundação para a Ciência e a Tecnologia (FCT) pelo suporte financeiro referente à bolsa de doutoramento com referência SFRH/BD/70444/2010, no âmbito do “QREN e POPH e Tipologia 4.1 e Formação Avançada”, co-financiado pelo Fundo Social Europeu e por fundos nacionais do MCTES.
Aos meus pais e à minha maninha Ana, com os quais aprendi a viver com energia, entusiasmo e empatia, agradeço o carinho, amor, estímulo e apoio incondicional em todas as fases da minha vida. Ao Anselmo! Obrigada pela paciência e por suportarem tantas ausências físicas! Um beijinho muito ternurento para a Loloi que é uma “avó” muito especial!
Aos meus biscoitinhos mais lindos do mundo,
Ao Lúcio!
Por ontem, por hoje e por SEMPRE!
Obrigada por me encorajares a “correr” atrás dos sonhos! Obrigada por nunca me deixares desistir!
Obrigada por confiares e acreditares em mim! Obrigada por estares sempre comigo!
ADA
Acredito que se quiser ser justa, terei que agradecer a todos os que atravessaram o meu caminho.
“When one is blessed with too many people to thank, one should thank God!”
Colloidal semiconductor nanocrystals or quantum dots (QDs) are monodisperse crystalline clusters with physical dimensions in the nanometer scale. Due to their unique size-dependent photochemical properties, the research on colloidal semiconductor nanocrystals has experienced an enormous development in different fields such as in pharmaceutical, biomedical and environmental detection and monitoring.
Several QDs with assorted compositions have been synthesized in recent years, and the diversity of capping-ligands that were used enabled the application of these nanomaterials both in aqueous and organic medium. In this work, and among the several physical and chemical processes that could be employed in the preparation of semiconductor nanocrystallites, the aqueous synthesis of cadmium telluride (CdTe) QDs was selected, as it allowed obtaining nanoparticles with narrow size distribution, broad absorption, narrow and symmetric emission spectra and long excited-state decay lifetimes. In addition, short-chain aqueous thiols were used as passivating agents providing highly luminescent QDs with a flexible surface chemistry and diversified reactivity to interact with selected target species.
QDs have been introduced in analytical areas mostly as chemical sensors in fluorescence-based methodologies. In this thesis, the analytical potential of nanoparticles was exploited through the manipulation of their surface chemistry by changing the nanocrystal size and the nature of the passivating agents. Because of the small size and high surface-to-volume ratio of the nanoparticles, their surface becomes sensitive to any modification of the surrounding medium or interaction with a target analyte, which could dictate important changes on the nanoparticles photoluminescence intensity, either via enhancing or quenching processes.
The first work of the thesis reported an effective and simple quantification method for the fluorometric determination of iron in biodiesel, by using CdTe quantum dots capped with MPA. The developed methodology was based on the iron capacity to establish surface interactions with the nanocrystals that resulted in a quenching of the fluorescence intensity. The study of the interaction between the MPA-capped QDs and iron was performed by using a discrete batch approach that relied on both manual handling of all involved solutions and manual sample measurements.
Since the implementation of a sensing scheme, involving the interaction of QDs with a target analyte, in a batch method could present noteworthy shortcomings, such as a higher consumption of solutions, poorer reproducibility and repeatability, a propensity to inaccuracy setbacks and the need for laborious and time-consuming manual operations, the development of more expeditious and reliable alternatives becomes an imperative assignment. Moreover, under this perspective it should be also taken into consideration that the need for long-lasting chemical equilibrium conditions, usually required for obtaining stable photoluminescence readouts, is frequently affected by
versatility, sensitivity and applicability afforded by CdTe QDs was successfully combined with the high automation level of flow-based methods. This synergy was favourably exploited in the remained works which involved the determination of H2O2, S2- and Ca2+ in different kinds of samples.In all of
the subsequently developed automatic methods, which resorted to fluorometric detection, were used analytical flow system based on the multipumping flow concept. This flow strategy provided noteworthy advantages, such as operational simplicity, high compactness and portability, pulsed flowing streams with high mixing capacity, reduced sample and reagent consumptions, minimization of waste generation, cost-effectiveness, versatility and high analytical efficiency.
In the second research work, a QDs based automatic flow methodology was developed for H2O2
determination in lens care solutions. The reaction scheme involved, in a first stage, the enhancement of the properties of CdTe nanocrystals by reduced glutathione, which improved the surface passivation of the nanoparticles. Afterwards, H2O2 oxidized GSH and, consequently, by
preventing its surface passivating effect, restrained the enhancing effect.
In a ensuing research phase of the developed work, a gas-diffusion unit coupled to a multipumping flow system was proposed for the selective determination of sulphide in white wines and hydrothermal waters. The gas-diffusion unit ensured the selectivity of the methodology since it facilitated sulphide isolation from sample matrix interferences while MPA-capped CdTe QDs were used as photoluminescent probes. The analytical methodology was based on interaction between S2- and QDs which provoked a quenching of the nanoparticles fluorescence.
Another analytical application of this project involved the automation of the experimental studies used to evaluate the interaction between EDTA and TGA-capped CdTe QDs, which was later applied in the automated fluorometric determination of calcium ions in drinking waters. The determination of Ca2+ was based on the monitoring of the enhancement of the QDs fluorescence
previously quenched upon interaction with EDTA, in aqueous solution.
Finally, and again under the objectives that were pursued by this thesis, distinct immobilization strategies onto solid support, both by physical and chemical processes, were evaluated. This research seeks to reduce the harmful environmental impact associated to the metallic core of the nanoparticles. The study comprised solid supports with distinct characteristics and involved the evaluation of several chemical and physical parameters, aiming at obtaining the more suitable immobilized material for the development of continuous multiuse reactors and re-usable sensors, for analytical purposes.
Keywords: CdTe quantum dots, multipumping flow system, chemo-sensors, photoluminescence
Os nanocristais semicondutores coloidais ou pontos quânticos (QDs) são aglomerados cristalinos monodispersos com dimensões nanométricas. Devido às suas propriedades fotoquímicas únicas e dependentes do tamanho, a investigação acerca dos nanocristais coloidais semicondutores apresentou um enorme desenvolvimento em diferentes áreas, tais como na indústria farmacêutica e na deteção e monitorização biomédica e ambiental.
Nos últimos anos, diversos QDs, com diferentes composições, têm sido sintetizados e a diversidade de ligandos que foram usados permitiu a aplicação destes nanomateriais tanto em meio aquoso como em meio orgânico. Neste trabalho, entre os vários processos físicos e químicos que podem ser usados na preparação de nanocristais semicondutores, foi selecionada a síntese aquosa de QDs de telureto de cádmio (CdTe), uma vez que permitiu a obtenção de nanopartículas com uma distribuição de tamanhos estreita, amplas bandas de absorção, espectros de emissão estreitos e simétricos e elevados tempos de semi-vida. Além disso, foram utilizados compostos orgânicos aquosos de cadeia curta com grupos tióis, como agentes passivantes, proporcionando QDs altamente luminescentes com uma química de superfície flexível e reatividade diversificada para interagir com espécies selecionadas.
Os QDs têm sido introduzidos em áreas analíticas principalmente como sensores químicos em metodologias baseadas em fluorescência. Nesta tese, o potencial analítico das nanopartículas foi explorado através da manipulação da sua química de superfície, alterando o seu tamanho e a natureza dos agentes passivantes. Devido ao seu reduzido tamanho e à elevada razão superfície- volume, a sua superfície torna-se sensível a qualquer modificação do meio circundante ou à interação com um determinado analito, o que pode provocar alterações significativas na intensidade de fotoluminescência das nanopartículas, quer através de processos de aumento ou inibição.
O primeiro trabalho desta tese relatou um método de quantificação simples e eficaz para a determinação fluorométrica de ferro em biodiesel, usando pontos quânticos de CdTe passivados com MPA. A metodologia desenvolvida baseou-se na capacidade do ferro interagir com os nanocristais na sua superfície, o que resultou numa inibição da intensidade de fluorescência. O estudo da interação entre os QDs de MPA e o ferro foi realizado utilizando uma abordagem discreta que implica a manipulação manual de todas as soluções envolvidas assim como medições manuais das amostras. Uma vez que a implementação de esquemas reacionais num método discreto, envolvendo a interação de QDs com um determinado analito, pode apresentar algumas desvantagens, tais como maior consumo de soluções, fraca reprodutibilidade e repetibilidade, tendência para imprecisões e necessidade de operações manuais laboriosas e morosas, torna-se fundamental desenvolver alternativas mais expeditas e confiáveis. Além disso, deve-se também ter em consideração que a necessidade de condições de equilíbrio químico duradouras, geralmente necessárias para a obtenção de leituras de fotoluminescência estáveis, é frequentemente afetada por problemas de estabilidade das soluções das nanopartículas, o que pode
pelos QDs de CdTe foi combinada com o elevado nível de automatização dos métodos baseadas em fluxo. Esta sinergia foi explorada favoravelmente nos trabalhos que envolveram a determinação de H2O2,
S2- e Ca2+ em diferentes tipos de amostras. Em todos os métodos automáticos posteriormente
desenvolvidos, os quais recorreram à deteção fluorométrica, foram usados sistemas de fluxo baseados no conceito de multi-impulsão. Esta estratégia de fluxo apresentou notáveis vantagens, tais como simplicidade operacional, elevada compacidade e portabilidade, fluxos pulsados com elevada capacidade de mistura, reduzidos consumos de amostra e reagente, minimização da geração de resíduos, relação qualidade/preço, versatilidade e alta eficiência analítica.
No segundo trabalho de investigação, foi desenvolvida uma metodologia de fluxo automático baseada em QDs para determinação de H2O2 em soluções para limpeza de lentes de contacto. O esquema reacional
envolveu, numa primeira fase, o aumento das propriedades fotoluminescentes dos nanocristais de CdTe através da glutationa reduzida, a qual melhorou a passivação da superfície das nanopartículas. Em seguida, o H2O2 oxidou a GSH e, consequentemente, impediu o efeito de passivação da superfície,
restringindo o efeito de aumento da fluorescência.
Numa fase de investigação posterior, foi proposto o acoplamento de uma unidade de difusão gasosa a um sistema de fluxo por multi-impulsão para a determinação seletiva do ião sulfureto em vinhos brancos e águas hidrotermais. A unidade de difusão gasosa assegurou a seletividade da metodologia uma vez que facilitou o isolamento do sulfureto dos interferentes da matriz da amostra, enquanto os QDs estabilizados com MPA foram usadas como sondas fotoluminescentes. A metodologia analítica baseou-se na interação entre o S2- e os QDs a qual provocou uma inibição da fluorescência das nanopartículas.
Uma outra aplicação analítica deste projeto envolveu a automatização da interação entre o EDTA e os QDs passivados com TGA, a qual foi, numa fase posterior aplicada na determinação fluorométrica de iões cálcio em águas minerais. A determinação de Ca2+ baseou-se na monitorização do aumento da
fluorescência dos QDs previamente inibida após a interação com EDTA, em solução aquosa.
Finalmente, e mais uma vez no âmbito dos objetivos desta tese, foram avaliadas distintas estratégias de imobilização em suportes sólidos, tanto por processos físicos como químicos. Este estudo pretendeu reduzir o impacto ambiental nocivo associado ao núcleo metálico das nanopartículas. O estudo compreendeu suportes sólidos com características distintas e envolveu a avaliação de diversos parâmetros químicos e físicos, visando a obtenção do material imobilizado mais adequado para o desenvolvimento de reatores e/ou sensores reutilizáveis, para fins analíticos.
Palavras-chave: pontos quânticos de CdTe, sistemas de fluxo por multi-impulsão, sensores químicos,
AGRADECIMENTOS vii
ABSTRACT x
RESUMO xii
INDEX xiv
INDEX OF FIGURES xx
INDEX OF TABLES xxvi
ABBREVIATIONS xxix
SYMBOLS xxxiii
OUTLINE OF THE THESIS xxxv
CHAPTER 1.
Introduction 1
1. General introduction 2
2. Semiconductor quantum dots 3
2.1. Physical properties of quantum dots 3
2.2. Quantum confinement effect 6
2.3. Optical properties of quantum dots 8
2.4. Synthesis of CdTe QDs 12
3. Sensing mechanism using CdTe QDs as chemical sensors 14
3.1. Quenching mechanism 16
3.1.1. Photo-induced electron transfer 16
3.1.2. Changes on the QDs surface charge or ligands 25
3.2. Enhancing mechanisms 31
3.3. Indirect fluorescent detection strategy 34
4. Automation of sensing schemes involving the interaction of target analyte with
CdTe QDs 40
5. Automatic methods of analysis 41
5.1. Multipumping flow system 43
5.1.1. Manifold components and configuration 44
5.1.2. Operational mode 45
5.1.3. Flow hydrodynamic characteristics 46
CHAPTER 2. Experimental 64 1. Introduction 65 2. UV/Vis spectrophotometry 65 3. Fluorescence spectroscopy 66 3.1. Steady-state fluorometry 66 3.2. Time-resolved fluorometry 67
4. Fourier transformed infrared spectroscopy 70
5. Transmission electron microscopy (TEM) 71
6. Zeta Potential. 71
7. X-ray diffraction 72
8. Fluorescence microscopy 75
9. Reagents and solutions 76
10. Flow apparatus and instrumentation 76
10.1. Flow manifold based on the multipumping concept 76
10.1.1. Propelling and insertion devices 77
10.1.2. Tubing and other manifold components 78
10.1.3. Gas diffusion unit 78
10.1.4. Detection system 79
10.1.5. Computer control and data acquisition 79
10.2. Additional instrumentation 79
11. Development and optimization of the flow systems 80
12. Statistic assessment of results 82
References 83
CHAPTER 3.
Determination of iron in biodiesel based on fluorescence quenching of CdTe
quantum dots 85
Abstract 86
1. Introduction 87
2.3. Synthesis of CdTe QDs 88
2.4. Samples 88
2.4.1. Sample preparation for developed procedure 88 2.4.2. Sample preparation for comparative procedure 88
2.5.General analytical procedures 89
2.5.1.Procedure for fluorescence quenching detection 89
2.5.2.Procedure for HR-CS GFAAS 89
3. Results and discussion 89
3.1. Characterization of CdTe QDs 89
3.2. Optimization of the reaction 89
3.2.1 Sensitivity of different MPA-capped CdTe QDs size 89 3.2.2. Influence of pH and buffer concentration 90 3.2.3. Influence of the MPA capped-CdTe QDs concentration 90
3.2.4. Influence of the reaction time 90
3.2.5. Influence of the ionic strength 90
3.3. Interferences study 91
3.4 Possible interaction mechanism 91
3.5. Analytical figures of merit and calibration 91
3.6. Analysis of samples and validation 91
4. Conclusions 92
References 92
CHAPTER 4.
Fluorescence enhancement of CdTe MPA-capped quantum dots by glutathione
for hydrogen peroxide determination 94
Abstract 95
1. Introduction 95
2. Experimental 96
2.1. Apparatus 96
2.2. Samples and standards 96
2.3. Reagents and synthesis of CdTe quantum dots 96
3.2. Preliminary assays 98 3.3. Mechanism investigation of the interaction between MPA-CdTe QDs and
glutathione 98
3.4. Optimization of the MPFS 99
3.5. Mechanism of the hydrogen peroxide determination 101
3.6. Figures of merit of the method 102
3.7. Method validation 102
4. Conclusions 102
References 102
CHAPTER 5.
Selective determination of sulphide based on photoluminescence quenching of MPA-capped CdTe nanocrystals by exploiting a gas-diffusion multi-pumping
flow method 105
Abstract 106
1. Introduction 106
2. Experimental 107
2.1. Apparatus 107
2.2. Samples, standards and reagents 107
2.3. Synthesis of CdTe quantum dots 108
2.4. Manifold and MPFS procedure 108
2.5. Characterization of quantum dots 108
3. Results and discussion 109
3.1. Preliminary assays 109
3.2. Quenching mechanism of MPA-CdTe QDs upon interaction with sulphide
anions 110
3.3. Optimization of the MPFS 111
3.3.1. Influence of MPA-CdTe QD sizes and molar concentration 112 3.3.2. Influence of chemical composition of donor and acceptor streams 112
3.3.3. Influence of pH conditions 112
3.3.4. Influence of physical flow parameters 112
CHAPTER 6.
Competitive metal–ligand binding between CdTe quantum dots and EDTA for free Ca2+ determination 117 Abstract 118 1. Introduction 118 2. Experimental 119 2.1. Apparatus 119
2.2. Samples, standards and reagents 119
2.3. Reagents and synthesis of CdTe quantum dots 119
2.4. MPFS manifold and analytical procedure 120
2.5. Characterization of quantum dots 120
3. Results and discussion 122
3.1. Preliminary assays 122
3.2. Optimization of the MPFS 123
3.2.1. Optimization of the chemical parameters 123 3.2.2. Optimization of the physical parameters 124
3.3. Analytical features and application 125
3.3.1. Figures of merit 125
3.3.2. Application to drinking waters 125
3.4. Quenching mechanism of TGA-CdTe QDs upon interaction with EDTA 126 3.5. Mechanism of the determination of free calcium ions 126
4. Conclusions 127
References 127
CHAPTER 7.
Physical and chemical immobilization of “multi-capped” CdTe quantum dots onto
solid supports: adsorption studies 130
Abstract 132
2.2 Synthesis of CdTe quantum dots 135
2.3 Instrumentation 136
2.4 Immobilization of QDs on solid supports 137
2.5 Adsorption efficiency 138
3. Results and discussion 138
3.1 Characterization of quantum dots 138
3.2 Preparation of QD-conjugated aminated support 141
3.3 Immobilization processes 142
3.4 Effect of QDs size on the immobilization process 145 3.5 Effect of temperature on the immobilization process 145
3.6 Adsorption isotherms 147
3.7 Adsorption kinetics 149
3.8 Thermodynamic parameters of the adsorption 152
3.9 Effect of the immobilization on QDs optical properties 153
3.10 Stability of the immobilized QDs 155
4. Conclusions 155
References 156
CHAPTER 8.
CHAPTER 1. Introduction
Figure 1.. Energy-level diagram illustrating promotion of an electron from the
valence band to the conduction band, to form an electron-hole pair. 5
Figure 2. Schematic representation of the electronic density of states as a
function of the dimensional freedom. Adapted from (22). 7
Figure 3. Absorption spectra obtained during the synthesis at different reaction
times. Adapted from (9). 8
Figure 4. The size-dependent photoluminescence of quantum dots. 9
Figure 5. Energy-levels diagram of fluorescence emission process in quantum
dots Adapted from (25). 10
Figure 6. Fluorescence spectra obtained during the synthesis at different
reaction times. Adapted from (9). 11
Figure 7. Diagram of quenching process for semiconductor quantum dots.
Adapted from (3). 16
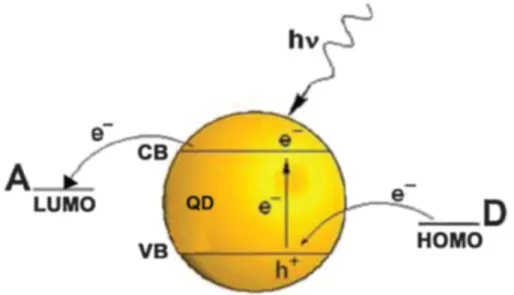
Figure 8. Electron transfer quenching pathways of QD particle by electron
acceptor (A) or electron donor (D) units. Adapted from (89). 17
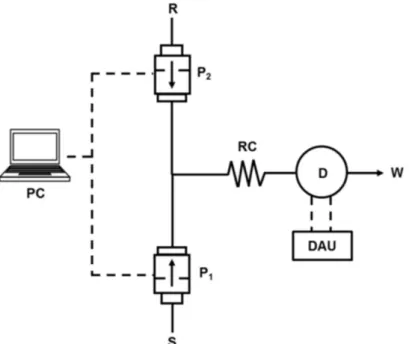
Figure 9. Diagram of a typical MPFS manifold. PC, computer; S, sample; R,
reagent; P1 and P2, solenoid micro-pumps; RC, reactor; D, detector; DAU, data
acquisition unit; W, waste. Adapted from (179). 45
Figure 10. Analytical signals obtained with a) multicommutated and b)
multipumping flow systems. Bromocresol green solution inserted into the flow system (total flow rate: 2.0 mL min−1, reactor length: 200 cm; sample inserted
volume: 100 μL). Adapted from (183). 47
Figure 11. Analytical signal profiles obtained by inserting into a MPFS, a
Brilliant Green solution (95.0 mg L-1) by means of a 3 μL (a), 8 μL (b) and 25 μL
(c) per stroke solenoid micro-pumps. Peaks recorded at 12 cm min-1. Adapted
Figure 1. FWHM in a quantum dots spectrum. Adapted from (2). 66 Figure 2. Frequency-domain lifetime measurements. In this example the
assumed decay time is 5 ns and the light modulation frequency is 80 MHz.
Adapted from (3). 68
Figure 3. Frequency-domain lifetime example. The phase angle increases (blue
line) and the modulation decreases (pink line) with increasing modulation
frequency. Adapted from (5). 69
Figure 4. Scheme of the distribution of ions around a charged particle. Potential
difference as a function of distance from particle surface. Adapted from (7). 72
Figure 5. Example of constructive and destructive interferences in X-ray.
Adapted from (9). 73
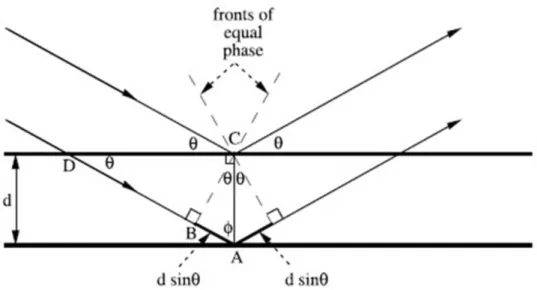
Figure 6. Schematic representation of the X-ray diffraction from two planes
separated by a spacing, d. Adapted from (11). 74
Figure 7. Typical diffraction pattern for CdTe nanocrystals semiconductors. 74
Figure 8. Schematic representation of a fluorescence microscope. Adapted
from (13). 75
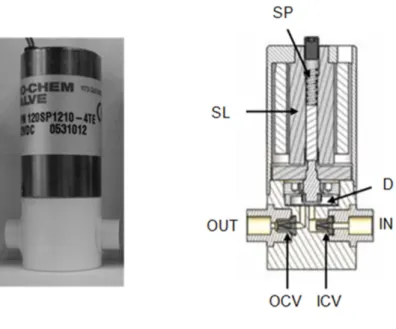
Figure 9. A, Solenoid micro-pump with a stroke volume of 10 µL (120SP1210 –
4TE); B, Schematic representation of solenoid micro-pump cross section. SP, spring; SL, solenoid; D, diaphragm; ICV, inlet check valve; OCV, outlet check
valve. Adapted from (14). 77
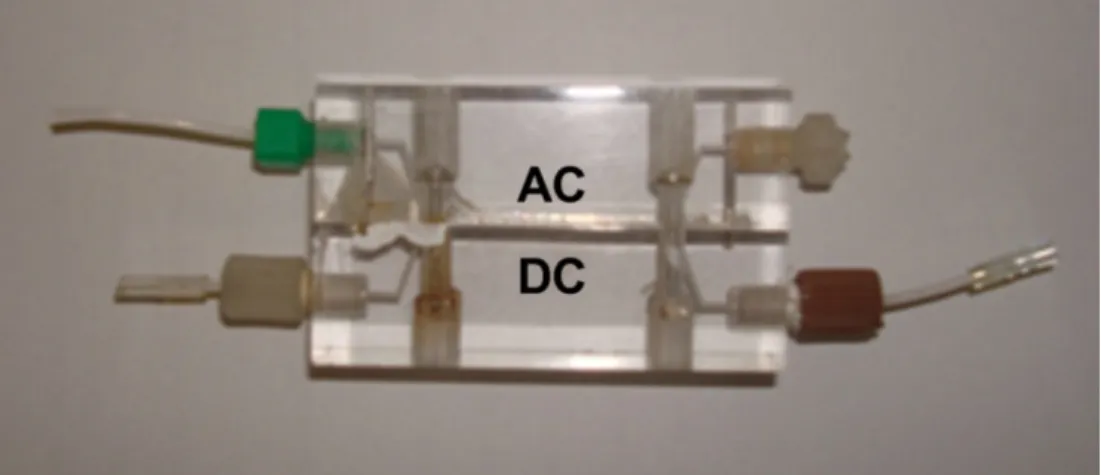
Figure 10. Photograph of gas diffusion unit. DC, donor channel; AC, acceptor
channel. 78
CHAPTER 3. Determination of iron in biodiesel based on fluorescence
quenching of CdTe quantum dots
Figure 1. TEM image of 2.3 nm CdTe QDs. 90
Figure 2. Effect of some metals on the fluorescence intensity of MPA-capped
CdTe QDs with different sizes. [QD]: 2.5 10-6 mol L-1; [buffer]: 0.02 mol L-1;
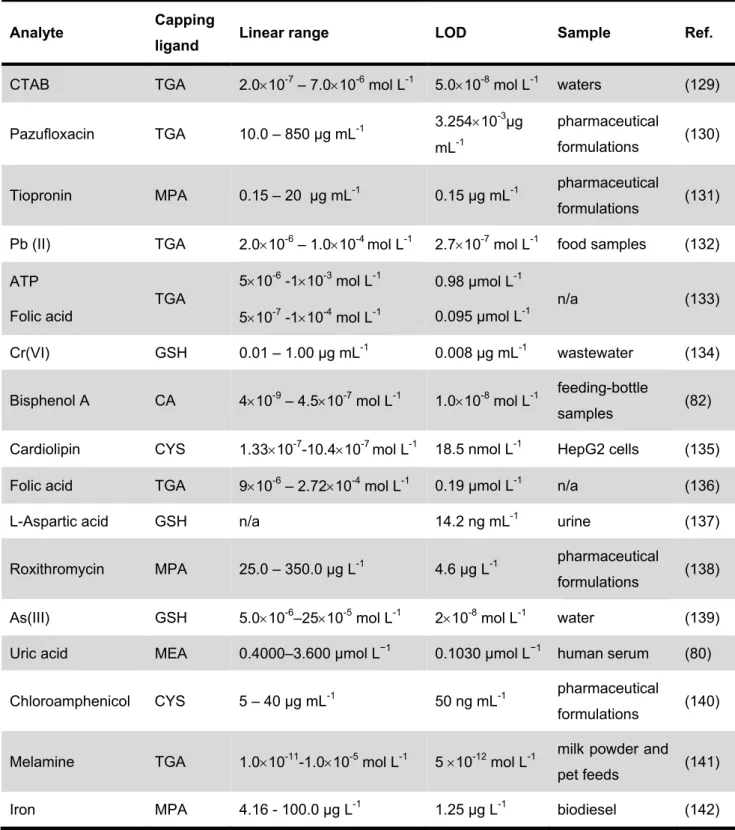
Figure 3. Influence of QDs concentration on the analytical signal. [buffer]: 0.02
mol L-1; [iron]: 40 µg L-1; pH:7.5. 90
Figure 4. The Stern–Volmer plot fit curve. The equation curve is represented by:
y = 0.000006x3 – 0.0005x2 + 0.0176x + 0.86, with R = 0.9998. 91
CHAPTER 4. Fluorescence enhancement of CdTe MPA-capped quantum dots
by glutathione for hydrogen peroxide determination
Figure 1. Multipumping flow manifold. P1 – P4: solenoid micro-pumps (10 μL
stroke volumes); X1 and X2, confluence points; RC1: 40 cm reactor coil; RC2: 75
cm reactor coil; D, fluorescence detector; GSH, glutathione prepared in deionized water; S, sample (H2O2); QDs, MPA-CdTe quantum dots prepared in
deionized water; C, carrier solution (deionized water); W, waste. 97
Figure 2. Normalized absorption (A) and photoluminescence (B) spectra of the
different sizes of QDs. Photograph of the QDs solutions without irradiation (C)
and irradiated with UV light at 365 nm (D). 97
Figure 3. TEM images of the 2.48 nm MPA-CdTe QDs. 98
Figure 4. (A) Influence of different GSH concentrations on the fluorescence
intensity of 3.0 µmol L-1 MPA-CdTe QDs with different sizes: () 1.36 nm; ()
1.98 nm; (▲) 2.48 nm; () 3.01 nm. (B) Fluorescence emission spectra of 3.0 µmol L-1 MPA-CdTe with a size of 2.48 nm in the presence of different GSH
concentrations: (——) 0 mmol L-1; (——) 0.33 mmol L-1; (——) 0.65 mmol L-1;
(——) 0,98 mmol L-1; (——) 1.30 mmol L-1; (——) 1.63 mmol L-1; (― ―) 2.28
mmol L-1; (― ―) 2.93 mmol L-1; (― ―) 3.90 mmol L-1. 98 Figure 5. – FT-IR spectra of (a) glutathione (——) and (b) the interaction of
glutathione with MPA-CdTe QDs (— —). 99
Figure 6. Evaluation of the fluorescence enhancing effect upon the interaction
of different GSH concentrations to MPA-CdTe QDs with different sizes; (a) 1.36 nm; (b) 1.98 nm; (c) 2.48 nm; (d) 3.01 nm; (e) 3.79 nm and different QDs
volume) on the sensitivity of the methodology. () 4 pulses; () 6 pulses; (▲) 8
pulses; () 10 pulses; () 12 pulses. 101
Figure 8. Influence of the micro-pumps pulse time and the corresponding flow
rate on the sensitivity of the methodology. 101
Figure 1 in Supplementary material. Preliminary multipumping flow manifold.
P1 – P3: solenoid micro-pumps (10 μL stroke volumes); X, confluence point; RC:
50 cm reactor coil; D, fluorescence detector; QDs, MPA-CdTe quantum dots prepared in deionized water; C, carrier solution (deionized water); GSH,
glutathione prepared in deionized water; W, waste. 104
CHAPTER 5. Selective determination of sulphide based on photoluminescence
quenching of MPA-capped CdTe nanocrystals by exploiting a gas-diffusion multi-pumping flow method
Figure 1. Schematic diagram of the gas diffusion multi-pumping flow system. P1
– P4: solenoid micro-pumps (10 μL stroke volumes); X1 and X2, confluence
points; GDU, gas diffusion unit; DC, donor channel; AC, acceptor channel; RC, 100 cm reactor coil; D, photoluminescence detector; S, sample prepared in 0.050 mol L-1 NaOH; DS, donor stream: 0.75 mol L-1 HCl; AS, acceptor stream:
0.050 mol L-1 NaOH; QDs, 3.01 nm MPA-CdTe quantum dots with 0.50 µmol L-1
prepared in phosphate buffer pH = 11; W, waste. 107
Figure 2. Normalized UV-vis absorption (A) and photoluminescence (B) spectra
of the synthesized MPA-CdTe QDs. Photograph of the QDs solutions at visible
light (C) and irradiated with 365 nm light (D). 109
Figure 3. A) Influence of the sulphide anion concentration on the luminescence
properties of 0.5 µmol L-1 MPA-CdTe QDs with different sizes: () 1.36 nm; ()
1.98 nm and (▲) 3.01 nm. B) Photoluminescence emission spectra of 0.5 µmol L-1 MPA-CdTe with a size of (I) 1.36 nm; (II) 1.98 nm; (III) 3.01 nm, in the
presence of different S2- concentrations. 110
Figure 4.
Normalized UV-vis absorption spectra of 0.5 µmol L-1 MPA-CdTe with
MPA-CdTe QDs and sulphide anion at different concentration levels. 111
Figure 6. Influence of (A) HCl and (B) NaOH concentrations on the sensitivity of
the methodology. 113
Figure 7. Influence of the pH of QDs solutions on the sensitivity of the analytical
methodology. 113
Figure 8.
Influence of the reactor’s length and QDs volumes (number of pulses) on the sensitivity of the methodology. () 30 µL (3 pulses); () 50 µL (5 pulses);
(▲) 70 µL (7 pulses); () 90 µL (9 pulses) and (×) 110 µL (11 pulses). 113
Figure 9. Influence of the (A) pulse time and (B) the corresponding flow rate on
the sensitivity of the methodology. 114
CHAPTER 6. Competitive metal–ligand binding between CdTe quantum dots
and EDTA for free Ca2+ determination
Figure 1. Flow diagram for the determination of calcium. EDTA,
ethylenediaminetetraacetic acid prepared in boric acid/KCl/NaOH buffer solution at pH = 9; S, sample solution prepared in boric acid/KCl/NaOH buffer pH = 9; QDs, TGA-capped CdTe quantum dots prepared in boric acid/KCl/NaOH buffer solution at pH = 9; C, carrier solution, boric acid/KCl/NaOH buffer solution at pH = 9; W, waste; P1 – P4, solenoid micro-pumps (internal volume 10µL); X1 – X2,
confluence points; RC1, 50-cm reactor; RC2, 100 cm reactor; D, fluorometer
detector (λex = 400 nm and λem = 534 nm). 120
Figure 2. (I) Normalized absorbance and (II) photoluminescence spectra of the
synthesized CdTe QDs capped with different organic ligands: A, cysteine; B, glutathione; C, mercaptopropionic acid; D, thioglycolic acid; E,
mercaptoethanesulfonic acid. 121
Figure 3. p-XRD of 2.32 nm TGA capped CdTe QDs. 122
Figure 4. Evaluation of the fluorescence quenching effect upon the interaction
of EDTA, at different concentrations levels, to the synthesized QDs capped with different organic ligands; () CYS; (▲) GSH; () TGA; (○) MPA; () MES, at
different pH values; (A) pH 7; (B) pH 9; (C) pH 11; (D) pH 12. 124
Figure 6. (A) Normalized UV-Vis absorption and (B) fluorescence emission
spectra of 0.1 μmol L-1 TGA-CdTe in the presence of different EDTA
concentrations. 126
Figure S2. Fluorescence quenching of TGA-capped CdTe QDs with EDTA up
to 2.50×10⁻⁵ mol L-1 at different temperatures: () 25 ºC; () 40 ºC; (▲) 60 ºC. 129
CHAPTER 7. Physical and chemical immobilization of “multi-capped” CdTe
quantum dots onto solid supports: adsorption studies
Figure 1. Normalized absorbance (___) and photoluminescence (---) spectra of the synthesized CdTe QDs capped with different organic ligands. A: 2.48 nm MPA; B: 3.01 nm MPA; C: 2.57 nm GSH; D: 3.35 nm GSH; E: 2.32 nm TGA; F:
3.31 nm CYS. 139
Figure 2. p-XRD of 2.48 nm MPA-capped CdTe QDs. 140
Figure 3. Sequential steps for preparing QD-aminated supports conjugates. 141
Figure 4. Effect of CPG and CB supports amount on the adsorption efficiency of
3.35 nm GSH-capped CdTe QDs. 143
Figure 5. Fluorescence microscopy images of adsorbed GSH QDs (A) and MPA
QDs (B) on CPG and CB solid supports, respectively. 144
Figure 6. Effect of temperature on the adsorption efficiency of GSH-QDs by
solid support. GSH-QD concentrations. 146
Figure 7. Effect of temperatures on absorption efficiency at different GSH-QDs
concentrations. 147
Figure 8. Effect of time on the adsorption efficiency of QDs by solid support. 150
Figure 9. Effect of the immobilization of QD on the PL emission wavelength. (__) immobilized QDs, (---) aqueous dispersion of MPA (A), GSH (B), CYS (C) and
CHAPTER 1. Introduction
Table 1. Fluorescence quenching of CdTe QDs exploring the photo-induced
electron transfer (PET) mechanism. 23
Table 2. Fluorescence quenching of CdTe QDs exploring the mechanism based
on changes on the QDs surface charge or ligands. 30
Table 3.Fluorescence enhancing of CdTe QDs. 34
Table 4.Indirect fluorescent detection strategies. 39
CHAPTER 3. Determination of iron in biodiesel based on fluorescence
quenching of CdTe quantum dots
Table 1. Microwave heating programme for sample digestion. 89
Table 2. Temperature programme for the determination of iron in biodiesel
samples by HR-CS GFAAS. 89
Table 3. Results obtained in the evaluation of the interfering effect of foreign
species by using a 40 µg L-1 iron solution on the developed methodology 91 Table 4. Figures of merit for the determination of iron in biodiesel samples. 91
Table 5. Parameters evaluated during the optimization of the proposed method
and selected operating conditions for iron determination. 92
Table 6. Results obtained in the determination of iron in biodiesel using the
proposed methodology and the comparative method. 92
Table 7. Recovery tests for iron in spiked biodiesel samples (n = 3). 92
CHAPTER 4. Fluorescence enhancement of CdTe MPA-capped quantum dots
by glutathione for hydrogen peroxide determination
Table 2. Results obtained in study of the influence on the fluorescence
enhancing effect upon the interaction of different GSH concentrations to QDs
with different sizes and concentrations. 100
Table 3. Comparison of the analytical results obtained in the determination of
hydrogen peroxide in commercial lens care solutions by the proposed flow
procedure and the reference procedure. 101
CHAPTER 5. Selective determination of sulphide based on photoluminescence
quenching of MPA-capped CdTe nanocrystals by exploiting a gas-diffusion multi-pumping flow method
Table 1. Photoluminescence lifetime values for 0.5 µmol L-1 of 3.01 nm QDs
with Na2S. 111
Table 2. Comparison of the results obtained in the determination of S2- ion in
hydrothermal waters by the proposed GD-MPFS and the reference method.
Recovery tests for sulphide in spiked samples. 114
Table 3. Results obtained for the determination of S2- ion in white wines and in
spiked samples through the developed GD-MPFS. 115
CHAPTER 6. Competitive metal–ligand binding between CdTe quantum dots
and EDTA for free Ca2+ determination
Table 1. First excitonic transition (λ1st exci) and emission (λem) wavelengths, Full
Width at Half Maximum (FWHM) and diameter of the synthesized CdTe QDs
capped with different organic ligands. 122
Table 2. Molecular structures of the capping ligands cysteine (CYS), glutathione
(GSH), mercaptopropionic acid (MPA), thioglycolic acid (TGA) and
mercaptoethanesulfonic acid (MES). 123
Table 3. Comparison of the analytical results obtained in the determination of
concentration on the fluorescence intensity of CdTe QDs capped with different
organic ligands at different pH values. 128
CHAPTER 7. Physical and chemical immobilization of “multi-capped” CdTe
quantum dots onto solid supports: adsorption studies
Table 1. Definite conditions for MPA/GSH/TGA/CYS QDs immobilization onto
CPG and CB solid supports. 145
Table 2. Isotherm models used for the adsorption process interpretation. 148
Table 3. Isotherm parameters for QDs adsorption onto CPG or CB solid
supports, at 305.65 K. 149
Table 4. Kinetics models used for the adsorption process interpretation. 150
Table 5. Parameters of adsorption kinetics of QDs onto solid supports. 151
Table 6. Thermodynamic parameters of GSH QDs adsorption on solid supports. 152
Table S1. Effect of pH and of the presence/absence of EDC/NHS or
glutaraldehyde in the MPA/GSH/TGA/CYS QDs immobilization onto different
4AT 4-amino-2,2,6,6- tetramethylpiperidine-N-oxide
AA Ascorbic acid
AAS Atomic absorption spectrometry AChE Acetylcholinesterase
AO Alcohol oxidase
APDC Ammonium pyrrolidine dithiocarbamate
ATP Adenosine 5` tripho
AuNPs Gold nanoparticles
Bis-tris bis(2-hydroxyethyl)iminotris(hydroxymethyl)methane BQ 1,4-Benzoquinone
BSA Bovine serum albumine CA Cysteamine CB Aminopropyl‐modified silica
CCD Charge-coupled device
CdTe Cadmium telluride
ChOx Choline oxidase
CPG Aminoalkylated glass beads
CTAB Cetyltrimethylammonium bromide
ctDNA calf thymus DNA CYS Cysteine
Cyt c Cytochrome c
DA Dopamine DLS Dynamic light scattering DPP Diprophylline dsDNA double-strand DNA
EDTA Ethylenediaminetetraacetic acid EMIDCA 1-ethyl-3-methylimidazolium dicyanamide FAES Flame atomic emission spectrometry
FBS Fetal bovine serum
FIA Flow-injection analysis
FLO Fleroxacin
FRET Förster resonance energy transfer
FTIR Fourier transformed infrared spectroscopy FWHM Full width at half maximum
GDU Gas-diffusion unit
GOD Glucose oxidase
GSH Glutathione
GSSH Glutathione disulfide
H2Q Hydroquinone
HAP Hydroxyapatite HCYS Homocysteine HOMO Highest occupied molecular orbital
HR-CS GFAAS High-resolution continuum source graphite furnace atomic absorption spectrometry
hsDNA herring sperm DNA
HXT Hydroxytyrosol
ICP-OES Inductively coupled plasma optical emission spectrometry ICP-MS Inductively coupled plasma mass spectrometry
IUPAC International Union of Pure and Applied Chemistry KAE Kaempferol
LOD Limit of detection LOQ Limit of quantification
LUMO Lowest unoccupied molecular orbital
MCFIA Multicommutation MEA 2-mercaptoethylamine
MES 2-mercaptoethanesulfonate
MPA 3-mercaptopropionic acid
MPFS Multipumping flow system
MSA Mercaptosuccinic acid
MSFIA Multisyringe
NAC N-acetyl-l-cysteine NC Nanocrystals
NHS N-hydroxysuccinimide
OP Organophosphorus pesticides
OPH Organophosphorus hydrolase
PAMAM Polyamidoamine dendrimer
PET Photo-induced electron transfer Phen 1,10-phenanthroline PHT Photo-induced hole transfer
PL Photoluminescence PM Parathion-methyl PTFE Polytetrafluoroethylene QDs Quantum dots QY Quantum yield RD Relative deviation
TEM Transmission electron microscopy
TGA Thioglycolic acid
TOP Trioctylphosphine
TOPO Trioctylphosphine oxide
Trizma tris(hydroxymethyl)aminomethane UV Ultraviolet
Vis Visible XRD X-ray powder diffraction
A Area a0 Bohr radius C0 Initial concentration Ce Equilibrium concentration D Nanoparticle size Eg Energy band-gap H Adsorption rate h Planck’s constant K Association constant
K1 Rate constant of pseudo-first order
K2 Rate constant of pseudo-second-order
KF Freundlich constant
Ki Rate constant for intraparticle diffusion
KL Langmuir constant
KSV Stern-Volmer quenching constant
me Reduced mass of the electron
mh Reduced mass of the hole
mω Demodulation ratio
N Number of photons
qe Amount of QD adsorbed per unit mass of solid support
qm Maximum adsorption capacity
qt Amount of QD adsorbed per unit mass of solid support at time t
R Universal gas constant
T Temperature
Electronic coupling constant Molar extinction coefficient 0 Permittivity of vacuum
Bragg angle
Wavelength
µ Reduced mass of the exciton
Fluorescence lifetime
Phase angle
2 Reduced chi squared
ω Modulation frequency
E Transition energy
G Free energy change
H Enthalpy change
This thesis is organized in eight main chapters:
Chapter 1. Introduction
This chapter provides a theoretical background of the thesis theme, introduces the main and the specifics objectives of developed work and covers a general description of the other chapters, namely their organization and structure.
Chapter 2. Experimental
This chapter includes the description of the instruments and the experimental methods used to develop the research activities carried out under the scope of this thesis. The general procedures for the preparation of solutions and the description of the devices used to assemble the flow systems are also exposed.
Chapter 3-7. Original Research
These chapters describe the pioneering research carried out under the scope of the thesis. The obtained results, that were condensed in five original manuscripts four of which were already published (chapters 3, 4, 5 and 6) and one submitted for publication (chapter 7), were the outcome of the experimental studies designed to answer the questions arising from the general and specific objectives of the thesis.
Chapter 8. Final Conclusions
CHAPTER 1
1. General
introduction
In the last few years we have witnessed the appearance of a plethora of new applications involving the use of nanoscale materials and structures for biolabeling, bioimaging, sensing and diagnostics (1).
Nanotechnology is a key word in scientific research, particularly since the early 1990’s, being generally assumed as a multidisciplinary science, which allows the manipulation of matter on an atomic scale. Indeed, nanotechnology intervenes in various areas and has a great impact on both chemical and biological sciences and technology.
Nanoparticles have received a large attention in modern materials sciences due to their unique properties, which make them particularly attractive for different applications. Some of the most relevant nanoparticles are the colloidal semiconductor nanocrystals (NC), often termed as quantum dots (QDs) which were first discovered in the early 1980’s (2). QDs are monodisperse crystalline clusters with physical dimensions close to or smaller than the bulk-exciton Bohr radius (3) that are also considered artificial atoms due to the similarity between the discrete energy levels of the nanocrystals and of the atoms (1). Their diameter, ranging typically from 1 to 10 nm, comprises a couple of hundreds to a few thousands of atoms (4), in which the electron motion is confined by potential barriers in all dimensions (1).
Over the past two decades, QDs have attracted a huge interest from the scientific community, which has raised an obvious question: why are these nanomaterials so exciting? The answer to this question relies mostly on their unique and superior electronical, magnetical, optical or physico-chemical properties (5). These peculiar properties are clearly different from those exhibited by bulk semiconductor materials with same basic composition, which are not susceptible to quantum confinement effects. The size-dependent phenomena (5-7) only occur when the materials size is reduced to a few nanometers, which enables the size-tuning of the QDs optical properties by changing the nanocrystal growth time.
The main reasons that are behind the emergence of QDs as the focus of very striking and innovative research in biological, analytical and optoelectronic fields (1, 8) lie on the ability of these nanoparticles to emit light upon excitation and, additionally, in the fact that their photoluminescent properties are sensitive to any modification of surrounding medium or interaction with a given chemical species (3). This particular properties make them interesting and advantageous alternatives to the traditional organic dye (9).
The development of colloidal nanocrystals is no longer simply focused on the adjustment of the nanoparticles size but also on the synthesis of new materials and on the modification of those already available. The main goal is that, through these features, new and diversified fields of applications may be found for the nanocrystals.
In terms of composition, different QDs have been synthesized, usually comprising elements from the periodic groups 12–16, 13–15 or 11–17, such as, CdSe (10), CdTe (10), ZnSe (11), CdS (10), CdSe/ZnS (12) and InP (13). The variety of synthesized core QDs allows covering almost the complete ultraviolet/visible/infrared (UV/Vis/IR) wavelength range and the diversity of used cappings enables the application of these nanomaterials either in aqueous or organic medium. In this regard, there are already innumerous publications concerning different analytical applications of colloidal nanocrystalline semiconductors exploiting new detection strategies and reaction schemes. One of the main areas of research is related with the surface chemistry of the nanoparticles. Effectively, some of their most relevant properties are markedly determined by occurring surface states.
The main goal of this first chapter is to introduce important theoretical concepts which are fundamental to understand QDs properties. The aqueous synthesis of cadmium telluride (CdTe) QDs will be briefly described since those were used to perform the work of this thesis. Different reaction schemes involving the use of CdTe QDs and the interaction mechanisms between the target analytes and the nanoparticles will be also discussed. Finally, the synergies arising from combining QDs and flow-based analytical systems will be emphasized by describing the principles of the used automatic methodologies with main focus on the multipumping flow concept.
2. Semiconductor quantum dots
2.1. Physical properties of quantum dots
Quantum dots are nanostructured materials with intermediate properties between a bulk material and a molecular form (14, 15). Due to the physical length scale, equivalent to or less than the so-called Bohr exciton radius (16, 17), QDs exhibit exceptional properties depending on quantum confinement effect, which arise as a result of the changes in the density of electronic states (14). As a consequence of this effect, the properties of QDs lie between those of the corresponding bulk material and molecular compounds, as previously mentioned, wherein in bulk materials the energy levels are continuous while in QDs the energy levels become discrete and more atomic-like (1, 17). As any
semiconductor, QDs are characterized by a band-gap energy (Eg) between the valence and the conduction bands. Sometimes, in QDs studies, a description by means of molecular orbital theory is more frequent, making use of the terms HOMO (highest occupied molecular orbital) and LUMO (lowest unoccupied molecular orbital) instead of conduction band and valence band, respectively (4).
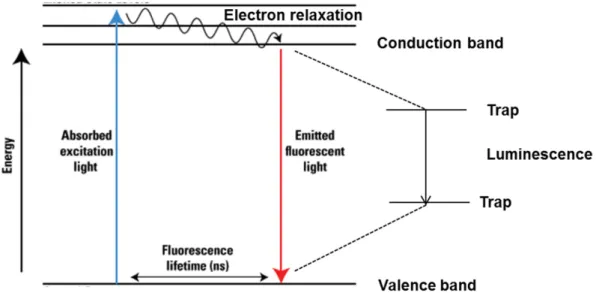
To better understand the interest of nanoscaled semiconductor from a quantum mechanical point of view, it is necessary to consider what happens when a photon, with energy equal or greater to their band-gap, reaches a nanocrystallite (figure 1). Upon absorption of the photon, an electron is promoted from the valence to the conduction band, leaving a vacant position known as hole in the valence band. In this excited state electrons and holes can move within the crystal lattice. The electron-hole pair is considered bonded via Coulombic attraction, and this quasi-particle is then called exciton (18). Taking into account the theory of Brus et al. (19), in a nanocrystal semiconductor the exciton follow a mechanism similar to a hydrogen atom and can be explained by a hydrogen-like model. Usually, is considered as a single particle moving around a centre mass motion, ignoring that, indeed, it is a composite particle. Thus, the existence of this centre mass motion allows the attribution of a reduced mass to the exciton:
1 μ= 1 me+ 1 mh (Equation 1)
wherein me and mh are the reduced masses of the electron and hole in the quantum dot, respectively. This description is known as effective mass approximation and have been widely used to describe electronic motion (17).
In this part it is important to introduce the Bohr radius concept, often referred in discussions about quantum dots. The Bohr radius, symbolized by a0, is a physical
constant representing the stable closest orbit to the nucleus in Bohr’s planetary model of the atom and is defined by the following equation (17):
a0=4πεε0 2
mq2 (Equation 2)
wherein ε is the dielectric constant of the semiconductor, ε0 is the permittivity of vacuum,
m is the mass of the electron, h is Planck’s constant and q is the charge on the electron (17, 18). For the case of an exciton in a nanocrystal semiconductor, this concept can be used, by replacing the mass of the electron by the effective mass of the exciton (electron-hole pair), μ, (17).
a0=4πεε0 2
μq2 (Equation 3)
The excitons in nanocrystals semiconductors are well described as Wannier–Mott, resulting from weak electron-hole interactions as opposed to strongly bound Frenkel excitons with higher Coulomb interactions (20).
Figure 1 – Energy-level diagram illustrating promotion of an electron from the valence
band to the conduction band, to form an electron-hole pair.
The recombination or relaxation of the electron-hole pair can be followed by several processes, such as, radiative recombination, recombination by trap states (mid-gap energy levels) or annihilation of the exciton or Auger effect (10, 21). When radiative recombination occurs (only possible if electron and hole recombine directly with each other) it originates the emission of a photon with energy close to the Eg. Due to quantum effects the absolute energy disparity between valence and conduction bands is discrete and the HOMO-LUMO gap varies in semiconductor QDs as a function of the size. So, the emission of semiconductor nanocrystals can be tuned by controlling the size. The efficiency of the recombination process and, as a consequence, the perfection of the crystal structure can be estimated by measuring its quantum yield (QY). Usually, a high-luminescence QY results from intrinsic recombination, while a low QY is considered a result of the defects states positioned within the band-gap acting as traps for the photogenerated carriers. These defect states give alternative pathways for the rapid recombination of the exciton, resulting in non-radiative transitions (4).
2.2. Quantum confinement effect
When talking about semiconductor nanostructures, two types of quantum confinement are possible. If the dimension of the nanostructure is bigger than the exciton Bohr radius, a weak confinement regime is valid. Otherwise, when the confinement length is smaller than the excitonic Bohr radius, a strong confinement regime is applicable, as is the case of quantum dot systems. When a strong confinement occurs, the band structure changes and two quantum size effects happen. The first quantum size effect is related with the small number of atoms in a nanocrystal, which means that only a finite number of molecular orbitals can help in the formation of the band structure and, as a result, the energy levels become discrete when the crystal size decrease. The second effect is due to confinement energy alteration, wherein the increased confinement energy, with the decrease on the particle size, leads to a larger separation of the energy levels and consequently the band gap of nanocrystals increases. On the contrary, the band gap decreases as more atoms are added to the quantum dot with the lower limit of the band gap corresponding to the ordinary bulk material (3).
A quantum dot is a good example of the particle-in-a-box, a model that can be used to comprehend the quantum confinement and to calculate the energy levels based on size. In this model, some analogies are made, namely by considering the exciton as the particle and the quantum dot as the box, and the energies of the particle in the box depend on the size of the box. According to the “effective mass approximation” model proposed by Brus et al. (19), band-gap energies and particle sizes can be estimated by the following equation: Eg QD =Eg bulk + h2 8R2 1 me+ 1 mh -1.8e2 4πε0εR (Equation 4)
where Eg is the band-gap energy of a quantum dot or bulk semiconductor, R is the quantum dots radii, me is the effective mass of the excited electron, mh is the effective
mass of the excited hole, ε is the semiconductor material dielectric constant and ε0 is the
permittivity of a vacuum. The confinement term 1
R2 is a particle-in-a-box-like term for the
exciton and if this term decreases, an obvious increase of Eg QD is observable. The
electron–hole pair Coulombic attraction was also represented in this equation with the term -R1, which is mediated by the semiconductor (19). So, by increasing R, Eg QD
Mott-Wannier type, the Coulomb interaction becomes weaker and the confinement energy increases (19).
In this model some approximations have been proposed, which means that this model can fail in certain cases. Effectively, implicit in this model is the assumption that the nanocrystals are spherical and that the effective masses of the electron and hole and the dielectric constant of the semiconductor material are constant as a function of size (18, 19). Usually, the above calculations are done for nanomaterials in the strong confinement regime (18).
Quantum dots exhibit quantum confinement in all three dimensions. For this reason, the literature also calls them zero-dimensional (0-D) systems, differently from quantum wells and quantum wires which have 2 and 1 degree of freedom, respectively (figure 2).
Figure 2 – Schematic representation of the electronic density of states as a function of the
dimensional freedom. Adapted from (22).
One important property of quantum dots is their large surface-to-volume ratio, , which increases as the dimensions of the nanoparticle become smaller (23). This characteristic gives great advantages to quantum dots and explains the frequent use of these nanoparticles for analytical purposes since the interactions between the nanoparticles and a given target compound takes place only at the surface and not in the interior. Another important advantage is evident when these nanocrystals are used as catalyst, since they could be more efficient than bulk materials. Quantum dots are very important in all applications that require a large surface-to-volume ratio, such as, sensing, catalysis and targeted drug delivery. Mathematically is very simple to demonstrate de increase of the surface-to-volume ratio for decreasing sizes, considering that quantum dots are spheres.
Asphere=4πr2 (Equation 5) Vsphere=43πr3 (Equation 6) Rsphere=4πr43 3 πr2=3 r (Equation 7)
2.3. Optical properties of quantum dots
Several studies of the physical properties of nanocrystals semiconductors showed that the strong confinement of the free charge carriers (electrons and holes), at this nanoscaled sizes, led to observation of unique optical properties (7, 8), which are tunable by the control of chemical composition, shape and dimensions of the nanomaterials. These materials, usually non fluorescents, acquire an intense and long-lasting fluorescence when synthesized at nanoscaled sizes (8).
As previously mentioned, quantum dots can absorb a photon with energy equal or higher than the semiconductor band-gap. Figure 3 shows typical absorption spectra of quantum dots obtained from a synthesis at different reaction times.
Figure 3 - Absorption spectra obtained during the synthesis at different reaction times.
Adapted from (9).
In all spectra it is possible to see a sharp maximum at the end of the absorption onset and as the crystal size increases, the absorption onset shifts to higher wavelengths (red shift), since the band-gap energy of the quantum dots decreases. The above referred maximum
corresponds to the first excitonic peak, which is the first possible electronic transition. The position on the spectrum depends on the band-gap energy and on the size. Therefore, the band-gap energy of quantum dots becomes size-dependent (figure 4) (7).
Figure 4 – The size-dependent photoluminescence of quantum dots.
Furthermore, the broad absorption bandwidth, owing to the existence of multiple electronic states at higher energy levels, enables the simultaneous excitation of multiple colors QDs with a single light source (3).
The absorption spectra can be used to estimate the crystal size as well as the crystal concentration, which will be described with more detail in the next chapter (24).
The wide acceptance of semiconductor nanocrystals in the scientific community, and the extensive research around them is justified, undoubtedly, by their photoluminescence. In this process, after the absorption of a photon, an electron is excited to the energy levels on the excited states. This is followed by a charge carrier non-radiative vibrational relaxation to the lowest excited state and, after a certain amount of time (fluorescence lifetime), by the recombination of electron-hole, accompanied by the emission of a photon with energy corresponding the band-gap, allowing that the system relaxes to the ground state (figure 5).
Figure 5 – Energy-levels diagram of fluorescence emission process in quantum dots
Adapted from (25).
Figure 6 shows fluorescence emission spectra of QDs, acquired during a synthesis. It presents a characteristic Gaussian shape and results from the recombination of the electron-hole pair. Moreover, it can be observed a red shift in the maximum of the emission peak in relation to the excitonic peak in the absorption spectra, the so-called Stokes-shift, which happens due to the loss of vibrational excitation energy during the fluorescence process (26).
These spectra can be used to analyze the quality and monodispersity of the nanoparticles (24).
Figure 6 – Fluorescence spectra obtained during the synthesis at different reaction times.
Adapted from (9).
Morphologically, the occurrence of some imperfections on the nanocrystal, which act as charge carriers traps (figure 5), can hinder the efficiency of electron-hole recombination promoting deactivation by non-radiative processes (3). “Traps” are incompletely bounded Cd or Te ions, producing mid-gap states within the band-gap which are able to capture electron and holes, respectively. The presence of these dangling bonds, provides additional ways for the relaxation of the electron which result in a non-radiative relaxation or a red shifted fluorescence (27).
These surface imperfections reduce the quantum yield (ϕf), defined as the ratio between the number of emitted photons Nem λex and the number of absorbed photons Nabs λex
(28).
ϕf=Nem λex
Nabsλex (Equation 8)
Indeed, QY of quantum dots is directly related with the occurrence of radiative (higher QY) or non-radiative (lower QY) recombination processes (3). For QDs, the maximum theoretical value, 1, was never achieved due to the presence of the defect states on the nanoparticle that act as fluorescence quenchers. These drawbacks can be overcome through a proper surface passivation, by diminishing the occurrence of surface imperfections. For example, when working with water-soluble CdTe QDs the QY can be clearly improved through the passivation with thiol-ligands. In all cases, the surface
passivation, as well as the stability against photo-oxidation, can be attained by overcoating the nanoparticle with a higher band-gap semiconductor creating a surface-capping shell, in other words, a core/shell quantum dot (3, 18).
Beyond the band-gap tunability, QDs exhibit other important photoluminescent properties, such as broad absorption, narrow and symmetric emission spectra, reduced photobleaching and longer emission lifetimes compared to conventional organic dyes.
2.4. Synthesis of CdTe QDs
It is well known that the growth process of colloidal nanocrystals can be explained by the nucleation theory. According to this theory, the growth of the nanocrystals in solution involves two stages: nucleation and growth. The formation of nanoparticles start with nucleation and their control is fundamental because it determines many properties of the nanoparticles, namely, the size, size distribution, perfection and polymorph modification (29). When nucleation occurs quickly, many crystals are formed almost simultaneously. This step depletes solute solution and can interrupt the nucleation at the subsequent steps of crystallization. So, in these circumstances one can obtain a monodisperse population of nanocrystals (4, 29). After that, the growth process of nanocrystals happens which can occur through three different regimes. In the case of a size focusing regime occur, the smaller crystals grow faster than the bigger ones thereby reducing size dispersion. If a broadening regime is achieved the smaller crystals grow slower than the bigger ones. In the worst case, the Ostwald ripening regime can occur wherein the smaller nanocrystals dissolve to free monomers and are incorporated into the bigger nanocrystals (4), and consequently the size dispersion increases and the total nanoparticles concentration decreases.
Distinct synthetic techniques can be found in the literature for the preparation of nanocrystals semiconductors from different materials. The choice of solvent is a very important step because apart from determining the synthesis and solubility conditions (aqueous or organic environment), the solvent also defines the applicability of the nanomaterials (10). Since the work performed under the scope of this thesis involved the application of CdTe QDs synthesized in aqueous media, this is the synthetic route emphasized in this section.
Although the first publications about the synthesis of colloidal semiconductors nanocrystals were from 1982 (30, 31), the first paper representing a noteworthy progress in QDs synthesis only appeared eleven years later with Murray et al. (10). This paper reported the synthesis of high-quality TOP/TOPO (trioctylphosphine/trioctylphosphine
oxide)-capped CdE (E=S, Se, Te) nanocrystals in organic media. From that time, some researches were focused on the development of new aqueous synthetic routes. In this regard, in 1996 arises the work of Rogach (32), describing a procedure for the aqueous synthesis of CdTe QDs using thiol molecules as stabilizers or capping agents, which could be considered the base for all the future studies in aqueous synthetic route. The polarity of the medium used in QDs studies has a strong effect on their photoluminescent properties because it determines the stability of capping ligands on the QD surface (33).
The aqueous synthesis conditions of CdTe semiconductor nanocrystals are widely described in many papers. Briefly, in a typical synthesis with a two-stage procedure, after dissolving the proper amount of cadmium precursor and thiol stabilizer (R-SH) in water, which kinetically protect the growth of the nanoparticles by covalent or ligand-ion interactions to create monolayer capped nanoparticles (34), it follows the adjustment of the pH up to the desired value. Then Te2-, previously obtained by reduction of tellurium powder, is added to the solution to form CdTe monomers. At least, by refluxing the reaction mixture at 100 °C, under open-air conditions, the monomers are converted into CdTe nanocrystals (35).
The generation of the reduced Te2- constitutes a critical step in the aqueous synthesis.
Some available procedures describe the gaseous generation of H2Te from Al2Te3, through
reaction with H2SO4 (32, 35-39). Then H2Te is transferred into the synthesis flask under a
N2 stream. Nevertheless, the increasing cost of Al2Te3 led to the search of an alternative
source of Te. Besides the electrochemical method, which is considered a good alternative (36, 40, 41), the most used approach is based on the reduction of Te powder with NaBH4
in water, first reported by Zhang et al (42). Some authors made some modifications to this approach and used KBH4 to form KHTe (43), or resorted to the reaction of Te with NaBH4
without heating obtaining in the supernatant NaHTe and sodium tetraborate precipitate (44-47), or to the reaction of Te and NaBH4 under heating (48, 49).
Most of the QD-based systems reported in literature, either for analytical, catalytic or bio-targeting purposes, request aqueous environments as reaction media and suitable QDs fluorescence, as above mentioned. So, it is important to improve the photoluminescence QY by passivating surface non-radiative recombination sites. Different surface modifications strategies have been reported, being the directly synthesis of water-soluble QDs one of the most often used. The synthesis with hydrophilic capping ligands, creating a thin layer at the nanocrystal surface can improve the QDs luminescence properties and stability due to the coordination of cadmium ions. Short-chain aqueous thiols, with other functional groups like carboxylic, amino, hydroxilic and so forth, have been successfully

![Fig. 3. Influence of QDs concentration on the analytical signal. [buffer]:](https://thumb-eu.123doks.com/thumbv2/123dok_br/15716309.1069944/125.892.466.815.103.307/fig-influence-qds-concentration-analytical-signal-buffer.webp)