arXiv:1211.6899v2 [hep-ex] 25 Mar 2013
EUROPEAN ORGANISATION FOR NUCLEAR RESEARCH (CERN)
CERN-PH-EP-2012-325
Submitted to: Phys. Lett. B
Measurement of angular correlations in Drell–Yan lepton pairs
to probe
Z/γ
∗
boson transverse momentum at
√s = 7
TeV
with the ATLAS detector
The ATLAS Collaboration
Abstract
A measurement of angular correlations in Drell–Yan lepton pairs via the
φ
∗η
observable is presented.
This variable probes the same physics as the
Z/γ
∗boson transverse momentum with a better
experi-mental resolution. The
Z/γ
∗→ e
+e
−and
Z/γ
∗→ µ
+µ
−decays produced in proton–proton collisions
at a centre-of-mass energy of
√
s = 7 TeV
are used. The data were collected with the ATLAS
detec-tor at the LHC and correspond to an integrated luminosity of
4.6
fb
−1. Normalised differential cross
sections as a function of
φ
∗ηare measured separately for electron and muon decay channels. These
channels are then combined for improved accuracy. The cross section is also measured double
dif-ferentially as a function of
φ
∗η
for three independent bins of the
Z
boson rapidity. The results are
compared to QCD calculations and to predictions from different Monte Carlo event generators. The
data are reasonably well described, in all measured
Z
boson rapidity regions, by resummed QCD
predictions combined with fixed-order perturbative QCD calculations or by some Monte Carlo event
generators. The measurement precision is typically better by one order of magnitude than present
theoretical uncertainties.
Measurement of angular correlations in Drell–Yan lepton pairs to probe
Z/γ
∗boson
transverse momentum at
√
s = 7 TeV with the ATLAS detector
The ATLAS Collaboration
Abstract
A measurement of angular correlations in Drell–Yan lepton pairs via the φ∗
η observable is presented. This variable probes
the same physics as the Z/γ∗ boson transverse momentum with a better experimental resolution. The Z/γ∗ → e+e−
and Z/γ∗ → µ+µ− decays produced in proton–proton collisions at a centre-of-mass energy of √s = 7 TeV are used.
The data were collected with the ATLAS detector at the LHC and correspond to an integrated luminosity of 4.6 fb−1.
Normalised differential cross sections as a function of φ∗
ηare measured separately for electron and muon decay channels.
These channels are then combined for improved accuracy. The cross section is also measured double differentially as a
function of φ∗
η for three independent bins of the Z boson rapidity. The results are compared to QCD calculations and
to predictions from different Monte Carlo event generators. The data are reasonably well described, in all measured Z boson rapidity regions, by resummed QCD predictions combined with fixed-order perturbative QCD calculations or by some Monte Carlo event generators. The measurement precision is typically better by one order of magnitude than present theoretical uncertainties.
Keywords:
Z Boson, Differential Cross Section, Perturbative QCD, Event Generators, Monte Carlo Models
1. Introduction
In hadron collisions at TeV energies the vector bosons
W and Z/γ∗ are copiously produced with non-zero
mo-mentum transverse to the beam direction (pT) because
of radiation of quarks and gluons from the initial-state
partons. In this context the signatures Z/γ∗ → e+e−
and Z/γ∗ → µ+µ− provide an ideal testing ground for
QCD due to the absence of colour flow between the initial
and final state [1–3]. The study of the low pZ
T spectrum
(pZ
T < mZ), which dominates the cross section, has
im-portant implications on the understanding of Higgs boson production since the transverse-momentum resummation
formalism required to describe the Z/γ∗ boson cross
sec-tion is valid also for the Higgs boson [4–7]. A precise
un-derstanding of the pZ
Tspectrum is also necessary to further
improve the modelling of W boson production in QCD cal-culations and Monte Carlo (MC) event generators, since the measurement of the W mass is directly affected by
uncertainties in the pW
T shape [8,9].
The transverse momentum spectra of W and Z/γ∗
bosons produced via the Drell–Yan mechanism have been
extensively studied by the Tevatron collaborations [10–14]
and, recently, also by the LHC experiments [15–17].
How-ever, the precision of direct measurements of the Z/γ∗
spectrum at low pZ
T at the LHC and the Tevatron is
lim-ited by the experimental resolution and systematic uncer-tainties rather than by the size of the available data sam-ples. This limitation affects the choice of bin widths and
the ultimate precision of the pZ
Tspectrum. In recent years,
additional observables with better experimental resolution and smaller sensitivity to experimental systematic
uncer-tainties have been investigated [18–21]. The optimal
ex-perimental observable to probe the low-pZ
Tdomain of Z/γ∗
production was found to be φ∗
η which is defined [20] as:
φ∗
η≡ tan(φacop/2) · sin(θη∗) , (1)
where φacop ≡ π − ∆φ, ∆φ being the azimuthal
open-ing angle between the two leptons, and the angle θ∗
η is
a measure of the scattering angle of the leptons with re-spect to the proton beam direction in the rest frame of
the dilepton system. The angle θ∗
η is defined [20] by
cos(θ∗
η) ≡ tanh[(η− − η+)/2] where η− and η+ are the
pseudorapidities1of the negatively and positively charged
lepton, respectively. Therefore, φ∗
η depends exclusively on
the directions of the two lepton tracks, which are better
measured than their momenta. The φ∗
η variable is
posi-tive by definition. It is correlated to the quantity pZ
T/mℓℓ,
where mℓℓ is the invariant mass of the lepton pair, and
therefore probes the same physics as the transverse
mo-mentum pZ
T [22]. Values of φ∗η ranging from 0 to 1 probe
1ATLAS uses a right-handed coordinate system with its origin at
the nominal pp interaction point (IP) in the centre of the detector and the z-axis along the beam pipe. The x-axis points from the IP to the centre of the LHC ring, and the y-axis points upward. Cylindrical coordinates (r, φ) are used in the transverse plane, φ being the azimuthal angle around the beam pipe. The pseudorapidity is defined in terms of the polar angle θ as η = − ln tan(θ/2) and the
the pZ
Tdistribution mainly up to ∼ 100 GeV. The φ∗η
distri-bution of Z/γ∗bosons has been measured in three bins of
the Z boson rapidity (yZ) by the DØ Collaboration using
7.3 fb−1 of p¯p collisions at√s = 1.96 TeV [23].
This Letter presents a measurement of the normalised
φ∗
η distribution in bins of the Z boson rapidity yZ using
4.6 fb−1of pp interactions collected at√s = 7 TeV in 2011
by the ATLAS detector. The normalised differential cross section is measured in both the electron and muon chan-nels in the fiducial lepton acceptance defined by the lepton
(ℓ = e, µ) transverse momentum pℓ
T> 20 GeV, the lepton
pseudorapidity |ηℓ| < 2.4 and the invariant mass of the
lepton pair 66 GeV < mℓℓ< 116 GeV. Correction factors
allowing the extrapolation of the cross section from the fiducial letpton acceptance to the full lepton acceptance,
restricted to 66 GeV < mℓℓ< 116 GeV, are also presented.
The reconstructed φ∗
η distribution, after background
sub-traction, is corrected for all detector effects. The measure-ments are reported with respect to three distinct reference points at particle level regarding QED final-state
radia-tion (FSR) correcradia-tions. The true dilepton mass mℓℓ and
φ∗
η are defined by the final-state leptons after QED FSR
(“bare” leptons), or by recombining them with radiated
photons within a cone of ∆R = p(∆η)2+ (∆φ)2 = 0.1
(“dressed” leptons), or by the final-state leptons before QED FSR (“Born leptons”). The bare definition does not require any QED FSR correction for muons, whilst the dressed definition is the closest to the experimental mea-surement for electrons. The Born definition corresponds to the full correction for QED FSR effects, so that it can be used for the combination of the electron and muon chan-nels. The combination of the electron and muon channels is compared to QCD predictions obtained by matching re-summed and fixed order QCD calculations, as well as to the predictions of MC event generators implementing a parton shower (PS) algorithm.
2. QCD predictions
Non-zero pZ
T is mainly generated through the emission
of partons in the initial state. In the high pZ
T region
(pZ
T&mZ) the spectrum is determined primarily by hard
parton emission. Perturbative QCD calculations, based on the truncation of the perturbative series at a fixed
or-der in αs, are theoretically justified and provide reliable
predictions. The inclusive cross-section prediction is finite
but the differential cross section diverges as pZ
Tapproaches
zero. In this limit (pZ
T ≪ mZ) the convergence of the
fixed-order expansion is spoiled by the presence of powers of large logarithmic terms which have to be resummed to restore the convergence.
Differential cross sections calculated to O(α2
s) are
avail-able for Z/γ∗ production through the Fewz [24,25] and
Dynnlo [26, 27] programs. The ResBos [28–30]
gener-ator resums the leading contributions up to next-to-next-to-leading logarithms (NNLL) and matches the result to
fixed-order calculations at O(αs). This is corrected to
O(α2
s) using a k-factor depending on pZTand yZ[31]. In
ad-dition, the ResBos generator includes a non-perturbative
form factor that needs to be determined from data [32].
A slightly different approach has been proposed recently to describe the Tevatron Run II data by matching NNLL
accuracy to MCFM calculations [33], with no apparent
need for non-perturbative contributions [22,34].
Similarly to resummed calculations, PS algorithms such
as those used in Pythia [35] and Herwig [36] provide an
all-order approximation of parton radiation in the soft and collinear region through the iterative splitting and
radia-tion of partons. The Powheg [37–40] and Mc@nlo [41]
event generators combine next-to-leading order (NLO) QCD matrix elements with a PS algorithm to produce differential cross-section predictions that are finite for all
pZ
T. The Alpgen [42] and Sherpa [43] event generators
implement tree-level matrix elements for the generation of multiple hard partons in association with the weak boson. They are matched to parton showers either by a PS
algo-rithm using re-weighting procedures [44, 45] or through a
veto [42], in order to avoid the double counting of QCD
emissions in the matrix element and the parton shower. 3. The ATLAS detector
The ATLAS detector [46] is a multi-purpose particle
physics detector operating at one of the beam interaction points of the LHC. It covers nearly the entire solid an-gle around the collision region and consists of an inner tracking detector (inner detector or ID) surrounded by a thin superconducting solenoid providing a 2 T axial mag-netic field, electromagmag-netic and hadronic calorimeters, and a muon spectrometer (MS).
Measurements in the ID are performed with silicon pixel and microstrip detectors covering |η| < 2.5. A straw-tube tracking detector follows radially and covers the range |η| < 2.0. The lead/liquid-argon electromagnetic calorimeter is divided into barrel (|η| < 1.5) and end-cap (1.4 < |η| < 3.2) sections. The hadronic calorime-ter is based on steel/scintillating tiles in the central re-gion (|η| < 1.7), and is extended to |η| = 4.9 by end-cap and forward calorimeters which use liquid argon. The MS comprises separate trigger and high-precision tracking chambers to measure the deflection of muons in a magnetic field generated by three large superconducting toroids ar-ranged with an eightfold azimuthal coil symmetry around the calorimeters. The high-precision chambers cover a range of |η| < 2.7. The muon trigger system covers the range |η| < 2.4 with resistive plate chambers in the barrel, and thin gap chambers in the endcap regions.
4. Event simulation
MC simulations are used to calculate efficiencies and
acceptances for the Z/γ∗→ ℓ+ℓ− signal processes and to
unfold the measured φ∗
for different levels of QED FSR. The Powheg MC
gener-ator is used with CT10 [47] parton distribution functions
(PDFs) to generate both the Z/γ∗ → e+e− and Z/γ∗ →
µ+µ− signal events. It is interfaced to Pythia 6.4 with
the AUET2B-CTEQ6L1 tune [48] to simulate the
par-ton shower and the underlying event. Generated events
are re-weighted as a function of pZ
Tto the predictions from
ResBos, which describes the pZ
T spectrum more
accu-rately [15]. Simulated events are also used to estimate
background contributions. The electroweak background
processes W → ℓν and Z/γ∗→ τ+τ− are generated using
Pythia 6.4. The production of t¯t events is modelled using
Mc@nlo and diboson processes are simulated using
Her-wig. The event generators are interfaced to Photos [49]
to simulate QED FSR for all of the simulated samples, ex-cept Sherpa which is interfaced to an implementation of
the YFS algorithm [50,51].
Multiple interactions per bunch crossing (pile-up) are accounted for by overlaying simulated minimum bias events. To match the observed instantaneous luminosity profile, the simulated events are re-weighted to yield the same distribution of the number of interactions per bunch crossing as measured in the data. The response of the ATLAS detector to the generated particles is modelled
us-ing Geant4 [52], and the fully simulated events [53] are
passed through the same reconstruction chain as the data. Simulated event samples are corrected for differences with respect to the data in the trigger efficiencies, lepton recon-struction and identification efficiencies as well as in energy (momentum) scale and resolution. The efficiencies are de-termined by using a tag-and-probe method similar to the
one described in Section 4.3 of Ref. [54] based on
recon-structed Z and W events, while the energy resolution and scale corrections are obtained from a fit to the observed Z boson line shape.
5. Event reconstruction, selection and background estimation
Events recorded during periods with stable beam condi-tions and passing detector and data-quality requirements are selected. At least one primary vertex reconstructed from at least three tracks is required in each event.
Events in the electron channel are selected online by requiring a single electron candidate with a threshold in
transverse momentum pT that was increased during the
data-taking from 20 GeV to 22 GeV in response to in-creased LHC luminosity. Electrons are reconstructed from a cluster of cells with significant energy deposits in the electromagnetic calorimeter matched to an inner detector track. Electron reconstruction uses track refitting with a Gaussian-sum filter to be less sensitive to bremsstrahlung losses and improve the estimates of the electron track
pa-rameters [55, 56]. The typical angular resolutions in the
electron direction measurements are 0.6 mrad for φ and
0.0012 for η. The highest and second highest pTelectrons
are required to have a transverse momentum pe
T> 25 GeV
and pe
T > 20 GeV, respectively. The electron
pseudora-pidity must satisfy |ηe| < 2.4 with the calorimeter
bar-rel/endcap transition region 1.37 < |ηe| < 1.52 excluded.
Electrons are required to pass “medium” identification cri-teria based on shower shape and track-quality variables, as
described in Refs. [57,58]. The criteria are re-optimised for
both higher pile-up conditions and higher instantaneous luminosity in 2011.
Events in the muon channel are selected online by a
trig-ger requiring a single muon candidate with pµT> 18 GeV.
Muons are identified as tracks reconstructed in the muon spectrometer matched to tracks reconstructed in the
in-ner detector and are required to have pµT > 20 GeV and
|ηµ| < 2.4. Only isolated muons are selected by
re-quiring the scalar sum of the pT of the tracks within a
cone ∆R = 0.2 around the muon to be less than 10% of
the muon pT. Muons are required to have a
longitudi-nal impact parameter with respect to the primary vertex less than 10 mm to reduce contributions from cosmic-ray muons and in-time pile-up. In addition, the transverse im-pact parameter of the track with respect to the primary vertex divided by its uncertainty must be smaller than ten to reduce non-prompt muon backgrounds. The typical an-gular resolutions in the muon direction measurements are 0.4 mrad for φ and 0.001 for η.
Z/γ∗→ ℓ+ℓ−events are selected by requiring two
oppo-sitely charged same-flavour leptons with an invariant mass
66 GeV < mℓℓ < 116 GeV. After these selection
require-ments 1.22 · 106dielectron and 1.69 · 106dimuon candidate
events are found in data.
Background contributions from Z/γ∗ → τ+τ−, W →
ℓν, t¯t and diboson production are estimated using MC
simulations. The cross sections are normalised to
next-to-next-to-leading-order (NNLO) predictions for Z/γ∗ and
W production using Fewz, NLL-NLO predictions for t¯t
production [54] and NLO predictions for diboson
produc-tion [59]. For both the e+e−and µ+µ−channels, the main
background at high φ∗
η values arises from t¯t and diboson
production.
At low φ∗
η values the background is dominated by
multi-jet production, where a multi-jet is falsely identified as a primary e or µ. In this case the background is determined by data-driven methods. A data event sample dominated by jets faking electrons or muons in the final state is employed to determine the shape of the multi-jet background. For
the e+e− channel, the multi-jet sample is obtained from
electrons failing the medium identification criteria. In or-der to assess systematic uncertainties in the shape of the multi-jet background, an alternative multi-jet control sam-ple was also selected using non-isolated electrons. For the
µ+µ− channel, the multi-jet sample is extracted by
in-verting the isolation requirement on muons. The uncer-tainty in its shape was studied by comparing same-sign and opposite-sign dimuon events. The normalisation of this multi-jet background template is determined by ad-justing the sum of it and other background and signal MC predictions to data as a function of the invariant mass
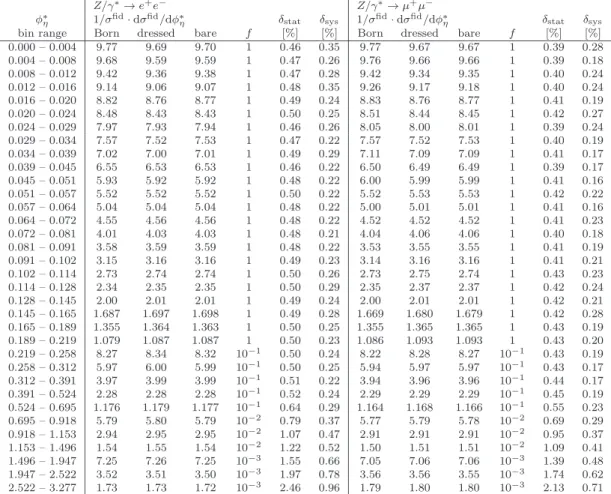
Table 1: The measured normalised differential cross section 1/σfid· dσfid/dφ∗
ηin bins of φ∗η for Z/γ∗→ e+e−and Z/γ∗→ µ+µ−channels.
The cross sections, which are to be multiplied for convenience by a factor f , are reported with respect to the three different treatments of QED
final-state radiation. The relative statistical (δstat) and total systematic (δsys) uncertainties are given in percent. The overall point-to-point
uncorrelated additional uncertainty in QED FSR of 0.3% is not included.
Z/γ∗→ e+e− Z/γ∗→ µ+µ−
φ∗
η 1/σfid· dσfid/dφ∗η δstat δsys 1/σfid· dσfid/dφ∗η δstat δsys
bin range Born dressed bare f [%] [%] Born dressed bare f [%] [%]
0.000 – 0.004 9.77 9.69 9.70 1 0.46 0.35 9.77 9.67 9.67 1 0.39 0.28 0.004 – 0.008 9.68 9.59 9.59 1 0.47 0.26 9.76 9.66 9.66 1 0.39 0.18 0.008 – 0.012 9.42 9.36 9.38 1 0.47 0.28 9.42 9.34 9.35 1 0.40 0.24 0.012 – 0.016 9.14 9.06 9.07 1 0.48 0.35 9.26 9.17 9.18 1 0.40 0.24 0.016 – 0.020 8.82 8.76 8.77 1 0.49 0.24 8.83 8.76 8.77 1 0.41 0.19 0.020 – 0.024 8.48 8.43 8.43 1 0.50 0.25 8.51 8.44 8.45 1 0.42 0.27 0.024 – 0.029 7.97 7.93 7.94 1 0.46 0.26 8.05 8.00 8.01 1 0.39 0.24 0.029 – 0.034 7.57 7.52 7.53 1 0.47 0.22 7.57 7.52 7.53 1 0.40 0.19 0.034 – 0.039 7.02 7.00 7.01 1 0.49 0.29 7.11 7.09 7.09 1 0.41 0.17 0.039 – 0.045 6.55 6.53 6.53 1 0.46 0.22 6.50 6.49 6.49 1 0.39 0.17 0.045 – 0.051 5.93 5.92 5.92 1 0.48 0.22 6.00 5.99 5.99 1 0.41 0.16 0.051 – 0.057 5.52 5.52 5.52 1 0.50 0.22 5.52 5.53 5.53 1 0.42 0.22 0.057 – 0.064 5.04 5.04 5.04 1 0.48 0.22 5.00 5.01 5.01 1 0.41 0.16 0.064 – 0.072 4.55 4.56 4.56 1 0.48 0.22 4.52 4.52 4.52 1 0.41 0.23 0.072 – 0.081 4.01 4.03 4.03 1 0.48 0.21 4.04 4.06 4.06 1 0.40 0.18 0.081 – 0.091 3.58 3.59 3.59 1 0.48 0.22 3.53 3.55 3.55 1 0.41 0.19 0.091 – 0.102 3.15 3.16 3.16 1 0.49 0.23 3.14 3.16 3.16 1 0.41 0.21 0.102 – 0.114 2.73 2.74 2.74 1 0.50 0.26 2.73 2.75 2.74 1 0.43 0.23 0.114 – 0.128 2.34 2.35 2.35 1 0.50 0.29 2.35 2.37 2.37 1 0.42 0.24 0.128 – 0.145 2.00 2.01 2.01 1 0.49 0.24 2.00 2.01 2.01 1 0.42 0.21 0.145 – 0.165 1.687 1.697 1.698 1 0.49 0.28 1.669 1.680 1.679 1 0.42 0.28 0.165 – 0.189 1.355 1.364 1.363 1 0.50 0.25 1.355 1.365 1.365 1 0.43 0.19 0.189 – 0.219 1.079 1.087 1.087 1 0.50 0.23 1.086 1.093 1.093 1 0.43 0.20 0.219 – 0.258 8.27 8.34 8.32 10−1 0.50 0.24 8.22 8.28 8.27 10−1 0.43 0.19 0.258 – 0.312 5.97 6.00 5.99 10−1 0.50 0.25 5.94 5.97 5.97 10−1 0.43 0.17 0.312 – 0.391 3.97 3.99 3.99 10−1 0.51 0.22 3.94 3.96 3.96 10−1 0.44 0.17 0.391 – 0.524 2.28 2.28 2.28 10−1 0.52 0.24 2.29 2.29 2.29 10−1 0.45 0.19 0.524 – 0.695 1.176 1.179 1.177 10−1 0.64 0.29 1.164 1.168 1.166 10−1 0.55 0.23 0.695 – 0.918 5.79 5.80 5.79 10−2 0.79 0.37 5.77 5.79 5.78 10−2 0.69 0.29 0.918 – 1.153 2.94 2.95 2.95 10−2 1.07 0.47 2.91 2.91 2.91 10−2 0.95 0.37 1.153 – 1.496 1.54 1.55 1.54 10−2 1.22 0.52 1.50 1.51 1.51 10−2 1.09 0.41 1.496 – 1.947 7.25 7.26 7.25 10−3 1.55 0.66 7.05 7.06 7.06 10−3 1.39 0.48 1.947 – 2.522 3.52 3.51 3.50 10−3 1.97 0.78 3.56 3.56 3.55 10−3 1.74 0.62 2.522 – 3.277 1.73 1.73 1.72 10−3 2.46 0.96 1.79 1.80 1.80 10−3 2.13 0.71
spectrum of the dilepton pair. An extended dilepton mass
range, 50 GeV < mℓℓ< 150 GeV (200 GeV for electrons),
was employed to better constrain the off-resonance region and improve the accuracy of the multi-jet background nor-malisation.
The total fraction of background events is (0.61±0.31)%
in the e+e−channel and (0.56 ±0.28)% in the µ+µ−
chan-nel. The multi-jet background represents ∼ 50% of the
to-tal background in both channels and dominates at low φ∗
η
values. An irreducible background may also arise from the production of a lepton pair via photon-photon interactions,
γγ → ℓ+ℓ−. This contribution was evaluated at leading
order using FEWZ 3.1 [24,60] and the MRST2004qed [61]
PDF, currently the only available PDF set containing a description of the QED part of the proton. According to the LO cross section calculated in the fiducial lepton accep-tance, the fraction of photon-induced events is expected to be below 0.1%, with an uncertainty of 50%. This contri-bution is six times lower than the sum of other background contributions and is therefore neglected.
6. Cross-section measurement and systematic un-certainties
The differential cross section is evaluated in bins of φ∗
η,
or of (φ∗
η, yZ), from the number of observed data events
in each bin after subtraction of the estimated number of background events.
A bin-by-bin correction is used to correct the observed data for detector acceptances and inefficiencies, as well as for QED FSR. The correction factors are determined using signal MC events. For the chosen bin widths the purity, defined as the fraction of simulated events reconstructed
in a φ∗
η bin which have generator-level φ∗η in the same bin,
is always more than 83% and reaches 98% in the highest
φ∗
η bins. In each bin, the data are normalised to the cross
section integrated over the fiducial acceptance region. An analysis of systematic uncertainties was performed, in which the sensitivity of the measurements to variations in the efficiencies and energy scales of the detector com-ponents and to the details of the correction procedure is tested. The systematic uncertainties in the measured cross section are determined by repeating the analysis after ap-plying appropriate variations for each source of systematic
uncertainty to the simulated samples. The systematic
un-certainties which are correlated between φ∗
η bins are listed
below.
• Uncertainties in the estimation of the number of
back-ground events from multi-jet, W → ℓν and Z/γ∗ →
τ+τ− decays, t¯t and diboson processes yield values
of up to 0.3% in the e+e− and µ+µ− channels, when
propagated to the normalised differential cross sec-tion.
• Possible mis-modelling of the angular resolution of tracking detectors leads to uncertainties of up to 0.3% (0.2%) on the normalised differential cross section in
the e+e− (µ+µ− ) channel.
• The dependence of the bin-by-bin correction factors
on the shape of the assumed φ∗
η distribution was
tested by re-weighting simulated events to the
mea-sured φ∗
η cross section. An iterative Bayesian
unfold-ing technique [62] was employed as an alternative
ap-proach to assess systematic uncertainties. The un-certainty in the correction procedure is found to be smaller than 0.1% in both channels and for the full
φ∗
η range.
• As the definition of the φ∗
η variable is based on the
lepton angles, the normalised differential cross sec-tion depends only weakly on uncertainties in the lep-ton energy/momentum scale and resolution. When propagated to the normalised differential cross sec-tion, these uncertainties amount to less than 0.1% and
0.03% in the e+e− and µ+µ− channels, respectively.
• Uncertainties arising from the mis-modelling of lepton identification efficiencies and trigger efficiencies in the simulation amount respectively to 0.05% (0.03%) and
0.04% (0.02%) in the e+e− (µ+µ−) channel.
• Pile-up has only a weak influence on this measurement and results in an uncertainty of at most 0.05% on the normalised differential cross section.
A second class of systematic uncertainties, listed below,
are considered uncorrelated across φ∗
η bins.
• Uncertainties on the bin-by-bin correction factors arising from the MC sample statistics are 0.2%
(0.13%) at low φ∗
η in the e+e− (µ+µ−) channel,
in-creasing to 0.9% (0.6%) in the highest φ∗
η bins.
• Possible local biases in angular measurements (φ, η) by tracking detectors yield an estimated constant un-certainty of 0.1% on the normalised differential cross section. The local effect of these biases allows bin-to-bin correlations to be neglected. The impact of this assumption on the combination of electron and muon channel results is small.
• A conservative systematic uncertainty of 0.3% due
to φ∗
η-dependent modelling of QED FSR is assigned
by comparing predictions from Photos [49] and
from the Sherpa implementation of the YFS
algo-rithm [50, 51]. This comparison provides the size of
the uncertainty but however does not allow the shape
of the φ∗
η dependence to be estimated. This
uncer-tainty was therefore treated as uncorrelated across φ∗
η
bins. The uncertainty is assumed to hold for cross sections at Born, dressed and bare levels and for both electron and muon channel measurements. It there-fore does not affect the combination of them.
The total systematic uncertainty on each data point is formed by adding the individual contributions in quadra-ture. η *
φ
/d
fidσ
. d
fidσ
1/
-2 10 -1 10 1 10 η *φ
/d
fidσ
. d
fidσ
1/
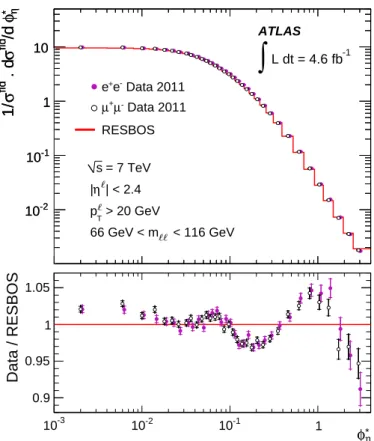
-2 10 -1 10 1 10 Data 2011 -e + e Data 2011 -µ + µ RESBOS = 7 TeV s | < 2.4 η | > 20 GeV T p < 116 GeV 66 GeV < m ATLAS -1 L dt = 4.6 fb∫
η * φ -3 10 10-2 10-1 1 Data / RESBOS 0.9 0.95 1 1.05 ℓ ℓ ℓℓFigure 1: The measured normalised differential cross section 1/σfid·
dσfid/dφ∗
η as a function of φ∗η for Z/γ∗→ e+e− (closed dots) and
Z/γ∗ → µ+µ− (open dots) channels. The measurements are
com-pared to ResBos predictions represented by a line. The ratio of measured cross sections to ResBos predictions is presented in the bottom panel. The measurements are displaced horizontally for bet-ter visibility. The inner and oubet-ter error bars on the data points represent the statistical and total uncertainties, respectively. The uncertainty due to QED FSR is included in the total uncertainties.
7. Results and discussion
The normalised differential cross sections measured for
Z/γ∗→ e+e− and Z/γ∗→ µ+µ− production in the
fidu-cial acceptance are presented in Table 1. The
bare reference points at particle level regarding QED FSR. The QED FSR corrections for the three levels are calcu-lated using Photos. The measured cross sections defined
at the Z/γ∗ Born level are shown in Fig. 1 for the e+e−
and µ+µ− channels and are compared to predictions from
ResBos.
The normalised differential cross sections measured in the fiducial acceptance for the two channels are combined
using a χ2minimisation method which takes into account
the point-to-point correlated and uncorrelated systematic
uncertainties [63–65] and correlations between electron
and muon channels. The procedure allows a model inde-pendent check of the electron and muon data consistency and leads to a significant reduction of the correlated un-certainties.
Table 2: The combined normalised differential cross section 1/σfid·
dσfid/dφ∗
ηin bins of φ∗ηat Born level. The statistical (δstat) and total
systematic (δsys) uncertainties are given in percent. The normalised
differential cross section extrapolated to the full lepton acceptance
1/σtot·dσtot/dφ∗
ηis obtained at Born level by multiplication with the
inverse acceptance correction factor A−1
c . The uncertainty δ(A−1c )
on this acceptance correction factor is also given in percent. The overall point-to-point uncorrelated additional uncertainty in QED FSR of 0.3% is not included.
φ∗
η 1/σfid· dσfid/dφ∗η δstat δsys A−1c δ(A−1c )
bin range [%] [%] [%] 0.000 – 0.004 9.77 0.30 0.21 1.06 3.8 0.004 – 0.008 9.73 0.30 0.20 1.06 3.0 0.008 – 0.012 9.41 0.31 0.18 1.06 3.7 0.012 – 0.016 9.21 0.31 0.22 1.06 2.4 0.016 – 0.020 8.82 0.31 0.16 1.05 2.5 0.020 – 0.024 8.49 0.32 0.18 1.05 2.2 0.024 – 0.029 8.01 0.29 0.18 1.05 1.8 0.029 – 0.034 7.56 0.30 0.14 1.04 2.4 0.034 – 0.039 7.07 0.31 0.15 1.04 2.2 0.039 – 0.045 6.52 0.30 0.14 1.03 2.2 0.045 – 0.051 5.97 0.31 0.13 1.02 2.8 0.051 – 0.057 5.52 0.32 0.16 1.01 2.1 0.057 – 0.064 5.02 0.31 0.13 1.01 1.9 0.064 – 0.072 4.54 0.31 0.18 1.00 2.0 0.072 – 0.081 4.03 0.31 0.13 0.99 1.8 0.081 – 0.091 3.56 0.31 0.15 0.99 1.0 0.091 – 0.102 3.15 0.32 0.16 0.98 1.1 0.102 – 0.114 2.731 0.32 0.17 0.97 1.3 0.114 – 0.128 2.347 0.32 0.19 0.97 1.3 0.128 – 0.145 1.996 0.32 0.16 0.96 1.7 0.145 – 0.165 1.677 0.32 0.19 0.95 2.0 0.165 – 0.189 1.355 0.32 0.16 0.95 2.7 0.189 – 0.219 1.084 0.32 0.15 0.94 2.3 0.219 – 0.258 8.24 · 10−1 0.33 0.15 0.94 2.9 0.258 – 0.312 5.95 · 10−1 0.33 0.14 0.93 2.9 0.312 – 0.391 3.96 · 10−1 0.33 0.14 0.92 3.4 0.391 – 0.524 2.282 · 10−1 0.34 0.15 0.92 3.5 0.524 – 0.695 1.169 · 10−1 0.42 0.18 0.92 4.4 0.695 – 0.918 5.78 · 10−2 0.52 0.23 0.93 4.0 0.918 – 1.153 2.92 · 10−2 0.71 0.29 0.94 5.3 1.153 – 1.496 1.52 · 10−2 0.81 0.33 0.98 10.5 1.496 – 1.947 7.13 · 10−3 1.04 0.40 1.04 10.3 1.947 – 2.522 3.54 · 10−3 1.30 0.49 1.11 17.5 2.522 – 3.277 1.77 · 10−3 1.61 0.58 1.19 16.2
The uncertainties due to the unfolding procedure, the pile-up, and QED FSR are considered to be completely
correlated between the e+e− and µ+µ− channels. The
minimisation yields a total χ2 per degree of freedom
(ndof) of χ2/ndof = 33.2/34, indicating a good
consis-tency between the electron and muon data. Measured val-ues of the combined normalised differential cross section
1/σfid· dσfid/dφ∗
η within the fiducial lepton acceptance are
presented in Table 2. At lower φ∗
η values the statistical
and systematic uncertainties are of the same order, whilst
for large φ∗
ηvalues statistical uncertainties are dominating.
The acceptance correction factors Ac needed to
extrapo-late the measurement to the full lepton acceptance are determined using the Powheg simulation with the CT10
PDF set and reweighted as a function of pZ
T to ResBos
predictions. The uncertainty in Ac is estimated from the
extreme differences among predictions obtained with Res-Bos, Mc@nlo, Sherpa, Alpgen, Herwig and Powheg
interfaced to Pythia8. Uncertainties in Acresulting from
PDF uncertainties are below 1%.
η *
φ
-3 10 10-2 10-1 1Data (Prediction) / RESBOS
0.8 0.9 1 1.1 1.2 η *φ
-3 10 10-2 10-1 1Data (Prediction) / RESBOS
0.8 0.9 1 1.1 1.2 Data 2011 -µ + µ + -e + e RESBOS A. Banfi et al. = 7 TeV s | < 2.4 η | > 20 GeV T p < 116 GeV 66 GeV < m ATLAS -1 L dt = 4.6 fb∫
ℓ ℓ ℓℓ η *φ
-3 10 10-2 10-1 1Data (Prediction) / RESBOS
0.8 0.9 1 1.1 1.2 η *φ
-3 10 10-2 10-1 1Data (Prediction) / RESBOS
0.8 0.9 1 1.1 1.2 Data 2011 -µ + µ + -e + e RESBOS ) s α FEWZ 2.1 O( 2 = 7 TeV s | < 2.4 η | > 20 GeV T p < 116 GeV 66 GeV < m ATLAS -1 L dt = 4.6 fb∫
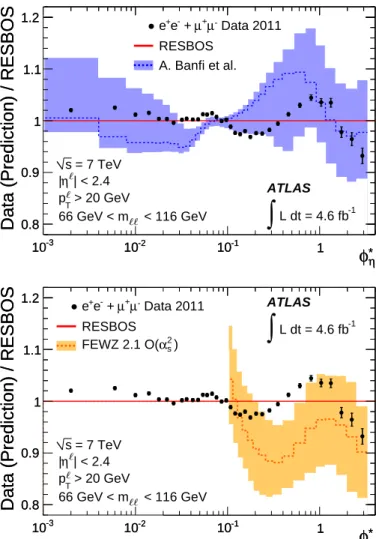
ℓ ℓ ℓℓFigure 2: The ratio of the combined normalised differential cross
section 1/σfid· dσfid/dφ∗
ηto ResBos predictions as a function of φ∗η.
The inner and outer error bars on the data points represent the sta-tistical and total uncertainties, respectively. The uncertainty due to QED FSR is included in the total uncertainties. The measurements are also compared to predictions, which are represented by a dashed
line, from Ref. [22] and from Fewz in the top and bottom panels,
respectively. Uncertainties associated with these two calculations are represented by shaded bands. The prediction from Fewz is only
presented for φ∗
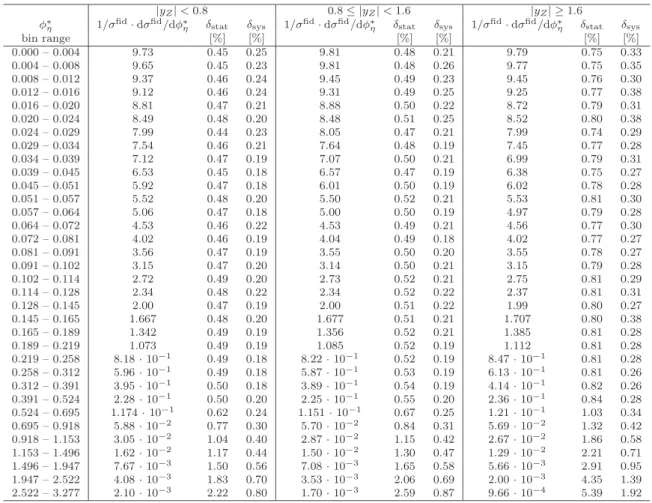
Table 3: The combined normalised differential cross section 1/σfid· dσfid/dφ∗
η in bins of φ∗ηand in three |yZ| ranges. The statistical (δstat)
and total systematic (δsys) uncertainties are given in percent. The overall point-to-point uncorrelated additional uncertainty in QED FSR of
0.3% is not included.
|yZ| < 0.8 0.8 ≤ |yZ| < 1.6 |yZ| ≥ 1.6
φ∗
η 1/σfid· dσfid/dφ∗η δstat δsys 1/σfid· dσfid/dφ∗η δstat δsys 1/σfid· dσfid/dφ∗η δstat δsys
bin range [%] [%] [%] [%] [%] [%] 0.000 – 0.004 9.73 0.45 0.25 9.81 0.48 0.21 9.79 0.75 0.33 0.004 – 0.008 9.65 0.45 0.23 9.81 0.48 0.26 9.77 0.75 0.35 0.008 – 0.012 9.37 0.46 0.24 9.45 0.49 0.23 9.45 0.76 0.30 0.012 – 0.016 9.12 0.46 0.24 9.31 0.49 0.25 9.25 0.77 0.38 0.016 – 0.020 8.81 0.47 0.21 8.88 0.50 0.22 8.72 0.79 0.31 0.020 – 0.024 8.49 0.48 0.20 8.48 0.51 0.25 8.52 0.80 0.38 0.024 – 0.029 7.99 0.44 0.23 8.05 0.47 0.21 7.99 0.74 0.29 0.029 – 0.034 7.54 0.46 0.21 7.64 0.48 0.19 7.45 0.77 0.28 0.034 – 0.039 7.12 0.47 0.19 7.07 0.50 0.21 6.99 0.79 0.31 0.039 – 0.045 6.53 0.45 0.18 6.57 0.47 0.19 6.38 0.75 0.27 0.045 – 0.051 5.92 0.47 0.18 6.01 0.50 0.19 6.02 0.78 0.28 0.051 – 0.057 5.52 0.48 0.20 5.50 0.52 0.21 5.53 0.81 0.30 0.057 – 0.064 5.06 0.47 0.18 5.00 0.50 0.19 4.97 0.79 0.28 0.064 – 0.072 4.53 0.46 0.22 4.53 0.49 0.21 4.56 0.77 0.30 0.072 – 0.081 4.02 0.46 0.19 4.04 0.49 0.18 4.02 0.77 0.27 0.081 – 0.091 3.56 0.47 0.19 3.55 0.50 0.20 3.55 0.78 0.27 0.091 – 0.102 3.15 0.47 0.20 3.14 0.50 0.21 3.15 0.79 0.28 0.102 – 0.114 2.72 0.49 0.20 2.73 0.52 0.21 2.75 0.81 0.29 0.114 – 0.128 2.34 0.48 0.22 2.34 0.52 0.22 2.37 0.81 0.31 0.128 – 0.145 2.00 0.47 0.19 2.00 0.51 0.22 1.99 0.80 0.27 0.145 – 0.165 1.667 0.48 0.20 1.677 0.51 0.21 1.707 0.80 0.38 0.165 – 0.189 1.342 0.49 0.19 1.356 0.52 0.21 1.385 0.81 0.28 0.189 – 0.219 1.073 0.49 0.19 1.085 0.52 0.19 1.112 0.81 0.28 0.219 – 0.258 8.18 · 10−1 0.49 0.18 8.22 · 10−1 0.52 0.19 8.47 · 10−1 0.81 0.28 0.258 – 0.312 5.96 · 10−1 0.49 0.18 5.87 · 10−1 0.53 0.19 6.13 · 10−1 0.81 0.26 0.312 – 0.391 3.95 · 10−1 0.50 0.18 3.89 · 10−1 0.54 0.19 4.14 · 10−1 0.82 0.26 0.391 – 0.524 2.28 · 10−1 0.50 0.20 2.25 · 10−1 0.55 0.20 2.36 · 10−1 0.84 0.28 0.524 – 0.695 1.174 · 10−1 0.62 0.24 1.151 · 10−1 0.67 0.25 1.21 · 10−1 1.03 0.34 0.695 – 0.918 5.88 · 10−2 0.77 0.30 5.70 · 10−2 0.84 0.31 5.69 · 10−2 1.32 0.42 0.918 – 1.153 3.05 · 10−2 1.04 0.40 2.87 · 10−2 1.15 0.42 2.67 · 10−2 1.86 0.58 1.153 – 1.496 1.62 · 10−2 1.17 0.44 1.50 · 10−2 1.30 0.47 1.29 · 10−2 2.21 0.71 1.496 – 1.947 7.67 · 10−3 1.50 0.56 7.08 · 10−3 1.65 0.58 5.66 · 10−3 2.91 0.95 1.947 – 2.522 4.08 · 10−3 1.83 0.70 3.53 · 10−3 2.06 0.69 2.00 · 10−3 4.35 1.39 2.522 – 3.277 2.10 · 10−3 2.22 0.80 1.70 · 10−3 2.59 0.87 9.66 · 10−4 5.39 1.92
The ratio of the combined normalised differential cross section to the ResBos prediction is shown as a function
of φ∗
η in Fig. 2. The measurement is also compared to a
QCD calculation by A. Banfi et al. [22] and to another
obtained with Fewz 2.1. The ratios of these two
calcu-lations to ResBos predictions are also shown in Fig. 2.
The CTEQ6m [66] PDF set is used in the calculations in
Ref. [22]. The theoretical uncertainties on this calculation
are evaluated by varying the resummation,
renormalisa-tion and factorisarenormalisa-tion scales µQ, µRand µF between mZ/2
and 2mZ, with the constraints 0.5 ≤ µi/µj ≤ 2, where
i, j ∈ {F, Q, R}, and µF/µQ ≥ 1. Uncertainties coming
from the PDFs are also considered [22]. For Fewz, the
CT10 PDF set is used. Uncertainties are evaluated by
varying µR and µF by factors of two around the nominal
scale mZ with the constraint 0.5 ≤ µR/µF ≤ 2, by varying
αs within a range corresponding to 90% confidence-level
(CL) limits [67], and by using the PDF error eigenvector
sets.
The difference between the ResBos prediction and data
is ∼ 2% for φ∗
η< 0.1, increasing to 5% for higher φ∗ηvalues.
This difference is smaller than the uncertainty in ResBos predictions due to the propagation of PDF eigenvectors
sets, which amounts to 4% for φ∗
η< 0.1 and 6% above. The
description of data provided by calculations from A. Banfi
et al. [22] is less good than ResBos but observed
differ-ences remain within the theoretical uncertainties of the calculation. The prediction obtained with Fewz
under-shoots the data by ∼ 10%, as already observed for the pZ
T
spectrum in Ref. [15]. At low φ∗
η values, corresponding
mainly to low pZ
T, fixed-order perturbative QCD
calcula-tions are not expected to give an adequate description of the cross section. The prediction from Fewz is therefore
only presented for φ∗
η > 0.1. It is normalised using the
total cross section predicted by Fewz, which accurately
describes experimental measurements [58].
The cross section is also measured double differentially
in bins of φ∗
ηfor three independent bins of |yZ| for both the
e+e− and µ+µ− channels. The double differential
cross-section measurements in the two channels are combined
using the same χ2minimisation procedure as used for the
single differential cross section. The minimisation yields
a total χ2/n
dof = 118/102. Measured values of the
com-bined normalised differential cross section 1/σfid·dσfid/dφ∗
η
within the fiducial lepton acceptance in all φ∗
ηand |yZ| bins
are presented in Table3.
-3
10
10
-210
-11
0.85
0.9
0.95
1
1.05
1.1
1.15
-310
10
-210
-11
0.85
0.9
0.95
1
1.05
1.1
1.15
-310
10
-210
-11
0.85
0.9
0.95
1
1.05
1.1
1.15
| < 0.8
z|y
-310
-310
-210
-11
10
-310
-210
-11
10
10
-210
-11
| < 1.6
z|y
≤
0.8
-310
10
-210
-11
0.85
0.9
0.95
1
1.05
1.1
1.15
-310
10
-210
-11
0.85
0.9
0.95
1
1.05
1.1
1.15
-310
10
-210
-11
0.85
0.9
0.95
1
1.05
1.1
1.15
1.6
≥
|
z|y
Data (Prediction) / RESBOS
η *
φ
η *φ
-210
10
-11
ATLAS
-1L dt = 4.6 fb
∫
Data 2011
-µ
+µ
+
-e
+e
RESBOS
SHERPA
ALPGEN
MC@NLO
POWHEG+PYTHIA8
POWHEG+PYTHIA6
POWHEG+HERWIG
= 7 TeV
s
| < 2.4
η
|
> 20 GeV
Tp
< 116 GeV
66 GeV < m
ℓ ℓ ℓℓFigure 3: The ratio of the combined normalised differential cross section 1/σfid· dσfid/dφ∗
ηto the ResBos predictions as a function of φ∗ηin
three ranges of |yZ|. The inner and outer error bars on the data points represent the statistical and total uncertainties, respectively. The
uncertainty due to QED FSR is included in the total uncertainties. The measurements are also compared to predictions from different MC event generators.
section to the ResBos prediction is shown as a function
of φ∗
η for the three |yZ| ranges in Fig. 3. The
measure-ment is also compared to predictions obtained using dif-ferent MC event generators. The PDF set CT10 is em-ployed in all calculations, except for Alpgen where the CTEQ6L1 PDF set is used. The parton-shower parame-ters of each MC generator are set to their default values, except for Pythia6 where a specific ATLAS re-tuning was
used [48]. The generators Alpgen, interfaced to Herwig,
and Sherpa provide a good description of the spectrum
for φ∗
η > 0.1. In particular, Sherpa describes the data
better than ResBos over all |yZ| bins for φ∗η> 0.1.
How-ever, for φ∗
η < 0.1 the deviations of Sherpa or Alpgen
from the data are ∼ 5%, somewhat larger than those of ResBos. The Powheg generator interfaced to Pythia8 is also able to describe the data to within 5% over the
whole φ∗
η range.
The effect of changing the PS tunings and algorithms in-terfaced to Powheg was investigated by using Pythia6 and Herwig interfaced to the same Powheg NLO cal-culation. These two variations give a worse description of data than Pythia8, and deviations from data of ∼ 10%
are observed. The Mc@nlo generator interfaced to
Her-wigdoes not properly describe the data for φ∗
η > 0.1, and
deviations from data of the order of 4–7% are observed for
φ∗
η < 0.1 depending on the |yZ| bin. The level of
agree-ment between MC generators and data is very similar for comparisons at the dressed level.
8. Conclusion
A measurement of the φ∗
η distribution of Z/γ∗ boson
candidates in√s = 7 TeV pp collisions at the LHC is
pre-sented. The data were collected with the ATLAS detector
and correspond to an integrated luminosity of 4.6 fb−1.
Normalised differential cross sections as a function of φ∗
η
have been measured in bins of the Z boson rapidity yZ up
to φ∗
η ∼ 3 for electron and muon pairs with an invariant
mass 66 GeV < mℓℓ< 116 GeV. The high number of Z/γ∗
boson candidates recorded permits the use of finer bins as compared to a similar study performed at the Tevatron. The typical uncertainty achieved by the combination of electron and muon data integrated over the whole Z
ra-pidity range is below 0.5% for φ∗
at larger φ∗
η values.
The cross-section measurements have been compared to resummed QCD predictions combined with fixed-order perturbative QCD calculations. Calculations using
Res-Bos provide the best descriptions of the data. However,
they are unable to reproduce the detailed shape of the measured cross section to better than 4%.
The cross-section measurements have also been com-pared to predictions from different Monte Carlo genera-tors interfaced to a parton shower algorithm. The best
descriptions of the measured φ∗
η spectrum are provided by
Sherpaand Powheg+Pythia8 Monte Carlo event
gen-erators. For φ∗
ηvalues above 0.1, predictions from Sherpa
are able to reproduce the data to within ∼ 2%. The low φ∗
η
part of the spectrum is, however, described less accurately than by ResBos. Double differential measurements as a
function of φ∗
η and yZ provide valuable information for the
tuning of MC generators. None of the tested predictions is able to reproduce the detailed shape of the measured cross section within the experimental precision reached, which is typically lower by one order of magnitude than present theoretical uncertainties.
Acknowledgements
We thank CERN for the very successful operation of the LHC, as well as the support staff from our institutions without whom ATLAS could not be operated efficiently.
We acknowledge the support of ANPCyT, Argentina; YerPhI, Armenia; ARC, Australia; BMWF and FWF, Austria; ANAS, Azerbaijan; SSTC, Belarus; CNPq and FAPESP, Brazil; NSERC, NRC and CFI, Canada; CERN; CONICYT, Chile; CAS, MOST and NSFC, China; COL-CIENCIAS, Colombia; MSMT CR, MPO CR and VSC CR, Czech Republic; DNRF, DNSRC and Lundbeck Foun-dation, Denmark; EPLANET, ERC and NSRF, European Union; IN2P3-CNRS, CEA-DSM/IRFU, France; GNSF, Georgia; BMBF, DFG, HGF, MPG and AvH Founda-tion, Germany; GSRT and NSRF, Greece; ISF, MIN-ERVA, GIF, DIP and Benoziyo Center, Israel; INFN, Italy; MEXT and JSPS, Japan; CNRST, Morocco; FOM and NWO, Netherlands; BRF and RCN, Norway; MNiSW, Poland; GRICES and FCT, Portugal; MERYS (MECTS), Romania; MES of Russia and ROSATOM, Russian Fed-eration; JINR; MSTD, Serbia; MSSR, Slovakia; ARRS and MVZT, Slovenia; DST/NRF, South Africa; MICINN, Spain; SRC and Wallenberg Foundation, Sweden; SER, SNSF and Cantons of Bern and Geneva, Switzerland; NSC, Taiwan; TAEK, Turkey; STFC, the Royal Society and Leverhulme Trust, United Kingdom; DOE and NSF, United States of America.
The crucial computing support from all WLCG part-ners is acknowledged gratefully, in particular from CERN and the ATLAS Tier-1 facilities at TRIUMF (Canada), NDGF (Denmark, Norway, Sweden), CC-IN2P3 (France), KIT/GridKA (Germany), INFN-CNAF (Italy), NL-T1
(Netherlands), PIC (Spain), ASGC (Taiwan), RAL (UK) and BNL (USA) and in the Tier-2 facilities worldwide. References
[1] G. Bozzi et al.,Phys. Lett. B 696 (2011) 207,
arXiv:1007.2351 [hep-ph].
[2] S. Mantry and F. Petriello,Phys. Rev. D 84 (2011) 014030,
arXiv:1011.0757 [hep-ph].
[3] T. Becher and M. Neubert,Eur. Phys. J. C 71 (2011) 1665,
arXiv:1007.4005 [hep-ph].
[4] G. Bozzi et al.,Phys. Lett. B 564 (2003) 65,
arXiv:hep-ph/0302104 [hep-ph].
[5] G. Bozzi et al.,Nucl. Phys. B 737 (2006) 73,
arXiv:hep-ph/0508068 [hep-ph].
[6] D. de Florian et al.,JHEP 11 (2011) 064,arXiv:1109.2109
[hep-ph].
[7] S. Berge et al.,Phys. Rev. D 72 (2005) 033015,
arXiv:hep-ph/0410375 [hep-ph].
[8] CDF Collaboration, T. Aaltonen et al.,Phys. Rev. Lett. 108
(2012) 151803,arXiv:1203.0275 [hep-ex].
[9] DØ Collaboration, V. M. Abazov et al.,Phys. Rev. Lett. 108
(2012) 151804,arXiv:1203.0293 [hep-ex].
[10] CDF Collaboration, T. Affolder et al.,Phys. Rev. Lett. 84
(2000) 845,arXiv:hep-ex/0001021 [hep-ex].
[11] DØ Collaboration, B. Abbott et al.,Phys. Rev. Lett. 84
(2000) 2792,arXiv:hep-ex/9909020 [hep-ex].
[12] DØ Collaboration, V. M. Abazov et al.,Phys. Rev. Lett. 100
(2008) 102002,arXiv:0712.0803 [hep-ex].
[13] DØ Collaboration, V. M. Abazov et al.,Phys. Lett. B 693
(2010) 522,arXiv:1006.0618 [hep-ex].
[14] CDF Collaboration, T. Aaltonen et al.,Phys. Rev. D 86
(2012) 052010,arXiv:1207.7138 [hep-ex].
[15] ATLAS Collaboration,Phys. Lett. B 705 (2011) 415,
arXiv:1107.2381 [hep-ex].
[16] CMS Collaboration,Phys. Rev. D 85 (2012) 032002,
arXiv:1110.4973 [hep-ex].
[17] ATLAS Collaboration,Phys. Rev. D 85 (2012) 012005,
arXiv:1108.6308 [hep-ex].
[18] M. Boonekamp and M. Schott,JHEP 11 (2010) 153,
arXiv:1002.1850 [hep-ex].
[19] M. Vesterinen and T. Wyatt,Nucl. Instrum. Meth. A 602
(2009) 432,arXiv:0807.4956 [hep-ex].
[20] A. Banfi et al.,Eur. Phys. J. C 71 (2011) 1600,
arXiv:1009.1580 [hep-ex].
[21] A. Banfi, M. Dasgupta and S. Marzani,Phys. Lett. B 701
(2011) 75,arXiv:1102.3594 [hep-ph].
[22] A. Banfi et al.,Phys. Lett. B 715 (2012) 152,arXiv:1205.4760
[hep-ph].
[23] DØ Collaboration, V. M. Abazov et al.,Phys. Rev. Lett. 106
(2011) 122001,arXiv:1010.0262 [hep-ex].
[24] K. Melnikov and F. Petriello,Phys. Rev. D 74 (2006) 114017,
arXiv:hep-ph/0609070.
[25] R. Gavin et al.,Comput. Phys. Commun. 182 (2011) 2388,
arXiv:1011.3540 [hep-ph].
[26] S. Catani et al.,Phys. Rev. Lett. 103 (2009) 082001,
arXiv:0903.2120 [hep-ph].
[27] S. Catani and M. Grazzini,Phys. Rev. Lett. 98 (2007) 222002,
arXiv:hep-ph/0703012 [hep-ph].
[28] G. Ladinsky and C. Yuan,Phys. Rev. D 50 (1994) 4239,
arXiv:hep-ph/9311341 [hep-ph].
[29] C. Balazs and C. Yuan,Phys. Rev. D 56 (1997) 5558,
arXiv:hep-ph/9704258 [hep-ph].
[30] F. Landry et al.,Phys. Rev. D 67 (2003) 073016,
arXiv:hep-ph/0212159 [hep-ph].
[31] P. B. Arnold and M. H. Reno,Nucl. Phys. B 319 (1989) 37.
[Erratum-ibid. B 330, 284 (1990)].
[32] F. Landry et al.,Phys. Rev. D 63 (2001) 013004,
arXiv:hep-ph/9905391 [hep-ph].
[33] J. M. Campbell and R. K. Ellis,Phys. Rev. D 65 (2002)
[34] A. Banfi et al.,JHEP 01 (2012) 044,arXiv:1110.4009 [hep-ph].
[35] T. Sj¨ostrand, S. Mrenna and P. Z. Skands,JHEP 05 (2006)
026,arXiv:hep-ph/0603175 [hep-ph].
[36] G. Corcella et al., JHEP 01 (2001) 010,arXiv:0011363
[hep-ph].
[37] P. Nason,JHEP 11 (2004) 040,arXiv:hep-ph/0409146
[hep-ph].
[38] S. Frixione, P. Nason and C. Oleari,JHEP 11 (2007) 070,
arXiv:0709.2092 [hep-ph].
[39] S. Alioli et al.,JHEP 06 (2010) 043,arXiv:1002.2581
[hep-ph].
[40] S. Alioli et al.,JHEP 07 (2008) 060,arXiv:0805.4802
[hep-ph].
[41] S. Frixione and B. R. Webber, JHEP 06 (2002) 029,
arXiv:hep-ph/0204244.
[42] M. L. Mangano et al., JHEP 07 (2003) 001,
arXiv:hep-ph/0206293.
[43] T. Gleisberg et al.,JHEP 02 (2009) 007,arXiv:0811.4622
[hep-ph].
[44] S. Hoeche et al.,JHEP 05 (2009) 053,arXiv:0903.1219
[hep-ph].
[45] F. Krauss, JHEP 08 (2002) 015,hep-ph/0205283.
[46] ATLAS Collaboration, JINST 3 (2008) S08003. [47] H.-L. Lai et al., Phys. Rev. D 82 (2010) 074024,
arXiv:1007.2241 [hep-ph].
[48] ATLAS Collaboration, ATL-PHYS-PUB-2011-009.
http://cdsweb.cern.ch/record/1363300.
[49] P. Golonka and Z. W¸as,Eur. Phys. J. C 45 (2006) 97,
arXiv:hep-ph/0506026.
[50] D. Yennie, S. Frautschi and H. Suura, Ann. Phys. (NY) 13 (1961) 379.
[51] M. Schonherr and F. Krauss,JHEP 12 (2008) 018,
arXiv:0810.5071 [hep-ph].
[52] GEANT4 Collaboration, S. Agostinelli et al.,
Nucl. Instrum. Meth. A506 (2003) 250.
[53] ATLAS Collaboration,Eur. Phys. J. C 70 (2010) 823,
arXiv:1005.4568 [physics.ins-det].
[54] ATLAS Collaboration,JHEP 12 (2010) 060,arXiv:1010.2130
[hep-ex].
[55] R. Fr¨uhwirth,Comput. Phys. Commun. 100 (1997) 1.
[56] ATLAS Collaboration, ATLAS-CONF-2012-047.
http://cdsweb.cern.ch/record/1449796.
[57] ATLAS Collaboration,Eur. Phys. J. C 72 (2012) 1909,
arXiv:1110.3174 [hep-ex].
[58] ATLAS Collaboration,Phys. Rev. D 85 (2012) 072004,
arXiv:1109.5141 [hep-ex].
[59] J. M. Campbell, R. K. Ellis and C. Williams,JHEP 07 (2011)
018,arXiv:1105.0020 [hep-ph].
[60] Y. Li and F. Petriello,arXiv:1208.5967 [hep-ph].
[61] A. D. Martin et al.,Eur. Phys. J. C 39 (2005) 155,
arXiv:hep-ph/0411040 [hep-ph].
[62] G. D’Agostini,Nucl. Instrum. Meth. A 362 (1995) 487.
[63] A. Glazov,AIP Conf. Proc. 792 (2005) 237.
[64] H1 Collaboration, F. D. Aaron et al.,Eur. Phys. J. C 63
(2009) 625,arXiv:0904.0929 [hep-ex].
[65] H1 and ZEUS Collaboration, F. D. Aaron et al.,JHEP 01
(2010) 109,arXiv:0911.0884 [hep-ex].
[66] J. Pumplin et al.,JHEP 07 (2002) 012,
arXiv:hep-ph/0201195.
[67] A. D. Martin et al.,Eur. Phys. J. C 64 (2009) 653,
The ATLAS Collaboration
G. Aad48, T. Abajyan21, B. Abbott111, J. Abdallah12, S. Abdel Khalek115, A.A. Abdelalim49, O. Abdinov11,
R. Aben105, B. Abi112, M. Abolins88, O.S. AbouZeid158, H. Abramowicz153, H. Abreu136, B.S. Acharya164a,164b,a,
L. Adamczyk38, D.L. Adams25, T.N. Addy56, J. Adelman176, S. Adomeit98, P. Adragna75, T. Adye129, S. Aefsky23,
J.A. Aguilar-Saavedra124b,b, M. Agustoni17, S.P. Ahlen22, F. Ahles48, A. Ahmad148, M. Ahsan41, G. Aielli133a,133b,
T.P.A. ˚Akesson79, G. Akimoto155, A.V. Akimov94, M.A. Alam76, J. Albert169, S. Albrand55, M. Aleksa30,
I.N. Aleksandrov64, F. Alessandria89a, C. Alexa26a, G. Alexander153, G. Alexandre49, T. Alexopoulos10,
M. Alhroob164a,164c, M. Aliev16, G. Alimonti89a, J. Alison120, B.M.M. Allbrooke18, L.J. Allison71, P.P. Allport73,
S.E. Allwood-Spiers53, J. Almond82, A. Aloisio102a,102b, R. Alon172, A. Alonso79, F. Alonso70, A. Altheimer35,
B. Alvarez Gonzalez88, M.G. Alviggi102a,102b, K. Amako65, C. Amelung23, V.V. Ammosov128,∗,
S.P. Amor Dos Santos124a, A. Amorim124a,c, S. Amoroso48, N. Amram153, C. Anastopoulos30, L.S. Ancu17,
N. Andari115, T. Andeen35, C.F. Anders58b, G. Anders58a, K.J. Anderson31, A. Andreazza89a,89b, V. Andrei58a,
M-L. Andrieux55, X.S. Anduaga70, S. Angelidakis9, P. Anger44, A. Angerami35, F. Anghinolfi30, A. Anisenkov107,
N. Anjos124a, A. Annovi47, A. Antonaki9, M. Antonelli47, A. Antonov96, J. Antos144b, F. Anulli132a, M. Aoki101,
S. Aoun83, L. Aperio Bella5, R. Apolle118,d, G. Arabidze88, I. Aracena143, Y. Arai65, A.T.H. Arce45, S. Arfaoui148,
J-F. Arguin93, S. Argyropoulos42, E. Arik19a,∗, M. Arik19a, A.J. Armbruster87, O. Arnaez81, V. Arnal80,
A. Artamonov95, G. Artoni132a,132b, D. Arutinov21, S. Asai155, S. Ask28, B. ˚Asman146a,146b, L. Asquith6,
K. Assamagan25,e, A. Astbury169, M. Atkinson165, B. Aubert5, E. Auge115, K. Augsten126, M. Aurousseau145a,
G. Avolio30, D. Axen168, G. Azuelos93,f, Y. Azuma155, M.A. Baak30, G. Baccaglioni89a, C. Bacci134a,134b,
A.M. Bach15, H. Bachacou136, K. Bachas154, M. Backes49, M. Backhaus21, J. Backus Mayes143, E. Badescu26a,
P. Bagnaia132a,132b, Y. Bai33a, D.C. Bailey158, T. Bain35, J.T. Baines129, O.K. Baker176, S. Baker77, P. Balek127,
E. Banas39, P. Banerjee93, Sw. Banerjee173, D. Banfi30, A. Bangert150, V. Bansal169, H.S. Bansil18, L. Barak172,
S.P. Baranov94, T. Barber48, E.L. Barberio86, D. Barberis50a,50b, M. Barbero21, D.Y. Bardin64, T. Barillari99,
M. Barisonzi175, T. Barklow143, N. Barlow28, B.M. Barnett129, R.M. Barnett15, A. Baroncelli134a, G. Barone49,
A.J. Barr118, F. Barreiro80, J. Barreiro Guimar˜aes da Costa57, R. Bartoldus143, A.E. Barton71, V. Bartsch149,
A. Basye165, R.L. Bates53, L. Batkova144a, J.R. Batley28, A. Battaglia17, M. Battistin30, F. Bauer136, H.S. Bawa143,g,
S. Beale98, T. Beau78, P.H. Beauchemin161, R. Beccherle50a, P. Bechtle21, H.P. Beck17, K. Becker175, S. Becker98,
M. Beckingham138, K.H. Becks175, A.J. Beddall19c, A. Beddall19c, S. Bedikian176, V.A. Bednyakov64, C.P. Bee83,
L.J. Beemster105, M. Begel25, S. Behar Harpaz152, P.K. Behera62, M. Beimforde99, C. Belanger-Champagne85,
P.J. Bell49, W.H. Bell49, G. Bella153, L. Bellagamba20a, M. Bellomo30, A. Belloni57, O. Beloborodova107,h,
K. Belotskiy96, O. Beltramello30, O. Benary153, D. Benchekroun135a, K. Bendtz146a,146b, N. Benekos165,
Y. Benhammou153, E. Benhar Noccioli49, J.A. Benitez Garcia159b, D.P. Benjamin45, M. Benoit115, J.R. Bensinger23,
K. Benslama130, S. Bentvelsen105, D. Berge30, E. Bergeaas Kuutmann42, N. Berger5, F. Berghaus169, E. Berglund105,
J. Beringer15, P. Bernat77, R. Bernhard48, C. Bernius25, T. Berry76, C. Bertella83, A. Bertin20a,20b,
F. Bertolucci122a,122b, M.I. Besana89a,89b, G.J. Besjes104, N. Besson136, S. Bethke99, W. Bhimji46, R.M. Bianchi30,
L. Bianchini23, M. Bianco72a,72b, O. Biebel98, S.P. Bieniek77, K. Bierwagen54, J. Biesiada15, M. Biglietti134a,
H. Bilokon47, M. Bindi20a,20b, S. Binet115, A. Bingul19c, C. Bini132a,132b, C. Biscarat178, B. Bittner99, C.W. Black150,
K.M. Black22, R.E. Blair6, J.-B. Blanchard136, T. Blazek144a, I. Bloch42, C. Blocker23, J. Blocki39, W. Blum81,
U. Blumenschein54, G.J. Bobbink105, V.S. Bobrovnikov107, S.S. Bocchetta79, A. Bocci45, C.R. Boddy118, M. Boehler48,
J. Boek175, T.T. Boek175, N. Boelaert36, J.A. Bogaerts30, A. Bogdanchikov107, A. Bogouch90,∗, C. Bohm146a,
J. Bohm125, V. Boisvert76, T. Bold38, V. Boldea26a, N.M. Bolnet136, M. Bomben78, M. Bona75, M. Boonekamp136,
S. Bordoni78, C. Borer17, A. Borisov128, G. Borissov71, I. Borjanovic13a, M. Borri82, S. Borroni42, J. Bortfeldt98,
V. Bortolotto134a,134b, K. Bos105, D. Boscherini20a, M. Bosman12, H. Boterenbrood105, J. Bouchami93, J. Boudreau123,
E.V. Bouhova-Thacker71, D. Boumediene34, C. Bourdarios115, N. Bousson83, A. Boveia31, J. Boyd30, I.R. Boyko64,
I. Bozovic-Jelisavcic13b, J. Bracinik18, P. Branchini134a, A. Brandt8, G. Brandt118, O. Brandt54, U. Bratzler156,
B. Brau84, J.E. Brau114, H.M. Braun175,∗, S.F. Brazzale164a,164c, B. Brelier158, J. Bremer30, K. Brendlinger120,
R. Brenner166, S. Bressler172, T.M. Bristow145b, D. Britton53, F.M. Brochu28, I. Brock21, R. Brock88, F. Broggi89a,
C. Bromberg88, J. Bronner99, G. Brooijmans35, T. Brooks76, W.K. Brooks32b, G. Brown82,
P.A. Bruckman de Renstrom39, D. Bruncko144b, R. Bruneliere48, S. Brunet60, A. Bruni20a, G. Bruni20a, M. Bruschi20a,
L. Bryngemark79, T. Buanes14, Q. Buat55, F. Bucci49, J. Buchanan118, P. Buchholz141, R.M. Buckingham118,
A.G. Buckley46, S.I. Buda26a, I.A. Budagov64, B. Budick108, V. B¨uscher81, L. Bugge117, O. Bulekov96,
A.C. Bundock73, M. Bunse43, T. Buran117, H. Burckhart30, S. Burdin73, T. Burgess14, S. Burke129, E. Busato34,
P. Bussey53, C.P. Buszello166, B. Butler143, J.M. Butler22, C.M. Buttar53, J.M. Butterworth77, W. Buttinger28,
M. Byszewski30, S. Cabrera Urb´an167, D. Caforio20a,20b, O. Cakir4a, P. Calafiura15, G. Calderini78, P. Calfayan98,
R. Calkins106, L.P. Caloba24a, R. Caloi132a,132b, D. Calvet34, S. Calvet34, R. Camacho Toro34, P. Camarri133a,133b,