GUILAINE MARQUES
JARIA
ADSORÇÃO DE FLUOXETINA A CARVÕES DE
BIO-RESÍDUOS ATIVADOS
ADSORPTION OF FLUOXETINE ONTO
WASTE-BASED ACTIVATED CARBON
GUILAINE MARQUES
JARIA
ADSORÇÃO DE FLUOXETINA A CARVÕES DE
BIO-RESÍDUOS ATIVADOS
ADSORPTION OF FLUOXETINE ONTO
WASTE-BASED ACTIVATED CARBON
Dissertação apresentada à Universidade de Aveiro para cumprimento dos requisitos necessários à obtenção do grau de Mestre em Química, ramo de Química Analítica e Qualidade, realizada sob a orientação científica da Doutora Vânia Maria Amaro Calisto, Pós-Doc do Departamento de Química da Universidade de Aveiro, e do Doutor Valdemar Inocêncio Esteves, Professor Auxiliar do Departamento de Química da Universidade de Aveiro.
o júri
presidente Prof. Doutor Artur Manuel Soares da Silva
Professor Catedrático do Departamento de Química da Universidade de Aveiro
Prof. Doutora Olga Manuela Simão Filipe
Professora Adjunta da Escola Superior Agrária de Coimbra
Prof. Doutor Valdemar Inocêncio Esteves
agradecimentos Ao meu orientador, Professor Valdemar Esteves pela oportunidade de trabalhar com o seu grupo de analítica e pela orientação científica ao longo do trabalho.
À Doutora Vânia Calisto agradeço toda a disponibilidade, apoio, paciência e ajuda, não esquecendo o valioso conhecimento e orientação científica ao longo do trabalho.
Às minhas colegas de laboratório pela disponibilidade em ajudar e pelos momentos de boa disposição.
Aos meus colegas e amigos que me acompanharam nestes dois anos de mestrado, pelos bons momentos que passamos juntos.
Aos meus amigos e à minha família, pela amizade e apoio demonstrado. E, por fim, um agradecimento especial aos meus pais e à minha irmã por me terem encorajado e apoiado desde sempre.
palavras-chave Carvão ativado; ativação química; fármacos; ambiente; adsorção; isotérmica de adsorção.
resumo Os carvões ativados são uma das técnicas mais promissoras para a remoção de compostos orgânicos e inorgânicos presentes nas águas. Neste trabalho, foram produzidos três carvões ativados utilizando como precursor lamas primárias residuais provenientes da produção de papel. Foi utilizada a ativação química com KOH, NaOH e ZnCl2, aplicando as mesmas condições de pirólise
aos três carvões. A caracterização dos materiais obtidos foi feita por meio de análise de carbono orgânico total (TOC), espectroscopia de infravermelho com transformada de Fourier usando a técnica reflexão total atenuada (FTIR-ATR),
Proximate and ultimate analysis, microscopia eletrónica de varrimento (SEM), porosimetria de mercúrio, isotérmicas BET e determinação do ponto de carga zero (PZC). Foram realizados estudos de adsorção iniciados pela cinética de adsorção e seguidos das isotérmicas, usando experiências em vaso fechado. Os estudos de cinética de adsorção mostraram que, na generalidade, todos os carvões produzidos apresentaram um tempo de equilíbrio semelhante, cerca de seis horas. As isotérmicas permitiram testar a capacidade de adsorção dos carvões produzidos para o composto fluoxetina-HCl. Estes dois estudos foram também aplicados à lama primária pirolisada sob as mesmas condições mas sem ativação e também a um carvão ativado comercial, usado como referência. Entre os materiais produzidos, o carvão ativado com ZnCl2 é o que
apresenta uma área superficial específica (SBET) superior e maior percentagem
de carbono. A capacidade máxima de adsorção (mg g-1) foi de 96.2 ± 1.0 para o PBFG4; 120.4 ± 2.5 para PS800-10; 191.6 ± 4.8 para PS800-10KOH; 136.6 ± 9.6 para PS800-10NaOH; e 28.4 ± 0.3 para PS800-10ZnCl2. As isotérmicas
obtidas apontam para a existência de diferentes mecanismos de adsorção entre os carvões, provavelmente devido aos seus valores de PZC.
keywords Activated carbon; chemical activation; pharmaceuticals; environment; adsorption; adsorption isotherms.
abstract Activated carbons are one of the most promising techniques for the removal of organic and inorganic compounds from waters. In this work three activated carbons were produced using as precursor primary paper mill sludge. Chemical activation was performed using three different activation agents, KOH, NaOH and ZnCl2, and the same pyrolysis conditions were applied. The
characterization of the obtained materials was made by means of total organic carbon analysis (TOC), Fourier infrared spectroscopy with attenuated total reflectance (FTIR-ATR), proximate and ultimate analysis, scanning electron microscopy (SEM), Hg porosimetry, BET isotherms and point of zero charge (PZC) determination. Adsorption studies were made, beginning with adsorption kinetic and then adsorption equilibrium (isotherms of adsorption), all performed in batch experiments. Generally, the carbons presented an equilibrium time of around six hours. Equilibrium studies allowed test the adsorption capacity of the produced carbons for fluoxetine-HCl. These two studies were also performed to the primary sludge pyrolysed under the same conditions without activation and also to a commercial activated carbon as reference. Among the produced materials, the carbon activated with ZnCl2 has the higher BET
surface area and percentage of carbon. The maximum adsorption capacity (mg g-1) was of 96.2 ± 1.0 for PBFG4; 120.4 ± 2.5 for PS800-10; 191.6 ± 4.8 for 10KOH; 136.6 ± 9.6 for 10NaOH; and 28.4 ± 0.3 for PS800-10ZnCl2. The isotherms obtained point for different mechanism of adsorption
i
CONTENT
1. INTRODUCTION ...1
1.1.IMPORTANCE OF THE ACTIVATED CARBONS ...3
1.2.ACTIVATED CARBON ...8
1.2.1. Definition and applications for activated carbon ...8
1.2.2. The carbon element and the production of carbon materials ...9
1.2.3. Characterisation of activated carbons ... 11
1.2.4. Production of activated carbons ... 16
1.2.5. Surface chemistry of activated carbons – functionalization ... 20
1.3. ADSORPTION AND THE STUDY OF REMOVAL OF PHARMACEUTICALS FROM WASTEWATERS ... 23
1.3.1. Adsorption ... 23
1.3.2. Adsorption isotherm ... 24
1.3.3. Adsorbate and adsorbent features ... 35
1.4.STUDY BACKGROUND ... 36
1.4.1. Main goal of the study ... 37
2. MATERIALS AND METHODS ... 39
2.1.CHEMICALS ... 41
2.2.PREPARATION OF ACTIVATED CARBONS... 41
2.2.1. Impregnation and pyrolysis conditions and washing step ... 41
2.3.CHARACTERIZATION OF THE ACTIVATED CARBON ... 43
2.3.1. Fourier transform infrared spectroscopy with attenuated total (FTIR-ATR) .... 43
2.3.2. TOC ... 43
2.3.3. Proximate and Ultimate Analysis ... 44
ii
2.3.5. Scanning electron microscopy (SEM)... 45
2.4.POINT OF ZERO CHARGE (PZC) DETERMINATION ... 45
2.5.BATCH ADSORPTION EXPERIMENTS ... 46
2.5.1. Kinetics experiments ... 46
2.5.2. Adsorption equilibrium experiments... 47
2.5.3. Statistical evaluation of the kinetic and isotherm parameters ... 48
2.6.QUANTIFICATION OF FLUOXETINE-HCl BY CAPILLARY ZONE ELECTROPHORESIS ... 49
2.6.1. Optimization of the Quantitative Method of Analysis and Operating Conditions ... 49
2.6.3. Calibration curve ... 54
3. RESULTS AND DISCUSSION ... 57
3.1.CHARACTERISATION OF THE CARBONS ... 59
3.1.1. FTIR-ATR analysis ... 59
3.1.2. 13C-NMR study ... 62
3.1.3. Total Organic Carbon ... 63
3.1.3. Proximate and ultimate analysis ... 64
3.1.5. Specific surface area and porosity ... 65
3.1.6. SEM analysis ... 66
3.1.7. Point of zero charge (PZC) determination... 67
3.2.ADSORPTION STUDIES – KINETICS AND EQUILIBRIUM ADSORPTION ... 69
3.2.1. Calibration curve results ... 69
3.2.2. Experimental adsorption data fitting ... 70
3.2.3. Kinetic studies analysis ... 75
3.2.4. Equilibrium adsorption studies analysis ... 76
4. CONCLUSIONS AND FUTURE TRENDS ... 85
iii LIST OF FIGURES
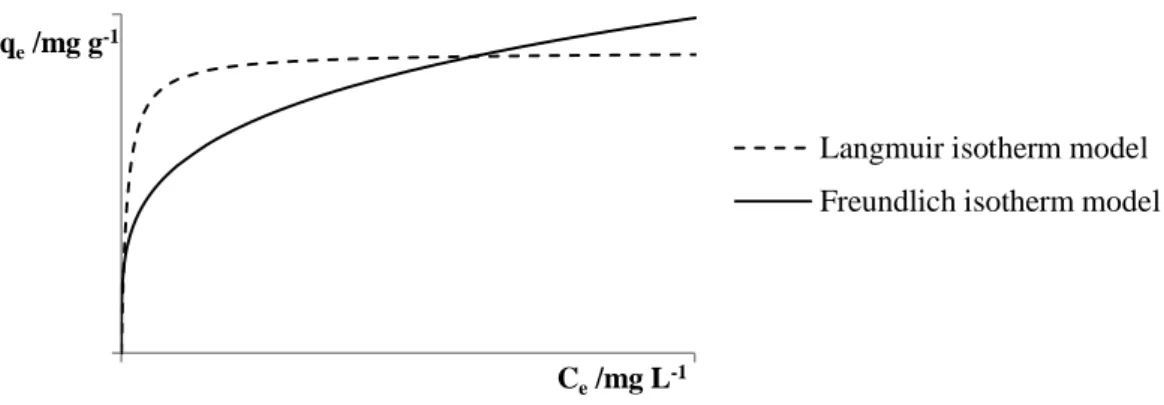
Figure 1 – Comparative graph of the number of packages sold in Portuguese National Health Systems containing active substances with antidepressant action (Infarmed statistics of medicine 2007, 2009 and 2011) (Infarmed) ...5 Figure 2 – Molecular structure of fluoxetine ...6 Figure 3 – Schematic representation of the carbon forms... 10 Figure 4 – Schematic representation of grafitizable carbon (a) and non-grafitizable (b), based on the drawings adapted from Franklin Marsh and Rodríguez-Reinoso (2006). ... 13 Figure 5 – Functional groups existing on the surface of a carbon (Marsh and Rodríguez-Reinoso, 2006) ... 15 Figure 6 – Most common adsorption isotherms for adsorption of dilute solutions on carbon materials (Butt et al. (2003) and Moreno-Castilla (2004))... 29 Figure 7 – Schematic representation of the isotherms of Langmuir and Freundlich ... 33 Figure 8 – Process of production of activated carbons ... 42 Figure 9 – Electropherogram of a 10 mg L-1 fluoxetine-HCl solution (EOF – electroosmotic flow) ... 53 Figure 10 – Fluoxetine-HCl absorption spectrum ... 53 Figure 11 – FTIR-ATR spectra (Abs versus Wavenumber) for the carbons a) PBFG4, b) PS, c) PS800-10, d) PS800-10KOH, e) PS800-10NaOH and f) PS800-10ZnCl2. ... 60
Figure 12 – 13C-NMR solid state spectra for PS (a) and PS800-10 (b) ... 62 Figure 13 - Molecular structure of cellulose (Granström, 2009) ... 62 Figure 14 – Scanning electron microscopy images of a) PS; b) 10; c) PS800-10KOH; d) PS800-10NaOH; e) PS800-10ZnCl2 at 500x, 3000x, 10000x and 30000x (from
left to right). ... 67 Figure 15 – Plots of ΔpH vs pHi for the determination of PZC. ... 68
Figure 16 – Calibration curve for the determination of fluoxetine solutions concentrations. ... 69 Figure 17 –Nonlinear fit of (a) Pseudo-first order, pseudo-second order kinetic models (for 0.04 g L-1 of carbon) and (b) Langmuir, Freundlich, Sips and Redlich-Peterson isotherms model for the reference carbon PBFG4 experimental data (360 min). ... 70
iv
Figure 18 – Nonlinear fit of (a) Pseudo-first order, pseudo-second order kinetic models (for 0.075 g L-1 of carbon) and (b) Hill, Zhu-Gu and Modified BET (MBET) isotherms model for the reference carbon P800-10 experimental data (360 min). ... 71 Figure 19 – Nonlinear fit of (a) Pseudo-first order, pseudo-second order kinetic models (for 0.075 g L-1 of carbon) and (b) Hill, Zhu-Gu and ModifiedBET (MBET) isotherms model for the reference carbon PS800-10KOH experimental data (360 min). ... 72 Figure 20 – Nonlinear fit of (a) Pseudo-first order, pseudo-second order kinetic models (for 0.075 g L-1 of carbon) and (b) Hill, Zhu-Gu and Modified BET (MBET) isotherms model for the reference carbon PS800-10NaOH experimental data (360). ... 73 Figure 21 – Nonlinear fit of (a) Pseudo-first order, pseudo-second order kinetic models (for 0.2 g L-1 of carbon) and (b) Langmuir, Freundlich, Sips and Redlich-Peterson isotherms model for the reference carbon PS800-10ZnCl2 experimental data (420 min)... 74
Figure 22 – Magnification of the first “plateau” obtained for the isotherms for PS800-10 (a), PS800-10KOH (b) and PS800-10NaOH (c), with Langmuir and Freundlich isotherm fittings. ... 78 Figure 23 – Characterization study a) FTIR-ATR spectra and b) PZC of PS800-10NaOH washed with HCl (PS800-10NaOH-HCl). ... 80 Figure 24 – Nonlinear fit of (a) Pseudo-first order, pseudo-second order kinetic models (for 0.2 g L-1 of carbon) and (b) Langmuir, Freundlich, Sips and Redlich-Peterson isotherms model for PS800-10NaOH-HCl experimental data (240 min). ... 81 Figure 25 – Percentage of adsorption as a function of the concentration of adsorbent for: a) PBFG4; b) PS800-10; c) PS800-10KOH; d) PS800-10NaOH; e) PS800-10ZnCl2 and f)
v LIST OF TABLES
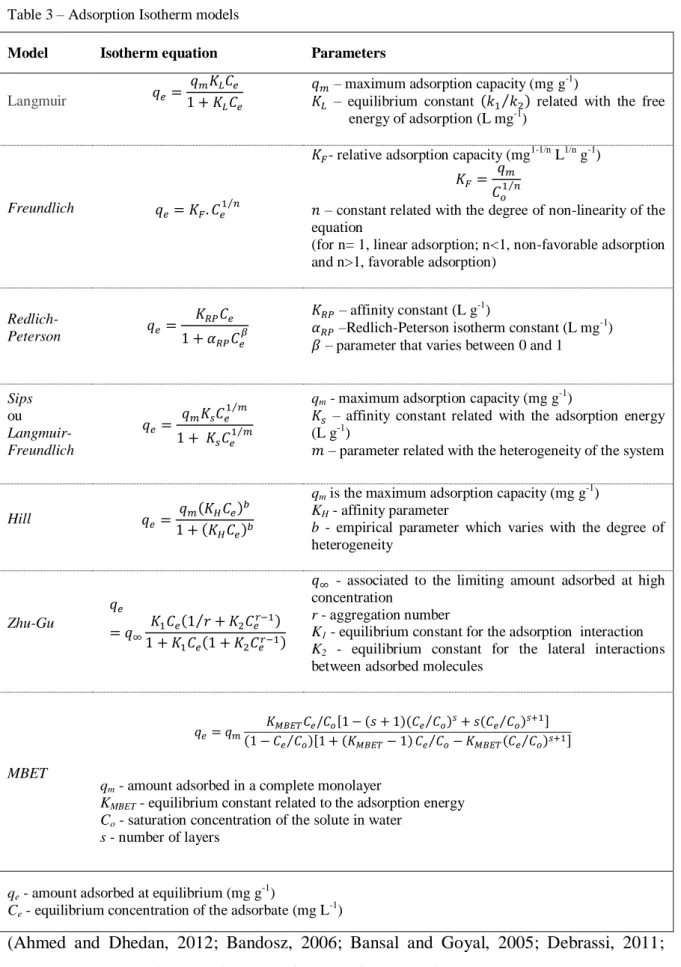
Table 1 – Methods for removal of fluoxetine from water presented in literature ...7 Table 2 – Surface functional groups on activated carbons and respective treatment (Bansal and Goyal, 2005; Bandosz, 2006) ... 21 Table 3 – Adsorption Isotherm models ... 31 Table 4 – Weighted masses of starting material and of activating agent for the chemical activation ... 42 Table 5 – Results of the variation of some parameters of analysis for method optimization ... 50 Table 6 – Total Organic Carbon (TOC) analysis for PS and the pyrolysed materials (n=3). ... 63 Table 7 – Proximate and Ultimate Analysis results for PS, PS800-10, PS800-10KOH, PS800-10NaOH and PS800-10ZnCl2 ... 64
Table 8 – Textural parameters of the carbons: SBET – BET surface area; Vp – total pore
volume; Wo – micropore volume; L – average micropore width; D – average pore
diameter. ... 66 Table 9 – Kinetic and Isotherm parameters for the adsorption experimental data of PBFG4 (reference carbon) for fluoxetine-HCl. ... 71 Table 10 - Kinetic and Isotherm parameters for the adsorption experimental data of PS800-10 carbon for fluoxetine-HCl. ... 72 Table 11 – Kinetic (n=9) and Isotherm (n=11) parameters for the adsorption experimental data of PS800-10KOH carbon for fluoxetine-HCl. ... 73 Table 12 – Kinetic and Isotherm parameters for the adsorption experimental data of PS800-10NaOH carbon for fluoxetine-HCl. ... 74 Table 13 – Kinetic and Isotherm parameters for the adsorption experimental data of PS800-10ZnCl2 carbon for fluoxetine-HCl. ... 75
Table 14 – Isotherm parameters for the adsorption experimental data of 10, PS800-10KOH and PS800-10NaOH for fluoxetine-HCl at the “first plateau”. ... 79 Table 15 – Kinetic and isotherm parameters obtained from various equations to the adsorption data of PS800-10NaOH-HCl carbon material for fluoxetine-HCl. ... 81
1
3
1.1.
I
MPORTANCE OF THE ACTIVATED CARBONSIn drinking water more than eight hundred organic and inorganic chemicals have been identified, most of them are pollutants which are able to cause serious human diseases (Bansal and Goyal, 2005). These compounds can be derived from human activities such as the municipal and industrial wastewater discharges, rural and urban runoff and wastewater leaching, or may also originate from the natural decomposition of plant and animal matter. Due to the high population density, it is necessary to find processes that make possible the removal of these compounds from contaminated waters. Among the various existent remediation processes, we can highlight those based on coagulation, oxidation, ion exchange and adsorption on activated carbon. The use of activated carbon seems so far to be one of the most promising way of removing contaminants from contaminated environments (Bansal and Goyal, 2005).
The origin of the use of activated carbon is not well defined, however, it is known that prior to using what is now called activated carbon, it was used carbon materials from vegetable origin (wood) as adsorbents. The first uses of such materials date from 3750 BC, Egypt and Sumer, where coal was used for the reduction of copper and tin ores for the production of bronze. In 1550 AC it was used for the first time in Greece for medicinal purposes. The application of carbon for water filtration dates from around 400 BC, in order to eliminate the taste and odor of it and to prevent diseases. The first industrial application was incorporated in England in 1794, in the sugar production industry as a bleaching agent. This event marks the beginning of research on activated carbon used in liquid phase (Bandosz, 2006).
The concept of adsorption, closely linked to the use of activated carbon, was first mentioned in the context of capture of gases by charcoal, in 1881. For this same time, R. von Ostrejko found what we now call activated carbon, patenting two methods of production of the same, namely, by the carbonization of lignocellulosic materials with metal chlorides, which is basically the current chemical activation, and gasification of coal with carbon dioxide or water vapor, known as physical or thermal activation (Bandosz, 2006).
In World War I there was great progress in the production and application of activated carbons, for example, in the development of gas masks, in water treatment and
4
removal of vapors from the gas phase. Also, in the second half of the last century, the imposition of strict regulations on the environment related to water resources, application of clean gases and chemicals economic recovery has boosted production and use of activated carbons.
Professor Harry Marsh stated about activated carbons:
"Activated carbon is the Cinderella of the Carbon family, (...) and after purifying tonnes of sugar, cleaning up oceans of water, and enormous Amounts of food, (...), they were never taken to the Ball." With this sentence, Harry Marsh tried to show the importance of the
activated carbons for society (Bandosz, 2006).
One of the positive aspects of the evolution of society is the development of products, methods and techniques which predicate the improvement of quality of life. However, there is also a negative aspect of this evolution which is the fact of involving big changes in everyday people life which in some cases, result in stress and other psychiatric disorders as, for example, depression. Often, these conditions are treated through the use of drugs in particular through the consumption of antidepressants (Nabais et al., 2008). The detection of pharmaceutical compounds in several environmental compartments has been increasing not only because of the high consumption patterns but also due to the improvement in detection methods (Bell et al., 2011). The concentrations of these pharmaceuticals (antidepressants) in the aquatic environment are very low, appearing between the nanogram-per-liter (of ng.L-1) to microgram-per-liter (µg.L-1) and not representing itself an immediate toxicological hazard to humans or to other living beings. However, the presence of these compounds may have additive and synergistic effects and can even become persistent leading to accumulation, as in the case of antidepressants (Bell et al., 2011; Calisto, 2011).
This cumulative and continuous contamination can become harmful not only to animals and plants which are part of the aquatic environment but also for humans who daily consume contaminated water. Thus, the presence of these and other drugs in aquatic environments is one of the emerging issues in environmental studies, making it necessary to develop effective and cost effective treatment methods for water. The graph in Figure 1 shows the number of different psychotropic antidepressants packaging distributed by the National Health System in Portugal, from 2007 to 2011. It is clearly showed the increase in the number of packages, in particular drugs containing fluoxetine. It should be noted,
5
though, that fluoxetine occupied in 2011, the 39 place in the ranking of 100 most active substances consumed in Portugal.
Figure 1 – Comparative graph of the number of packages sold in Portuguese National Health Systems containing active substances with antidepressant action (Infarmed statistics of medicine 2007, 2009 and 2011) (Infarmed)
Fluoxetine is a chemical compound belonging to the family of antidepressants called Selective Serotonin Reuptake Inhibitors (SSRI’s). It is the most widely used compound for treatment of mental depression and it is also used to treat obsessive-compulsive disorder, being present in the drug trademark Prozac (Flores et al., 2005; Nabais et al., 2008).
Typically, the molecule used for the pharmaceutical formulation of the drug is fluoxetine-HCl, whose name according to IUPAC is N-methyl-3phenyl-3-[4 - (trifluoromethyl) phenoxy] propan-1-amine hydrochloride with the molecular formula C17H18F3NO·HCl. The structures of the enantiomers of fluoxetine are shown in Figure 2.
0.0 1.0 2.0 3.0 4.0 5.0 6.0 7.0
Citalopram Diazepam Fluoxetine Paroxetine Sertraline Venlafaxine
N º o f pa cka ge s (x10 5)
Pharmaceutical (active substance)
Number of packages distributed in SNS of different psycopharmaceuticals
2007 2009 2011
6
(a) S – Fluoxetine (b) R – Fluoxetine
Figure 2 – Molecular structure of fluoxetine
Fluoxetine was reported as being one of the most persistent pharmaceuticals from the SSRI group, even after some treatments as chlorination (Lichtfouse et al., 2012). The development of methods for the efficient treatment of waters that are simultaneously efficient and low cost are still a challenge, therefore is important continuing to explore this area, for instance, in the production of specific adsorbent. Some studies that have been made about the removal of fluoxetine by adsorption are presented in Table 1.
7
Table 1 – Methods for removal of fluoxetine from water presented in literature
Adsorbent Quantification
method
% of Removal / adsorption capacity (mg g-1)
Reference
Activated charcoal (Norit USP XXIII) ultraviolet absorption (spectrometer) 258 (pH 1.2) mg g -1 and 330 (pH 7.5) mg g-1 (Cooney and Thomason, 1997) Activated charcoal Commercial Activated carbon : Carbomix Ion-selective electrode (ISE) potentiometry -- (Atta-Politou et al., 2001) commercial activated carbons (carbomix and maxsorb)
one activated carbon fibre three MCM-41 samples ultraviolet absorption (spectrometer) Adsorption capacity between 55 and 1112 mg g-1 (Nabais et al., 2008) activated carbon carbonaceous resin two high-silica zeolites
LC/MS/MS 98.4 %
78.8 % < 25 %
(Rossner et al., 2009)
Activated sludge (CAS) Hollow-fibre (FS) MBR Flat-sheet (FH) MBR HPLC 33.1 ± 28.9 % 98.0 ±1.9 % 98.0 ±1.6 % (Radjenovic et al., 2009)
Sodium dodecyl sulfate (SDS) coated Fe3O4 nanoparticles (NPs) magnetic solid phase extraction (MSPE) and spectrofluorimetry 80 % (Bagheri et al., 2011) crosslinked β- cyclodextrin-carboxymethylcellulose (β-CD-CMC) polymer ultraviolet-visible (UV-vis) and Fourier transform infrared (FTIR) spectroscopies 5.076 mg g-1 (Bonenfant et al., 2012)
8
1.2.
A
CTIVATEDC
ARBON1.2.1. Definition and applications for activated carbon
A peculiarity of carbon materials is the easiness in controlling their properties. The different organizations or groups of segments of carbon atoms in such materials provide an extremely wide range of physical, chemical and mechanical properties. No other material has this feature and that is what makes their wide applicability in various industrial practices (Marsh and Rodríguez-Reinoso, 2006).
Activated carbon, such as carbon materials in general, is a porous carbonaceous material derived from a carbonaceous starting material. However, the activated carbon is subjected to a treatment with gas or chemical agents before, after or during carbonization in order to increase its adsorptive properties by increasing its porosity and improving chemical surface properties. It is a material which has a high adsorption capacity, preferably for small molecules and, therefore, is widely used for the purification of liquids and gases, in particular for water and air treatment and also for separating gaseous mixtures (Alcañiz-Monge and Illan-Gomez, 2008; Azargohar and Dalai, 2006; Bandosz, 2006; Guo and Rockstraw, 2006; IUPAC, 2012; Junior, 2004; Marsh and Rodríguez-Reinoso, 2006; Srinivasakannan and Bakar, 2004). Activated carbons were the first adsorbents to be developed. They are produced from a carbonaceous starting material that is designated as a precursor, which is transformed or activated by using a high temperature treatment, responsible for removing solid mass and simultaneously pores are created in the places where the mass was removed. A common property of activated carbon and other carbon adsorbents is their well-developed porous network (Bandosz, 2006). In fact, the term activated carbon refers to the porosity contained within the material constituting carbon (Junior, 2004; Marsh and Rodríguez-Reinoso, 2006).
Activated carbons have surface areas in the range of 500-3000 m2 g -1. The porous structure of the carbons and their surface chemistry determine their properties and are influenced by the nature of the used raw materials and the methods of carbonization and activation (Bandosz, 2006; Dabrowski et al., 2005).
There are several sources that can give rise to activated carbons and the same source can originate activated carbons with different properties only by altering and
9
controlling the processes of carbonization and activation. The most commonly reported precursor materials in the literature are wood, coconut shell, fruit seeds, charcoal, lignin and synthetic macromolecular systems (Dabrowski et al., 2005; Marsh and Rodríguez-Reinoso, 2006; Srinivasakannan and Bakar, 2004). The starting material is chosen according to certain characteristics, such as: low content in inorganic matter, simple activation, high availability and low cost and low degradation during storage, and the purpose for which it is intended the activated carbon (Dabrowski et al., 2005).
One of the starting materials which can also be used to produce the activated carbon is biomass. When the biomass used for the production of activated carbon is of the lignocellulosic type, the name given to the product of the fast pyrolysis of biomass is biochar (Kim et al., 2012). Currently, much attention has been given to the use of biochars to water and air purification, since it is a renewable resource (Karakoyun et al., 2011).
The production of activated carbons involving lower costs and obtained from renewable sources is of great importance because the commercial activated carbons that are used as adsorbents in the removal of contaminants from wastewater are expensive materials. Therefore, it is necessary to develop less costly methods of producing activated carbon, which can be achieved using biomass materials as precursors of biochar, for example, primary sludge from paper pulp production, which will be the precursor used in this study.
1.2.2. The carbon element and the production of carbon materials
The carbon materials are mainly composed by the carbon element that has unique characteristics due to its electronic configuration (1s2 2s2 2p2) (Bandosz, 2006; Marsh and Rodríguez-Reinoso, 2006). There are three major carbon allotropic forms: diamond, graphite and fullerenes, which depend on the type of binding/hybridization between the carbon atoms. The most common form is graphite with a sp2 structure, being the most stable form and with less free energy so that most forms of carbon after heat treatment, tends to approach the allotropic structure of graphite. This process is called graphitization. Thus, the precursor materials after heat treatment give rise to carbons that are in the allotropic form of graphite. These materials can be categorized into graphitic and non- graphitic carbons, terms that are associated with their crystallographic order. The activated
10
carbons ("chars") are classified as non-graphitic because they have disordered microstructures. The non-graphitic carbon can be further divided into graphitizable carbons (anisotropic) and non-graphitizable (isotropic) depending if after thermal treatment (above 2000°C) they are able or not able to be converted to a graphitic carbon, respectively (Bandosz, 2006; Marsh and Rodríguez-Reinoso, 2006).
Figure 3 – Schematic representation of the carbon forms
Precursors from which activated carbons are produced are graphitic and non-graphitizable carbonaceous materials having an isotropic initial structure. These precursors which will undergo carbonization are generally organic materials (macromolecular systems) that go through to elevated temperatures suffering decomposition, involving the release of gaseous and liquid low molecular weight compounds. That is, a "pseudo- amorphous" carbon is formed which has a similar shape to that of the precursor material but having a lower density. The decomposition of the starting material ends upon the finish of the heat treatment and the greater the temperature more stable structures are formed. The temperature is then a decisive parameter for the structure of the final carbon. The decomposition process that occurs during the carbonization involve the movement of carbon atoms in short distances (it is presumed that those are smaller than 1 nanometer)
11
within the macromolecular network to positions of greater stability, resulting in the formation of six membered ring systems. Eventually, a network of carbon atoms is created with residual hydrogen atoms attached to them, which form the structure of carbon materials. Each precursor will undergo a characteristic decomposition giving rise to a particular carbon. In this process free spaces of atomic dimensions are formed that were occupied by heteroatoms which are released in the form of volatile or due to migration and cross-linkage of atoms of carbon to form a network, constituting the carbon main feature: porosity (Bandosz, 2006; Marsh and Rodríguez-Reinoso, 2006).
From the industrial point of view this kind of carbonization (called solid phase) are performed using lignocellulosic precursors and coals, giving rise to non-graphitizable carbons (isotropic) with high microporosity (Bandosz, 2006; Marsh and Rodríguez-Reinoso, 2006).
1.2.3. Characterisation of activated carbons
1.2.3.1. Structure and porosity
The structure and porosity of a coal are two characteristics that are closely linked, as the presence of porosity in the activated carbon is due to the organization of its structure. In turn, this porosity is the one responsible for the dominant adsorption properties that are presented by activated carbons. All this implies that to use effectively an activated carbon is necessary to know its origin and preparation method, since these are the two factors that influence its structure (Marsh and Rodríguez-Reinoso, 2006). Knowing the structure of graphite helps to understand the structure of an activated carbon.
a) Graphite
As mentioned above, most of the structures of all known forms of carbon , with the exception of the diamond shape, are associated with graphite , presenting a decrease in the order degree of a hexagonal crystal of graphite to the more disordered porous carbon and amorphous. Graphite consists in layers of graphene, that is, layers of hexagonal arrangements of carbon atoms. These layers are ordered in parallel in a sequence ABABAB having a distance between layer of 0,335 nanometers (nm). Within each layer,
12
linked atoms are separated by 0.142 nm and the bonds are σ trigonal with sp2 hybridization, existing delocalized π bonds. It is noted that the value of 0,142 nm is between the values of the connections for C(sp3)—C(sp3) (0.153 nm) and the values of the connections for C(sp2 )—C(sp2) (0.132 nm). In addition, the bond length of 0.142 nm is less than the interlayer distance which means that between the layers it has no formation of chemical bonds, only existing van der Waals forces (Bandosz, 2006; Marsh and Rodríguez-Reinoso, 2006).
In the case of diamond, the absence of layers similar to graphene causes the impossibility of having a porous structure. It is important to refer the diamond because there are suggestions that in the activated carbons the carbon atoms, which have an inherent porosity, may contain sp3 linkages (Marsh and Rodríguez-Reinoso, 2006).
The activated carbon presents, similarly to graphite, a microcrystalline structure. However, there are some differences among them in particular with regard to the interlayer space, which in the case of activated carbon is between 0.34 and 0.35 nm, and in the orientation of the aromatic sheets, which are less ordered on activated carbon (Marsh and Rodríguez-Reinoso, 2006).
b) Activated Carbon
When it is desired to obtain an activated carbon, the precursor material, which is carbonized in an inert atmosphere, tends to have a structure close to the one of graphite after pyrolysis, that is, there are formed structures that can be considered as segments (non-three-dimensional) of graphene sheets. These segments will have different sizes, reaching the order of nanometers, cavities, absence of flat surface, linear carbon atoms ("dangling bonds" - sp3 hybridization), presence of heteroatoms and will be connected together in an infinite number of shapes. These segments can be viewed as polycyclic aromatics compounds with various complex bonds forming a three-dimensional network of carbon atoms including carbon atoms with sp3 bonds. It is the random connection of the carbon atoms of the defective polycyclic groups with linear carbon atoms that creates the porosity of the carbon, that is, spaces created due to imperfect packing (Bansal and Goyal, 2005; Marsh and Rodríguez-Reinoso, 2006).
In general, it appears that the carbon sheets are made of condensed polyaromatic sheets which have at their ends heteroatoms. These heteroatoms will define some
13
characteristics of the activated carbon and thus may also play an important role in the adsorption process. In addition, this structure is also a free radical structure or with unpaired electrons that are stabilized by resonance and trapped during the carbonization process due to cleavage of bonds in the border of the aromatic sheets (Bansal and Goyal, 2005; Marsh and Rodríguez-Reinoso, 2006; Patricia et al., 2002).
The organization of the graphene layers of different classifications of carbons, and then its structure, is schematically represented in figure 4. In the case of Figure 4 (a) , the carbon was easily graphizated and graphene layers are parallel; in the case of Figure 4 (b), units that are not flat, establish connections during their formation during carbonization, which results in carbon with a low degree of graphitization. Heating up to 2000°C cannot change this organization, since it would then need to break many links simultaneously and overcome extremely high activation energies (Bansal and Goyal, 2005; Marsh and Rodríguez-Reinoso, 2006).
(a) (b)
Figure 4 – Schematic representation of grafitizable carbon (a) and non-grafitizable (b), based on the drawings adapted from Franklin Marsh and Rodríguez-Reinoso (2006).
As already mentioned, activated carbons have well-developed porous structure and a large specific inner surface. They consist mainly on carbon (87 to 97%) and other elements such as oxygen, hydrogen, sulphur and nitrogen. They might possess also other elements from the starting material and from the manufacturing process and also minerals and ash (inorganic matter). A typical activated carbon present a characteristic elemental composition of about 88% C, 0.5% N, 1.0%S and 6 to 7% O, being the remaining percentage associated with the inorganic ash. However, the percentage of oxygen varies depending on the starting material used and on the conditions of the activation process (Bandosz, 2006; Bansal and Goyal, 2005).
14
The pore size distribution and pore size are responsible for the high surface area of the activated carbon and, consequently, of the high adsorption capacity for organic and inorganic molecules. According to the International Union of Pure and Applied Chemistry (IUPAC), pores are classified as micropores, when smaller than 2 nm, mesopores for dimensions between 2 and 50 nm, and macropores larger than 50 nm. An activated carbon with a high microporosity has a high surface area. Thus, it is important that activated carbons have a large micropore volume with a pore size distribution appropriate so to have a large adsorption capacity and being capable of adsorbing molecules of different sizes. Also, it is important the existence of mesopores in proper proportion for facilitating the access to micropores. The macropores are not very important for the adsorption process but they can also act as transport channels for the adsorbate reach the meso- and micropores (Bansal and Goyal, 2005).
The higher the specificity of applications for what the activated carbon are intended, the greater control of pore size distribution is required, since with this control is possible, for instance, to adsorb and desorb molecules, distinguish kinetics of molecules with different size or even, “store” molecules (Chingombe et al., 2006; Marsh and Rodríguez-Reinoso, 2006).
1.2.3.2. Functional groups
Most applications of activated carbons are related to the presence of functional groups on its surface determining the chemical stability and the affinity of the adsorption process (Bandosz, 2006).
Generally, activated carbons own acidic and basic carbon-oxygen groups. Carboxyl, lactones and phenols groups, which make the carbon surface polar and hydrophilic, are considered as acidic groups. The basic groups are the ones like pyrones and chromenes structures (Figure 5) (Bansal and Goyal, 2005; Dabrowski et al., 2005; Patricia et al., 2002).
15
Figure 5 – Functional groups existing on the surface of a carbon (Marsh and Rodríguez-Reinoso, 2006)
These functional groups, not only influence the behaviour of the surface, water permeability, electrical or catalytic properties of the carbons, but also introduce the possibility to functionalize the surface of the activated carbon. This functionalization process open many doors for research aiming to solve a variety environmental problems (Bandosz, 2006; Patricia et al., 2002).
The nature and concentration of the surface charge of an activated carbon has also a central role in aqueous adsorption processes, being able to change it by modifying the pH of carbon-solution system. The surface charge of an activated carbon may be positive or negative depending if the pH of the system has a value below or above, respectively, the value of PZC (point of zero charge), that is, the value of pH where the total surface charge is zero. It is considered that the positive charge is related to the presence of basic groups on the surface, to excessive protonation of the surface at low pH values, and to graphene layers which act as Lewis bases (due to π delocalized electrons) resulting in the formation of donor-acceptor complexes important to the adsorption of many organic compounds in aqueous solution donor. The negative charge observed at high pH values is due to the ionization of the acidic groups which make the surface hydrophilic and polar (Bansal and Goyal, 2005; Patricia et al., 2002).
16
Since the organic compounds present in water may be polar or non-polar, interactions that will be present in the adsorption process may be electrostatic or dispersive. Moreover, hydrogen bonding can also be formed in some polar organic molecules (Bansal and Goyal, 2005; Patricia et al., 2002).
1.2.4. Production of activated carbons
1.2.4.1. Process steps
The process of producing an activated carbon involves two fundamental steps: carbonization and activation.
In the carbonization process, it takes place the elimination of most of the elements that are not carbon such as oxygen, hydrogen and nitrogen. These are volatilized by the initial pyrolytic decomposition. The residual elemental carbon atoms are grouped in flat layers, forming aromatic sheets randomly interconnected giving rise to an irregular arrangement of the same, responsible for the development of interstices/voids that give rise to porosity. Also, during the carbonization these pores are filled with heavy hydrocarbons or decomposition products or at least partially blocked with disordered carbon atoms. Generally, the carbonization process takes place at temperatures of around 800°C under inert atmosphere. The formed porous structure is strengthened and improved by the activation process which will allow greater random distribution of pores, which in turn will give rise to an extremely high surface area, reaching in some cases to 3000 m2 g-1. Depending on the chosen activation method, the activation step can be made before or after carbonization (Bansal and Goyal, 2005).
The development of porosity of an activated carbon is influenced by many experimental parameters related with the production process, in particular, the weight ratio between the precursor and the activating agent, the maximum activation temperature, residence time and nitrogen flow. The ratio between the activating agent and the precursor material is considered by many authors the factor that most influences the characteristics of the activated carbon (Alcañiz-Monge and Illan-Gomez, 2008; Azargohar and Dalai, 2008).
17
1.2.4.2. Chemical and physical activation methods
The main activation methods employed are chemical activation and physical activation (Bandosz, 2006). The method that was tested in the experimental approach of this work is the chemical activation.
a) Physical activation
The process of physical activation involves the carbonization of the starting material under an inert atmosphere followed by application of water vapour or carbon dioxide (CO2), or a mixture of both, for gasification of the produced carbon under
controlled conditions. The carbon gasification involves the removal of carbon atoms due to the reaction with the activating agents (water vapour and carbon dioxide) releasing carbon monoxide and hydrogen. It is a process that necessarily involves two steps, first the carbonization and then the activation with a gas and need very high temperatures. With this process, the porous structure is improved and the volatiles are removed leaving only carbon skeleton. A disadvantage of this method is that it cannot influence the micropore size distribution by manipulating experimental variables such as temperature, pressure and heating rate. However, this type of activation is quite used once it is generally applied to characterize the porosity of activated carbon (Dabrowski et al., 2005; Lillo-Rodenas et al., 2003; Marsh and Rodríguez-Reinoso, 2006).
b) Chemical activation
Chemical activation involves the addition of a chemical agent (activating agent) before the carbonization process (Bandosz, 2006). The parent material is impregnated with the activating agent prior to going through a process of pyrolysis (under inert atmosphere) and finally the produced carbon is washed for removal of excess of activating agent (Dabrowski et al., 2005; Junior, 2004). Although, generally the chemical activation is performed in one step, that is, the impregnation of the starting material (not charred) and then the carbonization (Hayashi et al., 2000; Tay et al., 2009), some authors suggest the impregnation of a precursor with an activating agent after a pyrolysis step, that is, the impregnation of a carbonized material. This process may be considered as having two
18
stages, like physical activation (Azargohar and Dalai, 2008; Cao et al., 2006). However, the chemical activation process in two steps is not much found in the literature.
The main reagents used as activating agents, referred to in the literature, are zinc chloride (ZnCl2) , phosphoric acid (H3PO4), potassium hydroxide (KOH) and sodium
hydroxide (NaOH) (Azargohar and Dalai, 2006; Cao et al., 2006; Junior, 2004; Srinivasakannan and Bakar, 2004; Tay et al., 2009). These agents have the ability to decompose the cellulosic material during pyrolysis resulting in the charring of the material and in the increase of the aromaticity of the carbon structure (Dabrowski et al., 2005; Junior, 2004; Khalili et al., 2000).
The chemical activation process is still not fully understood. For example, in the case of chemical activation with potassium hydroxide two versions are commonly referred to explain the activation process. One version is the suggestion that the addition (intercalation) of potassium compounds in the carbonaceous structure is the main factor responsible for the development of porosity. Other version is that the activation process is due to gasification reactions between the KOH and the carbon material (Alcañiz-Monge and Illan-Gomez, 2008). The latter version is justified by the yields obtained from the production of activated carbon from lignocellulosic precursors by chemical activation with KOH, which is close to those obtained by physical activation. On the other hand, it is considered that the reagent used as the activating agent, may be incorporated within the particles so as to inhibit the contraction of the precursor material that occurs during the pyrolysis when the temperature rises, together with weight loss. This fact indicates that the reagent may act as a template for the creation of microporosity (Marsh and Rodríguez-Reinoso, 2006).
The reduction of metallic ions to alkali metal atoms leads some authors to consider that intercalation occurs in the activation process. The intercalation is a property of graphite that is associated, as its name indicates, to the assembling of elements between the graphene layers resulting in the expansion of the interlayer spaces. Apparently, potassium is an element that is readily intercalated; however, with sodium the intercalation does not happen easily. Apparently, sodium prefers to assemble inside less ordered carbons (non-graphitic). In the intercalation process alkali transference of electrons occurs from the metal to the π conduction band that exists between the graphene layers. Supposedly, it is the removal of these intercalated metals, by the temperature increase, that will determine
19
the porosity of the final carbon (Alcañiz-Monge and Illan-Gomez, 2008; Marsh and Rodríguez-Reinoso, 2006). Therefore there are references about the differences between the use of NaOH and KOH with respect to the structural arrangement of the carbon. That is, the NaOH is said to be more effective for materials with a low structural order and KOH is better for materials with a high degree of order (Lillo-Ródenas et al., 2007).
However, although the mechanism of the activation process is not completely elucidated (Junior, 2004) according to some authors, the chemical activation using a hydroxide as activating agent seems to occur according to the following reaction:
6 MOH + 2C 2 M + 3H2 + 2M2CO3
Being M = Na or K. This reaction is an oxidation-reduction reaction in which the metallic cation undergoes reduction. The carbonate metal is one of the co-products formed during the process (Bandosz, 2006; Lillo-Ródenas et al., 2007; Tay et al., 2009).
In the case of using of zinc chloride as the activating agent, it acts as a dehydrating agent, promoting the decomposition of the precursor material during the pyrolysis process. In addition, zinc chloride also acts as a template, that is, when forming carbon part of this chemical remains in the interstices of the carbon, being removed using an extensive washing process of the activated carbon. Is this washing step that remove the zinc chloride that creates higher porosity (Khalili et al., 2000; Marsh and Rodríguez-Reinoso, 2006). The activated carbons prepared with zinc chloride are essentially microporous and the ratio(w/w) of zinc used has an important effect on the development of porosity and also in the micropores size distribution (Radovic, 2008). Zinc chloride is an activating agent that, until 1970, has been widely used, mainly for lignocellulosic precursor materials. However, it has some drawbacks such as low recovery efficiencies, corrosion problems, the presence of residual zinc in the carbon structure and the emission of metallic zinc, that may cause serious environmental problems. The strict control made to industrial emissions lead to the replacement of this chemical by phosphoric acid. Though, it appears that phosphoric acid limits the formation of tar and yields and high microporosity (Bandosz, 2006; Radovic, 2008).
The main differences between the use of KOH, H3PO4 and ZnCl2 are related to the
size of the porosity according to the ratio of the activation agent/precursor. For lignocellulosic starting materials, increasing the amount of KOH implies a greater microporosity and a broader size distribution of the micropores being negligible the
20
amount of mesopores formed. Regarding ZnCl2, there are development of both micropores
and mesopores. In the case of H3PO4 essentially microporous are developed but with some
formation of mesopores and macropores (Marsh and Rodríguez-Reinoso, 2006).
There are some advantages of chemical activation with respect to the physical activation, including higher yield, up to about 30% (w/w); lower pyrolysis temperatures are required; it is possible to obtain a larger surface area; pore sizes distribution is more easily controlled and maintained; and, the activation process is simpler, requiring no prior carbonization of the starting material. The main disadvantages are the use of chemicals which can be corrosive and affect the environment and also the fact that a final washing step of the product is required (Dabrowski et al., 2005; Junior, 2004; Lillo-Rodenas et al., 2003; Lillo-Ródenas et al., 2007; Tay et al., 2009).
1.2.5. Surface chemistry of activated carbons – functionalization
The possibility to modify the activated carbon surface in order to change and improve their adsorptive characteristics and make an activated carbon specific for a given application is one of the most interesting features of activated carbons. That is, even after the activation of a coal, it may be necessary to functionalize it for the formation of certain functional groups on the surface that interact with one or more specific compounds that one wants to adsorb. This process, which may be referred to as tailing is a way of introducing a specificity factor in the carbon that is to be produced. Thus, according to the functionalization, the carbon will adsorb only certain and specific adsorbates (Bandosz, 2006).
Changing the surface of coals consists, therefore, in the introduction of different functional groups in that material, and those groups will be formed depending on the type of treatment to which carbon is subjected. Some groups that can be obtained from certain treatments are presented in Table 2. These groups are attached to the corners or edges of aromatic sheets of the carbon changing the adsorptive capacity of the carbon, once those are the main part of the adsorptive surface (Bandosz, 2006).
In activated carbon there are areas in which are founded imperfections, flaws (voids in structural carbon, non-existence of aromatic rings). These areas with the ends of the
21
carbon layers are referred to as active sites being associated with high densities of unpaired electrons, which imply a high tendency to adsorb chemically heteroatoms such as oxygen, hydrogen, nitrogen, sulphur, among others, giving rise to stable compounds on the surface of the carbon. Due to the high complexity of the surface of activated carbon, this should be treated as a whole and not as the sum of all individual functional groups in that area. The surface of activated carbon will influence the amphoteric character (acid or base) of the same (Bandosz, 2006).
Table 2 – Surface functional groups on activated carbons and respective treatment (Bansal and Goyal, 2005; Bandosz, 2006)
FUNCTIONAL GROUP TREATMENT
Carbon-oxygen Oxidation
-Using gases or oxidant solutions - Heating at elevated temperature Carbon-hydrogen Hydrogenation
-Treatment with hydrogen at high temperatures Carbon-halogen (chlorine,
bromide)
Halogenation
-Treatment with gaseous halogens or in solution
Carbon-nitrogen Nitrogenation
- Reaction with nitrogenous compounds (ammonia, urea, melamine, hydrogen cyanide)
- Preparation of a carbon whose precursor which contains considerable amounts of nitrogen element (acridine)
Carbon-sulphur Sulfurization
- Heating the carbon with elemental sulphur or sulphurous gases (CS2,
H2S, SO2)
Metals - With metals or metal oxides.
The carbon-oxygen radicals are the most commonly found on the surface of an activated carbon. These groups are important for the acid-base characteristics of the carbons. The oxidation at elevated temperatures and with oxidizing agents in solution leads to acidification of the activated carbon. On the other hand, treatment at elevated temperatures removes compounds from the surface of the carbon, which leads to the formation of basic oxides (Bandosz, 2006; Bansal and Goyal, 2005).
22
The functionalization of activated carbons with halogens is done via physical and chemical adsorption, which may occur by:
- addition in unsaturated sites;
- exchange with chemically adsorbed hydrogen;
- oxidation of the carbon surface (Bandosz, 2006; Bansal and Goyal, 2005).
The type of process will depend on the nature of the activated carbon surface, on the amount of oxygen and hydrogen involved, on the experimental conditions and on the nature of the halogen species. For example, treatment with chlorine to modify carbons can be important when we want to have basic activated carbons. The reactivity of the halogen with coal decreases along the group of the periodic table (chlorine > bromine > iodine) (Bandosz, 2006; Bansal and Goyal, 2005).
Nitrogen existing in the surface of activated carbons plays a key role in the adsorptive properties of the same. At low temperatures nitrogen fixation is equivalent to the number of acidic groups containing oxygen and the carbon exhibits a slightly acidic character; at elevated temperatures substitution of the hydroxyl groups with amino groups occurs and also an increase of nitrogen atoms incorporated into graphitic layer in place of carbon atoms (Bandosz, 2006; Bansal and Goyal, 2005).
Sulphur is chemically adsorbed via connections with the peripheral carbon atoms, addition to unsaturated sites (with double bonds), penetration into the porous structure, and exchange by hydrogen or oxygen associated with the carbon surface (Bandosz, 2006; Bansal and Goyal, 2005).
Metals are associated to the change of the porous structure and of the characteristics of gasification (Bandosz, 2006; Bansal and Goyal, 2005).
The tailoring of the surface of activated carbons opens a wide range of possibilities so that can treat certain industry challenges, particularly in terms of catalytic processes, energy storage, remediation of aquatic environments, among others . It is an area that still has an enlarged open field in research studies (Bandosz, 2006) .
23
1.3.
A
DSORPTION AND THE STUDY OF REMOVAL OF PHARMACEUTICALS FROM WASTEWATERS1.3.1. Adsorption
The study and production of solid adsorbents have been a constant over the years, particularly in respect to inorganic materials and carbonaceous materials (which include the coals). As the name suggests, adsorbent materials are materials that have a high adsorption capacity, representing an added value at technological, environmental and biological levels. The adsorption phenomenon is extremely important with regard to practical applications, namely, in industry practices, chemical processes based on adsorption, such as catalytic and separative methods (which may include water, air and soil purification) as well as pollution control and respiratory protection (Dabrowski, 2001; Rouquerol et al., 2014)
The adsorption has, therefore, a great technological importance being currently a well-established technique regarding the removal of organic compounds from water (drinking water, effluents and wastewater). The use of activated carbons is considered the most efficient and economic process for removing such organic compounds by adsorption, being one of the best technologies for environmental control (Foo and Hameed, 2010; Hamdaoui and Naffrechoux, 2007a; Rouquerol et al., 2014).
The adsorption process is a non-specific method. Occurs due to interactions between atoms or molecules of the solid and fluid phase, being a surface phenomenon in which molecules of a substance are attracted to and adhere to the surface of a solid phase, often called the condensed phase (Marsh and Rodríguez-Reinoso, 2006; Pereira, 2012). The definition of adsorption according to IUPAC is given as "an increased concentration of a dissolved substance in a condensed phase and a liquid or gas phase interface due to the action of surface forces" (IUPAC, 2012).
Adsorption is a spontaneous process, that is, to occur it is necessary that the free energy of adsorption, , has a negative value. This free energy of adsorption depends,
in turn, on electrostatic forces ("Coulomb" forces) related to the dissociation or protonation of the adsorbate (if it is an electrolyte) and non- electrostatic, which include van der Waals interactions, hydrophobic interactions and hydrogen bonds. These latter interactions are of
24
physical nature, so when adsorption occurs due them, the adsorption process is designated as physical adsorption or physisorption. This type of adsorption is a reversible and exothermic process occurring with decrease of free energy and entropy. When the adsorption occurs by electrostatic forces is called chemical adsorption or chemisorption. The chemical adsorption occurs only in monolayer and some authors even consider that this type of process may involve valence forces through sharing or exchange of electrons (Bond, 1967; Dabrowski, 2001; Gregg and Sing, 1991; Ho, 2006; Marsh and Rodríguez-Reinoso, 2006; Moreno-Castilla, 2004; Pereira, 2012).
1.3.2. Adsorption isotherm
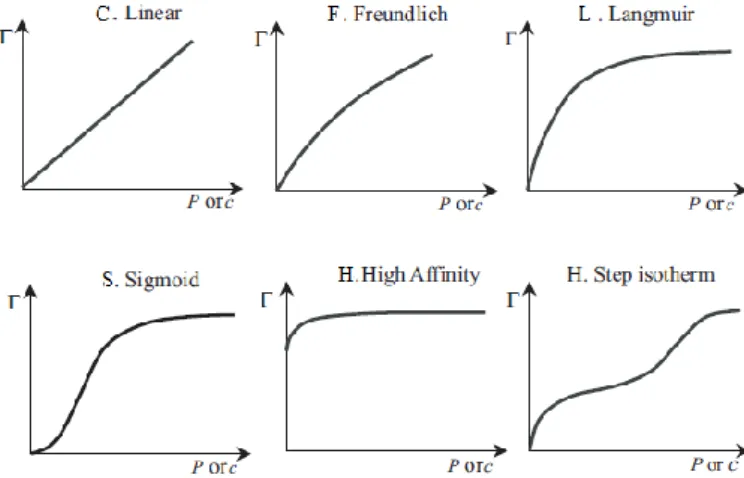
The fundamental concept of adsorption is expressed in the adsorption isotherms representing the equilibrium between the amount of adsorbed material, and the pressure or concentration of the fluid phase (liquid or gas) at a constant temperature. The isotherm is a distribution of potential adsorption along the carbon surface, which follows the Gaussian or normal distribution. Adsorption isotherms are essential for predicting, with a high degree of confidence, the adsorption parameters and the quantitative comparison of the behaviour of the adsorbent in different systems or in different experimental conditions. In water treatment processes using activated carbon, in order to be able to perform a quantitative analysis of the chemical compounds present in water that were adsorbed by activated charcoal, it is important to know the adsorption isotherm which allows determining the adsorption capacity that the activated carbon has for the compounds to be removed (Dabrowski, 2001; Foo and Hameed, 2010; Marsh and Rodríguez-Reinoso, 2006; Moreno-Castilla, 2004; Qi and Schideman, 2008).
In the literature, the concept of adsorption isotherm for activated carbon is often related to the adsorption of gases, because those are largely used for characterization of porosity of activated carbons. However, the concept of adsorption equilibrium of a gas is the same as for solutions, that is, when a gas is brought into contact with a solid, molecules/atoms of gas begin to be adsorbed by the surface of the solid. At first, the adsorption rate is higher because there is a lot of free surface. As the adsorption occurs and the surface starts to get filled, the reverse process (desorption) increasingly occurs while the adsorption rate decreases. When the rate of adsorption equals the rate of desorption, it is reached adsorption equilibrium, which will correspond to the maximum value that is
25
adsorbed by the solid. In statistical terms, for the study of adsorption from dilute solutions, the equations of gas adsorption monolayer can be used by simply replacing the term pressure by the concentration of solution and modifying the dimensions of some parameters (Bansal and Goyal, 2005; Gregg and Sing, 1991; Moreno-Castilla, 2004).
As already indicated, the gas adsorption isotherms are generally used to characterize the adsorbent material with respect to its porosity and specific surface area, that is, the area per mass unit. However, isotherms of fluid-solid systems can also be used to determine the surface area of the solid, having the benefit of not requiring a vacuum system, as in the case of a gas-solid adsorption system, making it a faster and easier procedure (Bansal and Goyal, 2005; Moreno-Castilla, 2004; Pereira, 2012). In this study, the solid-liquid isotherms are used to study the adsorption equilibrium of fluoxetine between the solid phase (carbon) and the aqueous phase (aqueous solution of fluoxetine-HCl).
There are some differences between the adsorption in liquid-solid and gas-solid system, in particular because in the first case, considering dilute solutions, the adsorption process is an exchange process, that is, the adsorbed molecule can either be drawn by the solid from the solution or being rejected because, for example, of their hydrophobic properties. In addition, an aqueous solution is far from ideal and present adsorbate-adsorbate interactions which are negligible in comparison with the gases. Thus, the isothermal solid-liquid systems cannot exhibit an ideal shape and the multilayer adsorption is also less frequent than in gas-solid systems (Dabrowski, 2001; Moreno-Castilla, 2004).
To obtain an adsorption isotherm it is common to represent on the axis of ordinates the amount of solute adsorbed, which is an approximation, since it can either occur adsorption of the solvent or solute. Considering there is only solute adsorption, the equilibrium adsorption capacity is expressed as follows:
( )
(equation 1) where:
- initial concentration of adsorbate in solution (mg L-1)
- residual concentration of adsorbate in solution at equilibrium (mg L-1) - volume of solution (L)
- mass of adsorbent (g) (Fuqiang et al., 2007) - amount of adsorbed solute (mg)
26
This equation (1) corresponds to the mass balance, at equilibrium, expressing the mass transfer of solute in the liquid phase to the solid surface which is represented by:
( ) ( ) (equation 2)
in that is the concentration of solute present in the solid at time t ( mg g-1), is the initial concentration of solute in the solid (usually zero) and is the solute concentration in the liquid phase at time t ( mg L-1) and is the initial concentration of the solution (mg L- 1) (Bandosz, 2006).
Equation (2) is applied to the dilute solutions in which the variation of volume associated to the adsorption of solute can be neglected. Thus, the adsorption of solute is given by the variation between the initial and final weights (balance) of the adsorbate in the solution, given by the term ( ) present in equation (2). It appears that an increase in the concentration of solute in the solution implies an increase in capacity of adsorption equilibrium until a maximum value from which no more variation is observed (Pereira, 2012).
Various models of adsorption isotherms are reported in the literature, some of which may present itself as a bit complex due to structural heterogeneity and energy of most adsorbents (Dabrowski, 2001).
The knowledge of the adsorption process involves the understanding of two factors intrinsic to it, namely, the adsorption equilibrium and also the adsorption kinetics. The adsorption kinetics is an important factor because adsorption is not a process that is independent of time, therefore, being necessary to know the variation of adsorption rate (over time) in a solid adsorbent as a way to evaluate and designing this adsorbent for the intended use. In practice, having a good adsorbent require combining these two factors, that is, it is appropriate that the adsorbent can adsorb the most of the desired compound, but also it should do it in a feasible time interval. It is also important to note that absorption is directly related to desorption, being that fact very important regarding the regeneration of the adsorbent, which is a major problem associated with the use of activated carbon (Azizian, 2004).
27
1.3.2.1. Kinetics adsorption models
The adsorption kinetics includes the study of the adsorption of ions and organics in solution as well as gases. For kinetic studies, there are a wide variety of models which have been proposed by several authors. However, the most commonly used models are the pseudo-first order and pseudo-second order, being the ones applied in this work.
Pseudo-first order model
The pseudo-first order model, also called the Lagergnen, is based on the adsorption capacity of the solid and finds that there is a direct proportionality relationship between the rate variation of solute uptake over time and the difference between the amount adsorbed at equilibrium and the amount adsorbed at time t. Thus, the mathematical expression that describes the kinetics of adsorption of pseudo-first order model is presented as follows:
( ) (equation 3)
being:
– quantity of adsorbate removed at time t per unit mass of adsorbent (mg g-1)
– adsorption capacity at equilibrium - mass of adsorbate per unit mass of adsorbent at equilibrium (mg g-1)
– rate constant of pseudo-first order (min-1).
Integrating the above equation for the initial conditions qt = 0 at t = 0 and qt = qt at t = t
gives the equation
( ) (equation 4) Whose nonlinear form is:
[ ( )] (equation 5)
is the constant related to the rate of change of pseudo-first order equation and reflects a combination of the rate constants of adsorption and desorption , and is not intrinsic to the adsorption constant. The relationship between the constant and the rate constants of adsorption and desorption is expressed by:
28
(equation 6)
This is a linear function of the initial concentration of solute. Thus, analyzing the value of at various initial concentrations, it is possible to calculate the constant of adsorption ( ) and desorption ( ), and hence the equilibrium constant, ( ), by the graphical representation of vs . The slope value will correspond to and the intersection to (Azizian, 2004).
Pseudo-second order model
The pseudo-second order model describes the behavior of the adsorption process in the whole range of contact time. It is expressed by the equation:
( ) (equation 7)
(g mg-1 min-1) is a constant value that is a complex function related to the initial concentration of solute.
Integrating equation 7, we obtain:
(equation 8) or (equation 9)
can be determined experimentally by plotting versus . It is also possible to define an initial rate of adsorption (for values close to zero), calculated using the expression: (Ahmed and Dhedan, 2012; Azizian, 2004; Hameed et al., 2008; Machado, 2011; Qiu et al., 2009; Sekar et al., 2004).
1.3.2.2. Equilibrium adsorption models
As already mentioned, in general, an adsorption isotherm is a function that describes the process that governs the retention/release or movement of a substance from the aqueous medium to a solid phase at constant temperature and pH, since these two variables influence the adsorption phenomenon. The adsorption equilibrium is established when the