EUROPEAN ORGANIZATION FOR NUCLEAR RESEARCH (CERN)
CERN-PH-EP/2013-086 2013/10/07
CMS-QCD-11-010
Measurement of neutral strange particle production in the
underlying event in proton-proton collisions at
√
s
=
7 TeV
The CMS Collaboration
∗Abstract
Measurements are presented of the production of primary K0
S and Λ particles in
proton-proton collisions at √s = 7 TeV in the region transverse to the leading charged-particle jet in each event. The average multiplicity and average scalar trans-verse momentum sum of K0SandΛ particles measured at pseudorapidities|η| <2 rise
with increasing charged-particle jet pTin the range 1–10 GeV/c and saturate in the
re-gion 10–50 GeV/c. The rise and saturation of the strange particle yields and transverse momentum sums in the underlying event are similar to those observed for inclusive charged particles, which confirms the impact-parameter picture of multiple parton interactions. The results are compared to recent tunes of the PYTHIA Monte Carlo
event generator. The PYTHIA simulations underestimate the data by 15–30% for K0S
mesons and by about 50% forΛ baryons, a deficit similar to that observed for the in-clusive strange particle production in non-single-diffractive proton-proton collisions. The constant strange- to charged-particle activity ratios with respect to the leading jet pT and the similar trends for mesons and baryons indicate that the
multiparton-interaction dynamics is decoupled from parton hadronization, which occurs at a later stage.
Published in Physical Review D as doi:10.1103/PhysRevD.88.052001.
c
2013 CERN for the benefit of the CMS Collaboration. CC-BY-3.0 license
∗See Appendix A for the list of collaboration members
1
1
Introduction
This paper describes a measurement of the production of primary K0Smesons,Λ and Λ baryons in the underlying event in proton-proton (pp) collisions at a centre-of-mass energy of 7 TeV with the Compact Muon Solenoid (CMS) detector at the Large Hadron Collider (LHC).
In the presence of a hard process, characterized by particles or clusters of particles with large transverse momentum pT with respect to the beam direction, the final state of hadron-hadron
interactions can be described as the superposition of several contributions: the partonic hard scattering, initial- and final-state radiation, additional “multiple partonic interactions” (MPI) and “beam-beam remnants” (BBR) interactions. The products of initial- and final-state radia-tion, MPI and BBR, form the “underlying event” (UE).
In this paper, the UE properties are analyzed with reference to the direction of the highest-pTjet
reconstructed from charged primary particles (leading charged-particle jet). This leading jet is expected to reflect the direction of the parton produced with the highest transverse momentum in the hard interaction. Three distinct topological regions in the hadronic final state are defined in terms of the azimuthal angle ∆φ between the directions of the leading jet and that of any particle in the event. Particle production in the “toward” region,|∆φ| <60◦, and in the “away” region,|∆φ| >120◦, is expected to be dominated by the hard parton-parton scattering. The UE structure can be best studied in the “transverse” region, 60◦< |∆φ| <120◦[1, 2].
Studies of the UE activity in charged primary particles in proton-proton collisions at different centre-of-mass energies have been published by the ATLAS [3] and CMS [1, 4, 5] collabora-tions. Observables such as the average multiplicity of charged primary particles per event, hereafter referred to as “average rate”, and the average scalar sum of primary particle pT per
event, hereafter referred to as “average pT sum”, have been measured in the transverse
re-gion. These quantities exhibit a steep rise with increasing charged-particle jet pTup to a value
that depends on the proton-proton centre-of-mass energy (around 10 GeV/c for pp collisions at 7 TeV), followed by a slow rise. Within the MPI framework, a hard jet is likely to be produced in collisions with a small impact parameter between the colliding protons, consequently result-ing in large MPI activity [6, 7]. The MPI activity saturates at values of the hard scale typical of central collisions.
The present analysis considers identified neutral strange particles (K0S, Λ, and Λ) as addi-tional probes to study the underlying event. Unless stated otherwise, Λ and Λ baryon data are merged and referred to as Λ baryon data. The production of primary K0S and Λ parti-cles in the transverse region at √s = 7 TeV is studied as a function of the scale of the hard process. Fully corrected average rates and pT sums of primary K0S mesons and Λ baryons, as
well as ratios to the charged primary-particle rates and pTsums are compared to simulations.
This analysis complements the studies of strangeness production in minimum-bias events at √
s = 7 TeV published by the ALICE [8, 9], ATLAS [10] and CMS [11] collaborations. Com-parisons of non-single diffractive data [11] with predictions made with the PYTHIA6 [12] and PYTHIA 8 [13] Monte Carlo event generators have shown that the latter largely underestimate
the data, e.g. by 30% for K0S production and 50% forΛ production at√s =7 TeV forPYTHIA6 tune D6T [2, 14], with little improvement for more recent tunes.
The simulations are performed with versions of PYTHIA that include MPI. The most recent versions have been tuned to reproduce the UE activity observed with primary charged particles at the LHC at 0.9 TeV and 7 TeV centre-of-mass energies. The parameters describing strangeness production, however, have not been tuned to LHC data yet. All Monte Carlo samples used in this paper have been generated with the default values of these parameters.
2 2 Experimental setup, data sets and data analysis
Recent literature [15–17] discussing the tuning of the strangeness suppression parameters in commonly-available generators is limited. A tuning of the PYTHIA6 parameters to LEP, SLD and Tevatron data performed with thePROFESSORprogram [15] produced best-fit parameters
in disagreement with the currentPYTHIA default parameters. The resulting predicted strange
meson and baryon production rates given in the Appendix of Ref. [15], however, do not agree well with the data used for the tuning. Other attempts to describe strange particle production in pp collisions are discussed in Refs. [16, 17]. The present paper focuses on the comparison withPYTHIA.
The outline of this paper is the following. In Section 2, the experimental conditions are de-scribed, along with the data sets, the simulation and the analysis technique. In Section 3, the systematic uncertainties are summarized. The results are discussed in Section 4, and conclu-sions are drawn in Section 5.
2
Experimental setup, data sets and data analysis
The central feature of CMS is a superconducting solenoid of 6 m internal diameter. Within the superconducting solenoid volume are a silicon pixel and strip tracker, a lead tungstate crystal electromagnetic calorimeter, and a brass/scintillator hadron calorimeter. Muons are measured in gas-ionization detectors embedded in the flux-return yoke. Extensive forward calorimetry complements the coverage provided by the barrel and endcap detectors. CMS uses a right-handed coordinate system, with the origin at the nominal interaction point, the x axis pointing to the centre of the LHC, the y axis pointing up (perpendicular to the LHC plane), and the z axis along the anticlockwise-beam direction. The polar angle θ is measured from the positive z axis and the azimuthal angle φ is measured in the x-y plane. The tracker measures charged particles within the pseudorapidity range|η| < 2.5, where η = −ln(tan(θ/2)). It consists of
1440 silicon pixel and 15 148 silicon strip detector modules and is located in the 3.8 T field of the superconducting solenoid. For the charged particles of interest in this analysis, the transverse momentum resolution is relatively constant with pT, varying from 0.7% at η =0 to 2% at|η| =
2. The transverse and longitudinal impact parameter resolutions, σd0 and σdz, respectively,
depend on pT and on η, ranging from σd0 = 400 µm and σdz = 1000 µm at pT = 0.3 GeV/c and
|η| > 1.4 to σd0 = 10 µm and σdz = 30 µm at pT = 100 GeV/c and|η| < 0.9. A more detailed
description of the CMS detector can be found in Ref. [18].
2.1 Event selection, data sets and Monte Carlo simulation
The event selection is identical to the one described in [1], unless explicitly stated otherwise. Minimum-bias events were triggered by requiring coincident signals in beam scintillator coun-ters located on both sides of the experiment and covering the pseudorapidity range 3.23 < |η| <4.65, and in the beam pick-up devices [18]. Events were then recorded with a prescaled
trigger requiring the presence of at least one track segment in the pixel detector with pT >
200 MeV/c. The trigger conditions are applied to both data and simulated samples. The trigger efficiency for the events selected in the analysis is close to 100% and no bias from the trigger selection is found.
The data used in this analysis were collected in early 2010 when pile-up (multiple pp collisions per proton bunch crossing) was very low. Selected events are required to contain a single reconstructed primary vertex, a condition that rejects about 1% of the events satisfying all the other selection criteria. The primary vertex is fit with an adaptive algorithm [19] and must have at least four tracks, a transverse distance to the beam line smaller than 2 cm, and a z coordinate within 10 cm of the nominal interaction point.
2.1 Event selection, data sets and Monte Carlo simulation 3
Events are required to contain a track-jet with reconstructed pT > 1 GeV/c and|η| <2.
Track-jets are reconstructed from the tracks of charged particles, with the anti-kT algorithm [20, 21]
and a clustering radius∆R = 0.5, where∆R = p(∆η)2+ (∆φ)2. The tracks are required to
be well reconstructed, to have pT > 500 MeV/c, |η| < 2.5, and to be consistent with
origi-nating from the primary vertex. More details on the track selection can be found in [1]. The reconstructed track-jet pT is the magnitude of the vector sum of the transverse momenta of
the tracks in the jet. The leading track-jet pT is corrected for detector response (track finding
efficiency and pTmeasurement) with detailed simulations based on GEANT4 [22], which have
been extensively validated with data [23–25]. This correction is approximately independent of the track-jet pTand η and its average value is 1.01. The leading corrected track-jet is referred to
as the leading charged-particle jet.
ThePYTHIAversions considered all include MPI. The tunes used are thePYTHIA6 D6T tune [2, 14] and thePYTHIA8 tune 1 [13], which have not been tuned to the LHC data, and thePYTHIA6 Z1 [26] and Z2* tunes. The two latterPYTHIA6 tunes, as well asPYTHIA8, include pT ordering
of the parton showers, and a new model [27] where MPI are interleaved with parton showering.
PYTHIA8 includes hard diffraction in addition to the new MPI model. The parton distribution
functions used for PYTHIA 6 D6T and PYTHIA 8 tune 1 are the CTEQ6L1 and CTEQ5L sets,
respectively. The Z1 tune uses the CTEQ5L parton distribution set, whereas Z2* is updated to CTEQ6L1 [28] and retuned to the underlying event activity at 7 TeV from Ref. [1] with the
PROFESSOR tool [15]. The simulated data are generated withPYTHIA6 version 6.422 for tunes
D6T and Z1, version 6.424 for tune Z2*, and version 8.135 forPYTHIA8 tune 1.
Simulated primary stable charged particles with a proper lifetime cτ >1 cm are clustered into jets with the anti-kTalgorithm (∆R = 0.5). The average rates and scalar pTsums of simulated
primary K0SandΛ particles are computed within the transverse region of the leading simulated charged-particle jet.
A data sample of 11 million events with at least one charged-particle jet with pT > 1 GeV/c
and|η| < 2 is analysed. The corresponding numbers of simulated events are 22 million for PYTHIA6 D6T and 5 million forPYTHIA6 Z1, Z2* andPYTHIA8 tune 1. Corrections for detector effects and background are estimated with the PYTHIA6 D6T sample, while the modeling of the underlying event is studied with all the tunes mentioned.
The reconstruction of the leading charged-particle jet results in a bias in the measured average rates and pT sums in the transverse region. The value of this bias ranges from+5% to+10%
for charged-particle jet pT below 10 GeV/c, and is consistent with zero for larger pT values.
It is caused by events in which the leading jet formed by primary charged particles is not reconstructed as the leading charged-particle jet because of tracking inefficiencies, and a sub-leading jet is thus reconstructed as the sub-leading jet. This results in a reconstructed transverse region shifted in φ. The correction for this bias is obtained from the detailed Monte Carlo simulations of the detector response described above.
The primary vertex selection causes a small overestimate of the UE strangeness activity at low charged-particle jet pT, at most 5% for charged-particle jet pT = 1 GeV/c. This is because the
requirement that at least four tracks be associated to the primary vertex enriches the sample in events with higher UE activity when the charged-particle jets have very low multiplicity. This bias is corrected by means of detailed simulations as described in Section 3.
4 2 Experimental setup, data sets and data analysis
2.2 Selection of primary V0 candidates and analysis strategy
The neutral strange particles K0S, Λ and Λ, hereafter generically called V0s, are identified by means of their characteristic decay topology: a flight distance of several centimeters before decay, two tracks of opposite charge emerging from a secondary vertex, and an invariant mass consistent with that of a K0Smeson or aΛ baryon. The V0momentum vector is further required to be collinear with the vector joining the primary and secondary vertices, in order to select primary particles.
The V0 candidates are reconstructed by the standard CMS offline event reconstruction pro-gram [25]. Pairs of oppositely-charged tracks with at least 3 hits in the CMS tracker and with a non-zero transverse impact parameter with respect to the beam line are selected (the transverse impact parameter divided by its uncertainty is requested to be larger than 1.5). Pairs of tracks with a distance of closest approach to each other smaller than 1 cm are fit to a common sec-ondary vertex, and those with a vertex fit χ2smaller than 7 and a significant distance between the beam line and the secondary vertex (transverse flight distance divided by its uncertainty larger than 8) are retained.
Well-reconstructed V0 candidates are selected by applying cuts on the pseudorapidity and transverse momentum of the decay tracks (|η| < 2.5, pT > 300 MeV/c), of the V0 candidate
(|η| < 2; pT > 600 MeV/c for K0S mesons, pT > 1.5 GeV/c forΛ baryons) and on the V0
trans-verse flight distance (>1 cm from the beam line). A kinematic fit is then performed on the can-didates to further purify the sample of primary strange particles. The fit includes a secondary vertex constraint, a mass constraint, as well as the constraint that the V0 momentum points
away from the primary vertex. All three hypotheses (K0
S → π+π−,Λ→ pπ−andΛ →pπ+)
are tested for each candidate and the most probable hypothesis is considered. Candidates with a kinematic-fit probability larger than 5% are retained.
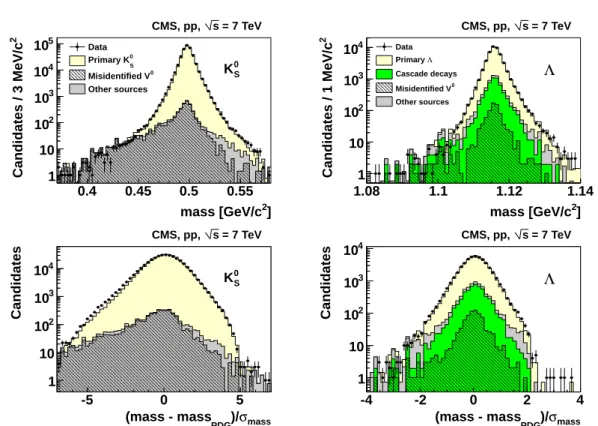
Since simulations enter in the determination of the V0selection efficiency and purity, a good de-scription of the distributions of the kinematic-fit input variables is important. The distributions of the invariant mass of the V0 candidates for the most probable particle type hypothesis are shown in Fig. 1, together with the distributions of the invariant-mass pull. The invariant-mass pull is the difference between the reconstructed mass and the accepted V0mass value [29],
di-vided by the uncertainty on the reconstructed mass calculated from the decay track parameter uncertainties. The signal and background fractions are shown as predicted byPYTHIA6 D6T. The backgrounds in the K0S sample are mostly misidentified Λ baryons. Backgrounds in the Λ sample are mostly non-primary Λ baryons from cascade decays of Ξ and Ω baryons, plus contributions from misidentified K0Smesons and converted photons. In general, the simulation agrees with the data. As an example, the average mass values for K0S mesons (Λ baryons) are 0.4981 GeV/c2(1.116 GeV/c2) in the simulation and 0.4977 GeV/c2(1.116 GeV/c2) in the data; the corresponding R.M.S. values for the mass pull distributions are 1.17 (0.512) in the simulation and 1.23 (0.531) in the data. For K0S candidates, the data show larger tails than the simulation at mass pull values below (−2). The presence of a similar tail in the component shown as the hatched histogram of the simulated distribution indicates that this excess is due to a larger con-tribution from misidentified baryons in the data compared to the simulation. This is accounted for in the background estimation as described below.
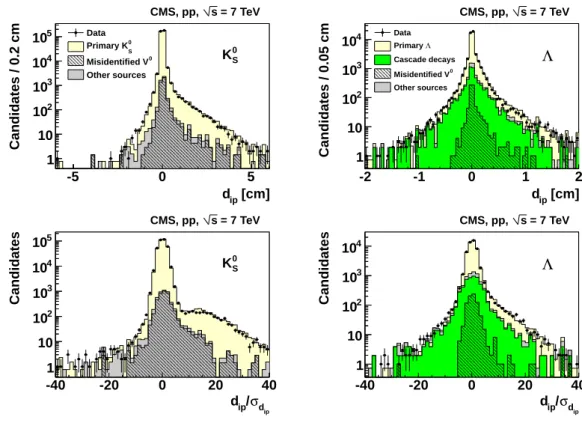
The pointing requirement constrains the signed impact parameter dipof the V0with respect to
the primary vertex. This variable is defined as the distance of closest approach of the V0
trajec-tory to the primary vertex, and its sign is that of the scalar product of the V0momentum and the vector pointing from the primary vertex to the point of closest approach. The distributions of the signed impact parameter are shown in Fig. 2 together with the distributions of the
cor-2.2 Selection of primaryV0candidates and analysis strategy 5 ] 2 mass [GeV/c 0.4 0.45 0.5 0.55 2 Candidates / 3 MeV/c 1 10 2 10 3 10 4 10 5 10 0 S K = 7 TeV s CMS, pp, Data 0 S Primary K 0 Misidentified V Other sources ] 2 mass [GeV/c 1.08 1.1 1.12 1.14 2 Candidates / 1 MeV/c 1 10 2 10 3 10 4 10 Λ = 7 TeV s CMS, pp, Data Λ Primary Cascade decays 0 Misidentified V Other sources mass σ )/ PDG (mass - mass -5 0 5 Candidates 1 10 2 10 3 10 4 10 0 S K = 7 TeV s CMS, pp, mass σ )/ PDG (mass - mass -4 -2 0 2 4 Candidates 1 10 2 10 3 10 4 10 Λ = 7 TeV s CMS, pp,
Figure 1: Distributions of invariant mass and invariant-mass pull for the most probable particle type hypothesis determined by the kinematic fit. The accepted K0S and Λ mass values from Ref.[29] are denoted as massPDG. The black points indicate the data. The histograms show
the backgrounds (hatched: misidentified V0; green: non-primary Λ from Ξ and Ω cascade
decays; grey: other sources) and the signal (yellow) as predicted byPYTHIA6 D6T. ThePYTHIA
6 2 Experimental setup, data sets and data analysis
responding pull, defined as dip divided by its uncertainty σdip calculated from the decay track
parameter uncertainties. The quality of the description of the data by the simulation is good, in-cluding the tails at positive impact parameter values. The large pulls for secondaryΛ baryons from cascade decays allow the suppression of this background by means of the kinematic fit.
[cm] ip d -5 0 5 Candidates / 0.2 cm 1 10 2 10 3 10 4 10 5 10 = 7 TeV s CMS, pp, 0 S K Data 0 S Primary K 0 Misidentified V Other sources [cm] ip d -2 -1 0 1 2 Candidates / 0.05 cm 1 10 2 10 3 10 4 10 DataPrimary Λ Cascade decays 0 Misidentified V Other sources Λ = 7 TeV s CMS, pp, ip d σ / ip d -40 -20 0 20 40 Candidates 1 10 2 10 3 10 4 10 5 10 0 S K = 7 TeV s CMS, pp, ip d σ / ip d -40 -20 0 20 40 Candidates 1 10 2 10 3 10 4 10 Λ = 7 TeV s CMS, pp,
Figure 2: Distributions of the signed impact parameter dipwith respect to the primary vertex,
and the corresponding pull distributions, for the most probable particle type hypothesis de-termined by the kinematic fit. The black points indicate the data. The histograms show the backgrounds (hatched: misidentified V0; green: non-primaryΛ from Ξ and Ω cascade decays; grey: other sources) and the signal (yellow) as predicted byPYTHIA6 D6T. ThePYTHIA
predic-tion is normalized to the data.
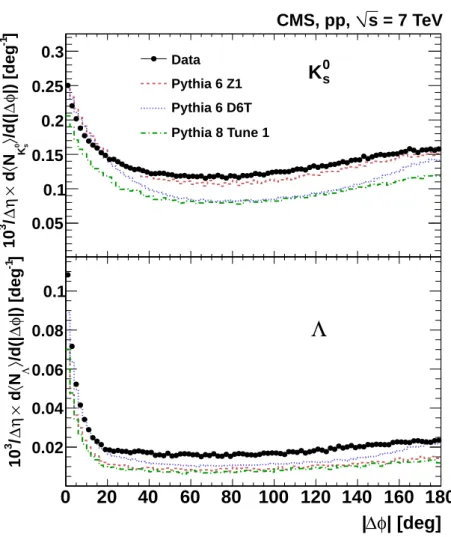
The uncorrected average rates of reconstructed V0 candidates passing the selection cuts per unit pseudorapidity are shown in Fig. 3 as a function of the difference in azimuthal angle|∆φ| between the V0candidate and the leading charged-particle jet. Uncorrected data are compared to PYTHIA events passed through the detailed detector simulation. The dependence of the
rates on|∆φ|is qualitatively described by the PYTHIA tunes considered. The simulation
un-derestimates significantly the V0rates in the transverse region. The peak at|∆φ| ≈0◦ is more
pronounced for baryons than for K0S mesons. The simulation indicates that the harder pT cut
applied to the baryon candidates is responsible for this feature; the distributions are similar when the same pT cut is applied to both V0types.
The backgrounds to the K0SandΛ samples are estimated with two methods. The first is based on simulation. Candidates not matched to a generated primary V0of the corresponding type
are counted as background. The PYTHIA 6 D6T sample is used. To account for the known
deficit of strange particles in the simulation (see Section 1), the contribution from K0
S mesons
misidentified asΛ baryons is weighted by the ratio of K0Srates measured in non-single diffrac-tive events to those inPYTHIA6 D6T, 1.39 [11]. Similarly, the contribution from misidentifiedΛ baryons is weighted by a factor of 1.85, and the contribution arising from non-primary baryons
2.2 Selection of primaryV0candidates and analysis strategy 7 [deg] φ ∆ 0 20 40 60 80 100 120 140 160 180 ] -1 |) [deg φ∆ /d(| 〉0 s K N 〈 d × η∆ / 3 10 0.05 0.1 0.15 0.2 0.25 0.3 Data Pythia 6 Z1 Pythia 6 D6T Pythia 8 Tune 1 = 7 TeV s CMS, pp, 0 s
K
| [deg]
φ
∆
|
0
20
40
60
80
100 120 140 160 180
] -1 |) [deg φ∆ /d(| 〉 Λ N 〈 d × η∆ / 3 10 0.02 0.04 0.06 0.08 0.1Λ
Figure 3: Uncorrected average rate of selected V0 candidates per event, per degree and per
unit pseudorapidity within |η| < 2, as a function of the difference in azimuthal angle |∆φ|
between the V0 candidate and the leading charged-particle jet. Data and detailed simulation of minimum-bias events with different PYTHIA tunes are shown for reconstructed charged-particle jet pT >1 GeV/c. Top: K0Scandidates with pT >600 MeV/c; bottom:Λ candidates with
8 3 Systematic uncertainties
from Ξ and Ω decays is weighted by the ratio of the measured and simulated Ξ production rates, 2.67 [11].
The second method is based on data. The signal and background contributions are extracted from a fit to the distribution of the kinematic fit χ2-probability, with signal and background shapes obtained from simulation. Apart from the background normalization, the measured and simulated pull distributions of the constrained variables (Figs. 1 and 2), as well as the mea-sured and simulated χ2-probability distributions (not shown) are in good agreement. These facts, as well as goodness-of-fit tests, validate the approach.
In both methods, the background is estimated as a function of the charged-particle jet pTfor the
rate measurements, and as a function of the V0 p
Tfor the V0 pT spectra and the pT sum
mea-surements. The background estimations from the two methods are in reasonable agreement, and exhibit the same dependence on the charged-particle jet and V0 pT. The final background
estimates are computed as the average of the results of the two methods, and the correspond-ing systematic uncertainties are taken as half the difference of the two results. The background fraction for K0S increases from(1.5±1.1)% at charged-particle jet pT = 1 GeV/c to(3.3±1.7)%
at charged-particle jet pT = 10 GeV/c and remains constant at higher charged-particle jet pT.
The background is(8±2)% for baryons, independent of the charged-particle jet pT.
The K0S andΛ raw yields are corrected for purity (defined as 1 – background fraction) as well as for acceptance and reconstruction efficiency. Each V0 candidate is weighted by the product of the purity times A×e1 , where A denotes the acceptance of the cuts on the V0transverse flight distance and on the pT, η of the decay particles, and e denotes the reconstruction and selection
efficiency for accepted V0 candidates. The product of acceptance times efficiency is computed in V0 (pT, η) bins from a sample of 50 million PYTHIA 6 D6T minimum-bias events passed
through the detailed detector simulation. The average values of the product of acceptance and efficiency in this sample for K0
S mesons,Λ and Λ baryons within the kinematic cuts (|η| < 2;
pT > 600 MeV/c for K0S, pT > 1.5 GeV/c forΛ and Λ) are 11.3%, 8.4% and 6.6%, respectively,
including the branching fractions B(K0S → π+π−) = 69.2% and B(Λ → pπ−) = B(Λ →
pπ+) =63.9% [29]. The acceptance depends strongly on the V0 pT, while the efficiency varies
by a factor of about two in the V0p
Tand η ranges selected. The smaller efficiency forΛ baryons
than forΛ baryons reflects the higher interaction cross section of antiprotons with the detector material compared to that of protons. The correctedΛ and Λ yields are found to be compatible when accounting for the systematic uncertainty due to the modelling of the antiproton cross section in the GEANT4 version used [30] (see Section 3).
The consistency of the correction method was checked by applying it to all other Monte Carlo samples and comparing the results to the known generated values. Further support to the correction procedure is provided by the fact that the simulation reproduces well several key aspects of the data, most notably the reconstruction efficiency [23, 24] and the angular distri-butions of the V0 decay tracks as a function of the V0 pT. The reliability of the simulation for
K0SandΛ reconstruction was checked by comparing the lifetimes obtained from fits to the cor-rected proper time distributions with the world averages [11]. The stability of the results when varying the V0 selection cuts was also checked. The resulting overall contribution of the V0 reconstruction to the systematic uncertainty is given in Section 3.
3
Systematic uncertainties
The main sources of systematic uncertainties are described below, with numerical values sum-marized in Table 1.
9
Leading charged-particle jet selection The bias in rates and pT sums due to mismatches
be-tween the reconstructed and the simulated leading charged-particle jets is corrected by means of detailed simulations. The systematic uncertainty is estimated from the resid-ual difference in rates and pT sums when the reconstructed and the simulated leading
charged-particle jets are matched within∆R=0.3.
Primary vertex selection The bias caused by the requirement of a minimum track multiplicity
at the primary vertex is corrected by means of detailed simulations of minimum-bias events with thePYTHIA6 Z1 tune. The primary charged particle multiplicity in 7 TeV pp
collisions is well described by this tune [1]. The corresponding uncertainty is estimated from the spread of the corrections computed withPYTHIA6 tunes D6T, Z1 andPYTHIA8 tune 1.
Modelling ofV0reconstruction efficiency The systematic uncertainty on the V0
reconstruc-tion efficiency is estimated from closure tests and from the stability of the results with respect to the V0selection cuts, as described in Section 2.2.
Detector material The overall mass of the tracker and the relative fractions of the different
tracker materials are varied in the simulations, with the requirement that the resulting predicted tracker weight be consistent with the measured weight [31]. The difference between the results thus obtained and the nominal results is taken as a contribution to the systematic uncertainty.
GEANT4 cross sections A 5% systematic uncertainty is assigned to the baryon yields, as a
re-sult of the known imperfect modelling of the low-energy antiproton interaction cross section in the GEANT4 version used [30].
Statistical uncertainty on theV0yield correction A small contribution to the total uncertainty
stems from the finite size of the sample of minimum-bias events passed through the full detector simulation (50 million events), from which the correction is computed.
Estimation ofV0background The uncertainty on the background remaining after V0
identifi-cation by means of the kinematic fit is taken as half the difference between the results of the two background estimation methods used.
The uncertainty on the beam spot position and size gives a negligible contribution to the total uncertainty.
4
Results
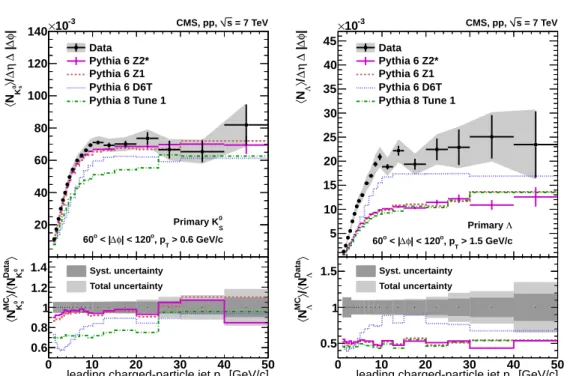
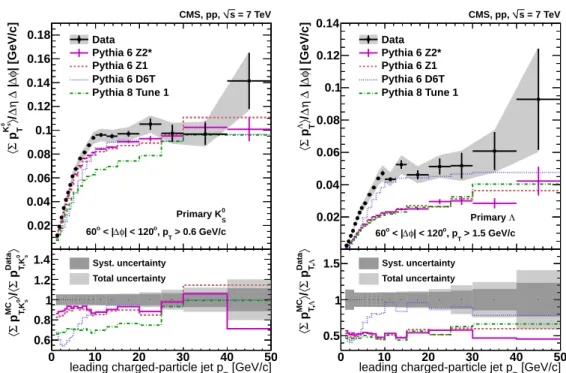
The V0production rates in the transverse region are shown in Fig. 4 as a function of the leading charged-particle jet pT, and the V0scalar pT sums in the transverse region are shown in Fig. 5.
The rates and pT sums exhibit a rise with increasing hard scale, followed by a plateau. The
turn-on of the plateau is located at charged-particle jet pT '10 GeV/c for both primary mesons
and baryons. Above the turn-on, the rates and pTsums are essentially constant, implying also
a constant strange-particle average pTabove the turn-on.
A comparison can be made with the trends observed for charged primary particles [1] in spite of the different jet reconstruction algorithm used in Ref. [1] (SISCone). The dependence of the UE activity on the charged-particle jet pTis very similar to that observed for charged primary
10 4 Results
Table 1: Systematic uncertainties on the measured average V0rates and pTsums.
Average rates
Source K0
S(%) Λ (%)
Leading charged-particle jet selection 3 7
Primary vertex selection 1 1
Modelling of V0efficiency
charged-particle jet pT≤2.5 GeV/c 3 10
charged-particle jet pT>2.5 GeV/c 3 3
Detector material 3 3
GEANT4 cross sections — 5
Statistical uncertainty on V0weights 600 MeV/c< pV0
T <700 MeV/c 0.1 —
1.5 GeV/c< pVT0 <1.6 GeV/c 0.03 0.33 6 GeV/c< pVT0 <8 GeV/c 1.4 8.3 Background estimation
charged-particle jet pT =1 GeV/c 1.1 2
charged-particle jet pT =10 GeV/c 1.7 2
Total
charged-particle jet pT =1 GeV/c 6 14
charged-particle jet pT =10 GeV/c 6 10
Average pTsums Source K0S(%) Λ (%) Background estimation pVT0 =600 MeV/c 0.1 — pV0 T =1.5 GeV/c 0.8 0.3 pVT0 =8 GeV/c 3.6 4.0
11 0 10 20 30 40 50 | φ∆ | ∆ η∆ / 〉0 s K N 〈 20 40 60 80 100 120 140 -3 10 × Data Pythia 6 Z2* Pythia 6 Z1 Pythia 6 D6T Pythia 8 Tune 1 = 7 TeV s CMS, pp, 0 S Primary K > 0.6 GeV/c T , p o | < 120 φ ∆ < | o 60 [GeV/c] T
leading charged-particle jet p
0 10 20 30 40 50 〉 Data 0Ks N 〈 / 〉 MC 0Ks N 〈 0.6 0.8 1 1.2 1.4 Syst. uncertainty Total uncertainty [GeV/c] T
leading charged-particle jet p
0 10 20 30 40 50 | φ∆ | ∆ η∆ / 〉Λ N 〈 5 10 15 20 25 30 35 40 45 -3 10 × Data Pythia 6 Z2* Pythia 6 Z1 Pythia 6 D6T Pythia 8 Tune 1 = 7 TeV s CMS, pp, Λ Primary > 1.5 GeV/c T , p o | < 120 φ ∆ < | o 60 [GeV/c] T
leading charged-particle jet p
0 10 20 30 40 50 〉 Data Λ N 〈 / 〉 MC Λ N 〈 0.5 1 1.5 Syst. uncertainty Total uncertainty
Figure 4: Average multiplicity per unit of pseudorapidity and per radian in the transverse region (|η| < 2, 60◦ < |∆φ| < 120◦), as a function of the pT of the leading charged-particle
jet: (left) K0Swith pT > 0.6 GeV/c; (right) Λ with pT > 1.5 GeV/c. Predictions ofPYTHIA tunes
are compared to the data and the ratios of simulations to data are shown in the bottom panels. For the data, the statistical uncertainties (error bars) and the quadratic sum of statistical and systematic uncertainties (error band) are shown, while for simulations the uncertainty is only shown forPYTHIA6 tune Z2*, for clarity.
12 4 Results
[GeV/c]
T
leading charged-particle jet p
0 10 20 30 40 50 | [GeV/c] φ∆ | ∆ η∆ / 〉 0 s K T p Σ〈 0.02 0.04 0.06 0.08 0.1 0.12 0.14 0.16 0.18 Data Pythia 6 Z2* Pythia 6 Z1 Pythia 6 D6T Pythia 8 Tune 1 = 7 TeV s CMS, pp, 0 S Primary K > 0.6 GeV/c T , p o | < 120 φ ∆ < | o 60 [GeV/c] T
leading charged-particle jet p
0 10 20 30 40 50 〉 Data 0 s T ,K p Σ〈 / 〉 MC 0 s T ,K p Σ〈 0.6 0.8 1 1.2 1.4 Syst. uncertainty
Total uncertainty [GeV/c]
T
leading charged-particle jet p
0 10 20 30 40 50 | [GeV/c] φ∆ | ∆ η∆ / 〉 Λ T p Σ〈 0.02 0.04 0.06 0.08 0.1 0.12 0.14 Data Pythia 6 Z2* Pythia 6 Z1 Pythia 6 D6T Pythia 8 Tune 1 = 7 TeV s CMS, pp, Λ Primary > 1.5 GeV/c T , p o | < 120 φ ∆ < | o 60 [GeV/c] T
leading charged-particle jet p
0 10 20 30 40 50 〉 Data ΛT, p Σ〈 / 〉 MC ΛT, p Σ〈 0.5 1 1.5 Syst. uncertainty Total uncertainty
Figure 5: Average scalar pT sum per unit of pseudorapidity and per radian in the transverse
region (|η| < 2, 60◦ < |∆φ| < 120◦), as a function of the pT of the leading charged-particle
jet: (left) K0Swith pT > 0.6 GeV/c; (right) Λ with pT > 1.5 GeV/c. Predictions ofPYTHIA tunes
are compared to the data and the ratios of simulations to data are shown in the bottom panels. For the data, the statistical uncertainties (error bars) and the quadratic sum of statistical and systematic uncertainties (error band) are shown, while for simulations the uncertainty is only shown forPYTHIA6 tune Z2*, for clarity.
13
around 10 GeV/c in pp collisions at√s =7 TeV, is independent of the type of primary particle used to probe the UE activity. These observations are consistent with the impact parameter pic-ture of particle production in hadron collisions [6, 7], in which the MPI contribution saturates at scales typical of central collisions.
ThePYTHIA 6 Z1 and Z2* tunes qualitatively reproduce the dependence of the K0S rate and pT
sum on the charged-particle jet pT, but exhibit a 10–15% deficit in the yield, independent of the
charged-particle jet pT. PYTHIA 8 tune 1 underestimates the activity by about 30%. For theΛ
baryons, PYTHIA6 tunes Z1, Z2* and PYTHIA8 tune 1 underestimate the rates by about 50%. After being tuned to the charged-particle data,PYTHIA6 Z2* models strangeness production in the UE in a very similar way as Z1, in spite of the different parton distribution set used.
[GeV/c] T p 0 s K 0 2 4 6 8 Candidates / GeV/c 3 10 4 10 5 10 6 10 Data Pythia 6 Z1 (x0.98) Pythia 6 D6T (x1.54) Pythia 8 Tune 1 (x1.33) = 7 TeV s CMS, pp, 0 S Primary K > 3 GeV/c jet T p o | < 120 φ ∆ < | o 60 [GeV/c] T p Λ 0 2 4 6 8 Candidates / GeV/c 3 10 4 10 5 10 6 10 = 7 TeV s CMS, pp, Data Pythia 6 Z1 (x1.88) Pythia 6 D6T (x1.97) Pythia 8 Tune 1 (x2.32) Λ Primary > 3 GeV/c jet T p o | < 120 φ ∆ < | o 60
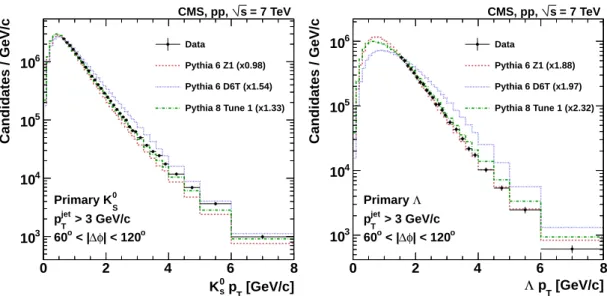
Figure 6: V0 pT distributions corrected for selection efficiency and background without
cor-rection to the leading charged hadron jet, in the region transverse to a leading reconstructed charged-particle jet with pT > 3 GeV/c, compared to predictions from differentPYTHIA tunes
(left: K0S; right:Λ). Error bars indicate the quadratic sum of the statistical and systematic uncer-tainties. Simulations are normalized to the first pT bin in the data, with normalization factors
given in parentheses.
PYTHIA 6 D6T shows a dependence of the activity on the charged-particle jet pT that differs
from that of the data and of the other tunes. In addition, the V0 pT distributions predicted
by PYTHIA 6 D6T in the transverse region are in strong disagreement with the data. As an illustration, the pT spectra are shown in Fig. 6 for events with a reconstructed charged-particle
jet pT > 3 GeV/c (without correction to the leading charged hadron jet). For the K0S case, in
the pT range observed (pT > 600 MeV/c),PYTHIA 6 tune D6T shows a much harder spectrum
than the data, while tune Z1 shows a softer spectrum and PYTHIA 8 tune 1 reproduces the shape well. For theΛ case, in the pT > 1.5 GeV/c range, PYTHIA6 D6T shows a much harder
spectrum than the data, while the other simulations describe the data reasonably well.
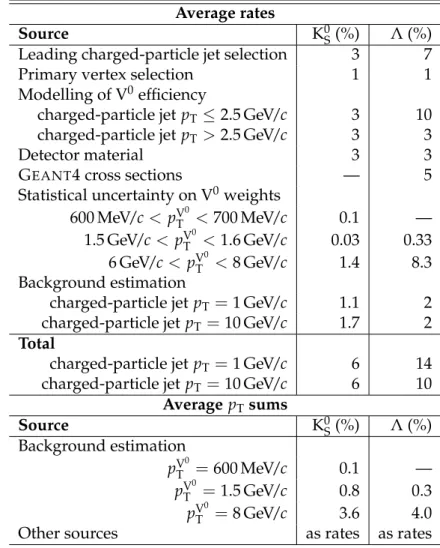
The ratios of the rates and pTsums of primary V0mesons to the rates and pTsums of primary
charged particles from Ref. [1] are shown in Fig. 7. The data are integrated over the same pseu-dorapidity range for strange and charged particles,|η| <2. The K0Sto charged-particle activity
ratios are constant in the charged-particle jet pT range 3–50 GeV/c, i.e. almost throughout the
whole range studied and, specifically, across the turn-on of the plateau around 10 GeV/c. An increase is seen below 3 GeV/c. This feature is also present in the simulations but is not as pronounced as in the data, and not in all tunes studied.
14 4 Results
[GeV/c]
T
leading charged-particle jet p
0 10 20 30 40 50 〉 charged N 〈 / 〉0 s K N 〈 0.02 0.04 0.06 0.08 0.1 0.12 0.14 = 7 TeV s CMS, pp, Data Pythia 6 Z2* Pythia 6 Z1 Pythia 6 D6T Pythia 8 Tune 1 o | < 120 φ ∆ < | o 60 > 0.5 GeV/c charged T > 0.6 GeV/c, p 0 S K T p [GeV/c] T
leading charged-particle jet p
0 10 20 30 40 50 〉 charged T p Σ〈 / 〉 0 s K T p Σ〈 0.02 0.04 0.06 0.08 0.1 0.12 0.14 0.16 = 7 TeV s CMS, pp, Data Pythia 6 Z2* Pythia 6 Z1 Pythia 6 D6T Pythia 8 Tune 1 o | < 120 φ ∆ < | o 60 > 0.5 GeV/c charged T > 0.6 GeV/c, p 0 S K T p [GeV/c] T
leading charged-particle jet p
0 10 20 30 40 50 〉 charged N 〈 / 〉 Λ N 〈 5 10 15 20 25 30 35 40 -3 10 × CMS, pp, s = 7 TeV Data Pythia 6 Z2* Pythia 6 Z1 Pythia 6 D6T Pythia 8 Tune 1 o | < 120 φ ∆ < | o 60 > 0.5 GeV/c charged T > 1.5 GeV/c, p Λ T p [GeV/c] T
leading charged-particle jet p
0 10 20 30 40 50 〉 charged T p Σ〈 / 〉 Λ T p Σ〈 0.02 0.04 0.06 0.08 0.1 = 7 TeV s CMS, pp, Data Pythia 6 Z2* Pythia 6 Z1 Pythia 6 D6T Pythia 8 Tune 1 o | < 120 φ ∆ < | o 60 > 0.5 GeV/c charged T > 1.5 GeV/c, p Λ T p
Figure 7: Ratios of the average multiplicities and scalar pT sums for primary V0 in the
trans-verse region to the same quantities for primary charged particles [1] as a function of charged-particle jet pT. The error bars indicate the quadratic sum of the statistical and systematic
15
The Λ to charged-particle activity ratios exhibit a rise for charged-particle jet pT < 10 GeV/c,
followed by a plateau. A similar dependence is visible in PYTHIA. Simulations indicate that the rise is related to the observed hardening of the baryon pTspectrum as the charged-particle
jet pT increases, combined with the 1.5 GeV/c pT cut applied to the baryon sample. When the
baryon pTcut is decreased to 0.5 GeV/c as for charged particles, constant ratios are predicted.
Constant strange- to charged-particle activity ratios have thus been measured for K0Smesons for charged-particle jet pT >3 GeV/c and forΛ baryons for charged-particle jet pT >10 GeV/c. In
addition, as just discussed, when accounting for the acceptance of the baryon pTcut, a constant
ratio is also predicted forΛ baryons at charged-particle jet pT < 10 GeV/c. Since the trends
observed are very similar for charged and strange particles, as well as for mesons and baryons, the present measurements suggest that hadronization and MPI are decoupled.
5
Conclusions
This paper describes measurements of the underlying event activity in pp collisions at√s = 7 TeV, probed through the production of primary K0Smesons and Λ baryons. The production of K0
S mesons and Λ baryons in the kinematic range p
K0 S
T > 0.6 GeV/c, pΛT > 1.5 GeV/c and |η| < 2 is analysed in the transverse region, defined as 60◦ < |∆φ| < 120◦, with ∆φ the
difference in azimuthal angle between the leading charged-particle jet and the strange particle directions. The average multiplicity and the average scalar pT sum of primary particles per
event are studied as a function of the leading charged-particle jet pT.
A steep rise of the underlying event activity is seen with increasing leading jet pT, followed by
a “saturation” region for jet pT >10 GeV/c. This trend and the pTscale above which saturation
occurs are very similar to those observed with charged primary particles. The similarity of the behaviour for strange and charged particles is consistent with the impact-parameter picture of multiple parton interactions in pp collisions, in which the centrality of the pp collision and the MPI activity are correlated.
The results are compared to recent tunes of the PYTHIA Monte Carlo event generator. The
PYTHIAsimulations underestimate the data by 15–30% for K0Smesons and by about 50% forΛ
baryons, a MC deficit similar to that observed for the inclusive strange particle production in pp collisions.
The constant strange- to charged-particle activity ratios and the similar trends for mesons and baryons indicate that the MPI dynamics is decoupled from parton hadronization, with the latter occurring at a later stage.
Acknowledgments
We congratulate our colleagues in the CERN accelerator departments for the excellent perfor-mance of the LHC and thank the technical and administrative staffs at CERN and at other CMS institutes for their contributions to the success of the CMS effort. In addition, we gratefully acknowledge the computing centres and personnel of the Worldwide LHC Computing Grid for delivering so effectively the computing infrastructure essential to our analyses. Finally, we acknowledge the enduring support for the construction and operation of the LHC and the CMS detector provided by the following funding agencies: the Austrian Federal Ministry of Science and Research and the Austrian Science Fund; the Belgian Fonds de la Recherche Scien-tifique, and Fonds voor Wetenschappelijk Onderzoek; the Brazilian Funding Agencies (CNPq,
16 References
CAPES, FAPERJ, and FAPESP); the Bulgarian Ministry of Education, Youth and Science; CERN; the Chinese Academy of Sciences, Ministry of Science and Technology, and National Natural Science Foundation of China; the Colombian Funding Agency (COLCIENCIAS); the Croatian Ministry of Science, Education and Sport; the Research Promotion Foundation, Cyprus; the Ministry of Education and Research, Recurrent financing contract SF0690030s09 and European Regional Development Fund, Estonia; the Academy of Finland, Finnish Ministry of Education and Culture, and Helsinki Institute of Physics; the Institut National de Physique Nucl´eaire et de Physique des Particules / CNRS, and Commissariat `a l’ ´Energie Atomique et aux ´Energies Alternatives / CEA, France; the Bundesministerium f ¨ur Bildung und Forschung, Deutsche Forschungsgemeinschaft, and Helmholtz-Gemeinschaft Deutscher Forschungszentren, Germany; the General Secretariat for Research and Technology, Greece; the National Scientific Research Foundation, and National Office for Research and Technology, Hungary; the Department of Atomic Energy and the Department of Science and Technology, India; the Institute for Stud-ies in Theoretical Physics and Mathematics, Iran; the Science Foundation, Ireland; the Istituto Nazionale di Fisica Nucleare, Italy; the Korean Ministry of Education, Science and Technology and the World Class University program of NRF, Republic of Korea; the Lithuanian Academy of Sciences; the Mexican Funding Agencies (CINVESTAV, CONACYT, SEP, and UASLP-FAI); the Ministry of Science and Innovation, New Zealand; the Pakistan Atomic Energy Commission; the Ministry of Science and Higher Education and the National Science Centre, Poland; the Fundac¸˜ao para a Ciˆencia e a Tecnologia, Portugal; JINR (Armenia, Belarus, Georgia, Ukraine, Uzbekistan); the Ministry of Education and Science of the Russian Federation, the Federal Agency of Atomic Energy of the Russian Federation, Russian Academy of Sciences, and the Russian Foundation for Basic Research; the Ministry of Science and Technological Develop-ment of Serbia; the Secretar´ıa de Estado de Investigaci ´on, Desarrollo e Innovaci ´on and Pro-grama Consolider-Ingenio 2010, Spain; the Swiss Funding Agencies (ETH Board, ETH Zurich, PSI, SNF, UniZH, Canton Zurich, and SER); the National Science Council, Taipei; the Thai-land Center of Excellence in Physics, the Institute for the Promotion of Teaching Science and Technology of Thailand and the National Science and Technology Development Agency of Thailand; the Scientific and Technical Research Council of Turkey, and Turkish Atomic Energy Authority; the Science and Technology Facilities Council, UK; the US Department of Energy, and the US National Science Foundation.
Individuals have received support from the Marie-Curie programme and the European Re-search Council and EPLANET (European Union); the Leventis Foundation; the A. P. Sloan Foundation; the Alexander von Humboldt Foundation; the Belgian Federal Science Policy Of-fice; the Fonds pour la Formation `a la Recherche dans l’Industrie et dans l’Agriculture (FRIA-Belgium); the Agentschap voor Innovatie door Wetenschap en Technologie (IWT-(FRIA-Belgium); the Ministry of Education, Youth and Sports (MEYS) of Czech Republic; the Council of Science and Industrial Research, India; the Compagnia di San Paolo (Torino); the HOMING PLUS pro-gramme of Foundation for Polish Science, cofinanced by EU, Regional Development Fund; and the Thalis and Aristeia programmes cofinanced by EU-ESF and the Greek NSRF.
References
[1] CMS Collaboration, “Measurement of the underlying event activity at the LHC with√s = 7 TeV and comparison with√s = 0.9 TeV”, JHEP 09 (2011) 109,
doi:10.1007/JHEP09(2011)109, arXiv:1107.0330.
[2] R. Field, “Studying the underlying event at CDF and the LHC”, in Proceedings of the First International Workshop on Multiple Partonic Interactions at the LHC MPI’08, October 27-31,
References 17
2008, P. Bartalini and L. Fan ´o, eds. Perugia, Italy, October, 2009. arXiv:1003.4220. [3] ATLAS Collaboration, “Measurement of underlying event characteristics using charged
particles in pp collisions at√s=900 GeV and 7 TeV with the ATLAS detector”, Phys. Rev. D 83 (2011) 112001, doi:10.1103/PhysRevD.83.112001, arXiv:1012.0791. [4] CMS Collaboration, “First measurement of the underlying event activity at the LHC with√
s = 0.9 TeV”, Eur. Phys. J. C 70 (2010) 555,
doi:10.1140/epjc/s10052-010-1453-9, arXiv:1006.2083.
[5] CMS Collaboration, “Measurement of the underlying event activity in the Drell–Yan process in proton-proton collisions at√s = 7 TeV”, Eur. Phys. J. C 72 (2012) 2080, doi:10.1140/epjc/s10052-012-2080-4, arXiv:1204.1411.
[6] T. Sj ¨ostrand and M. van Zijl, “Multiple parton-parton interactions in an impact parameter picture”, Phys. Lett. B 188 (1987) 149, doi:10.1016/0370-2693(87)90722-2.
[7] L. Frankfurt, M. Strikman, and C. Weiss, “Transverse nucleon structure and diagnostics of hard parton-parton processes at LHC”, Phys. Rev. D 83 (2011) 054012,
doi:10.1103/PhysRevD.83.054012, arXiv:1009.2559.
[8] ALICE Collaboration, “Multi-strange baryon production in pp collisions at√s = 7 TeV with ALICE”, Phys. Lett. B 712 (2012) 309,
doi:10.1016/j.physletb.2012.05.011, arXiv:1204.0282.
[9] ALICE Collaboration, “Strange and Multi-Strange Particle Production in ALICE”, (2012).
arXiv:1211.7298.
[10] ATLAS Collaboration, “K0
SandΛ production in pp interactions at √
s = 0.9 and 7 TeV measured with the ATLAS detector at the LHC”, Phys. Rev. D 85 (2012) 012001,
doi:10.1103/PhysRevD.85.012001, arXiv:1111.1297.
[11] CMS Collaboration, “Strange particle production in pp collisions at√s = 0.9 and 7 TeV”, JHEP 05 (2011) 064, doi:10.1007/JHEP05(2011)064, arXiv:1102.4282.
[12] T. Sj ¨ostrand, S. Mrenna, and P. Z. Skands, “PYTHIA6.4 Physics and Manual”, JHEP 05 (2006) 026, doi:10.1088/1126-6708/2006/05/026, arXiv:hep-ph/0603175. [13] T. Sj ¨ostrand, S. Mrenna, and P. Z. Skands, “A brief introduction to PYTHIA 8.1”, Comput.
Phys. Commun. 178 (2008) 852, doi:10.1016/j.cpc.2008.01.036,
arXiv:0710.3820.
[14] R. Field, “Physics at the Tevatron”, Acta Phys. Polon. B 39 (2008) 2611.
[15] A. Buckley et al., “Systematic event generator tuning for the LHC”, Eur. Phys. J. C 65 (2010) 331, doi:10.1140/epjc/s10052-009-1196-7, arXiv:0907.2973. [16] H.-J. Drescher, J. Aichelin, and K. Werner, “Strangeness suppression in proton-proton
collisions”, Phys. Rev. D 65 (2002) 057501, doi:10.1103/PhysRevD.65.057501,
arXiv:hep-ph/0105020.
[17] N. Armesto et al., “Heavy-ion collisions at the LHC—Last call for predictions”, J. Phys. G
35(2008) 054001, doi:10.1088/0954-3899/35/5/054001, arXiv:0711.0974.
[18] CMS Collaboration, “The CMS experiment at the CERN LHC”, JINST 3 (2008) S08004,
18 References
[19] W. Waltenberger, R. Fr ¨uhwirth, and P. Vanlaer, “Adaptive vertex fitting”, J. Phys. G 34 (2007) N343, doi:10.1088/0954-3899/34/12/N01.
[20] M. Cacciari and G. P. Salam, “Dispelling the N3myth for the ktjet-finder”, Phys. Lett. B
641(2006) 57, doi:10.1016/j.physletb.2006.08.037,
arXiv:hep-ph/0512210.
[21] M. Cacciari, G. P. Salam, and G. Soyez, “The anti-ktjet clustering algorithm”, JHEP 04
(2008) 063, doi:10.1088/1126-6708/2008/04/063, arXiv:0802.1189. [22] GEANT4 Collaboration, “GEANT4—a simulation toolkit”, Nucl. Instrum. Meth. A 506
(2003) 250, doi:10.1016/S0168-9002(03)01368-8.
[23] CMS Collaboration, “Tracking and Primary Vertex Results in First 7 TeV Collisions”, CMS Physics Analysis Summary CMS-PAS-TRK-10-005, (2010).
[24] CMS Collaboration, “Measurement of Tracking Efficiency”, CMS Physics Analysis Summary CMS-PAS-TRK-10-002, (2010).
[25] CMS Collaboration, “CMS tracking performance results from early LHC operation”, Eur. Phys. J. C 70 (2010) 1165, doi:10.1140/epjc/s10052-010-1491-3,
arXiv:1007.1988.
[26] R. Field, “Early LHC Underlying Event Data - Findings and Surprises”, (2010). arXiv:1010.3558.
[27] R. Corke and T. Sj ¨ostrand, “Interleaved Parton Showers and Tuning Prospects”, JHEP 03 (2011) 032, doi:10.1007/JHEP03(2011)032, arXiv:1011.1759.
[28] J. Pumplin et al., “New generation of parton distributions with uncertainties from global QCD analysis”, JHEP 07 (2002) 012, doi:10.1088/1126-6708/2002/07/012,
arXiv:hep-ph/0201195.
[29] Particle Data Group, J. Beringer et al., “Review of particle physics”, Phys. Rev. D 86 (2012) 010001, doi:10.1103/PhysRevD.86.010001.
[30] ALICE Collaboration, “Midrapidity antiproton-to-proton ratio in pp collisions at√ s =0.9 and 7 TeV measured by the ALICE experiment”, Phys. Rev. Lett. 105 (2010) 072002, doi:10.1103/PhysRevLett.105.072002, arXiv:1006.5432.
[31] E. Migliore and G. Sguazzoni, “Altered scenarios of the CMS Tracker material for systematic uncertainties studies”, CMS NOTE CMS-NOTE-2010-010, (2010).
19
A
The CMS Collaboration
Yerevan Physics Institute, Yerevan, Armenia
S. Chatrchyan, V. Khachatryan, A.M. Sirunyan, A. Tumasyan
Institut f ¨ur Hochenergiephysik der OeAW, Wien, Austria
W. Adam, T. Bergauer, M. Dragicevic, J. Er ¨o, C. Fabjan1, M. Friedl, R. Fr ¨uhwirth1, V.M. Ghete, N. H ¨ormann, J. Hrubec, M. Jeitler1, W. Kiesenhofer, V. Kn ¨unz, M. Krammer1, I. Kr¨atschmer, D. Liko, I. Mikulec, D. Rabady2, B. Rahbaran, C. Rohringer, H. Rohringer, R. Sch ¨ofbeck,
J. Strauss, A. Taurok, W. Treberer-Treberspurg, W. Waltenberger, C.-E. Wulz1
National Centre for Particle and High Energy Physics, Minsk, Belarus
V. Mossolov, N. Shumeiko, J. Suarez Gonzalez
Universiteit Antwerpen, Antwerpen, Belgium
S. Alderweireldt, M. Bansal, S. Bansal, T. Cornelis, E.A. De Wolf, X. Janssen, A. Knutsson, S. Luyckx, L. Mucibello, S. Ochesanu, B. Roland, R. Rougny, H. Van Haevermaet, P. Van Mechelen, N. Van Remortel, A. Van Spilbeeck
Vrije Universiteit Brussel, Brussel, Belgium
F. Blekman, S. Blyweert, J. D’Hondt, A. Kalogeropoulos, J. Keaveney, M. Maes, A. Olbrechts, S. Tavernier, W. Van Doninck, P. Van Mulders, G.P. Van Onsem, I. Villella
Universit´e Libre de Bruxelles, Bruxelles, Belgium
B. Clerbaux, G. De Lentdecker, L. Favart, A.P.R. Gay, T. Hreus, A. L´eonard, P.E. Marage, A. Mohammadi, L. Perni`e, T. Reis, T. Seva, L. Thomas, C. Vander Velde, P. Vanlaer, J. Wang
Ghent University, Ghent, Belgium
V. Adler, K. Beernaert, L. Benucci, A. Cimmino, S. Costantini, S. Dildick, G. Garcia, B. Klein, J. Lellouch, A. Marinov, J. Mccartin, A.A. Ocampo Rios, D. Ryckbosch, M. Sigamani, N. Strobbe, F. Thyssen, M. Tytgat, S. Walsh, E. Yazgan, N. Zaganidis
Universit´e Catholique de Louvain, Louvain-la-Neuve, Belgium
S. Basegmez, C. Beluffi3, G. Bruno, R. Castello, A. Caudron, L. Ceard, C. Delaere, T. du Pree, D. Favart, L. Forthomme, A. Giammanco4, J. Hollar, V. Lemaitre, J. Liao, O. Militaru, C. Nuttens, D. Pagano, A. Pin, K. Piotrzkowski, A. Popov5, M. Selvaggi, J.M. Vizan Garcia
Universit´e de Mons, Mons, Belgium
N. Beliy, T. Caebergs, E. Daubie, G.H. Hammad
Centro Brasileiro de Pesquisas Fisicas, Rio de Janeiro, Brazil
G.A. Alves, M. Correa Martins Junior, T. Martins, M.E. Pol, M.H.G. Souza
Universidade do Estado do Rio de Janeiro, Rio de Janeiro, Brazil
W.L. Ald´a J ´unior, W. Carvalho, J. Chinellato6, A. Cust ´odio, E.M. Da Costa, D. De Jesus Damiao, C. De Oliveira Martins, S. Fonseca De Souza, H. Malbouisson, M. Malek, D. Matos Figueiredo, L. Mundim, H. Nogima, W.L. Prado Da Silva, A. Santoro, L. Soares Jorge, A. Sznajder, E.J. Tonelli Manganote6, A. Vilela Pereira
Universidade Estadual Paulistaa, Universidade Federal do ABCb, S˜ao Paulo, Brazil
T.S. Anjosb, C.A. Bernardesb, F.A. Diasa,7, T.R. Fernandez Perez Tomeia, E.M. Gregoresb, C. Laganaa, F. Marinhoa, P.G. Mercadanteb, S.F. Novaesa, Sandra S. Padulaa
Institute for Nuclear Research and Nuclear Energy, Sofia, Bulgaria
20 A The CMS Collaboration
University of Sofia, Sofia, Bulgaria
A. Dimitrov, R. Hadjiiska, V. Kozhuharov, L. Litov, B. Pavlov, P. Petkov
Institute of High Energy Physics, Beijing, China
J.G. Bian, G.M. Chen, H.S. Chen, C.H. Jiang, D. Liang, S. Liang, X. Meng, J. Tao, J. Wang, X. Wang, Z. Wang, H. Xiao, M. Xu
State Key Laboratory of Nuclear Physics and Technology, Peking University, Beijing, China
C. Asawatangtrakuldee, Y. Ban, Y. Guo, Q. Li, W. Li, S. Liu, Y. Mao, S.J. Qian, D. Wang, L. Zhang, W. Zou
Universidad de Los Andes, Bogota, Colombia
C. Avila, C.A. Carrillo Montoya, J.P. Gomez, B. Gomez Moreno, J.C. Sanabria
Technical University of Split, Split, Croatia
N. Godinovic, D. Lelas, R. Plestina8, D. Polic, I. Puljak
University of Split, Split, Croatia
Z. Antunovic, M. Kovac
Institute Rudjer Boskovic, Zagreb, Croatia
V. Brigljevic, S. Duric, K. Kadija, J. Luetic, D. Mekterovic, S. Morovic, L. Tikvica
University of Cyprus, Nicosia, Cyprus
A. Attikis, G. Mavromanolakis, J. Mousa, C. Nicolaou, F. Ptochos, P.A. Razis
Charles University, Prague, Czech Republic
M. Finger, M. Finger Jr.
Academy of Scientific Research and Technology of the Arab Republic of Egypt, Egyptian Network of High Energy Physics, Cairo, Egypt
Y. Assran9, A. Ellithi Kamel10, M.A. Mahmoud11, A. Mahrous12, A. Radi13,14
National Institute of Chemical Physics and Biophysics, Tallinn, Estonia
M. Kadastik, M. M ¨untel, M. Murumaa, M. Raidal, L. Rebane, A. Tiko
Department of Physics, University of Helsinki, Helsinki, Finland
P. Eerola, G. Fedi, M. Voutilainen
Helsinki Institute of Physics, Helsinki, Finland
J. H¨ark ¨onen, V. Karim¨aki, R. Kinnunen, M.J. Kortelainen, T. Lamp´en, K. Lassila-Perini, S. Lehti, T. Lind´en, P. Luukka, T. M¨aenp¨a¨a, T. Peltola, E. Tuominen, J. Tuominiemi, E. Tuovinen, L. Wendland
Lappeenranta University of Technology, Lappeenranta, Finland
A. Korpela, T. Tuuva
DSM/IRFU, CEA/Saclay, Gif-sur-Yvette, France
M. Besancon, S. Choudhury, F. Couderc, M. Dejardin, D. Denegri, B. Fabbro, J.L. Faure, F. Ferri, S. Ganjour, A. Givernaud, P. Gras, G. Hamel de Monchenault, P. Jarry, E. Locci, J. Malcles, L. Millischer, A. Nayak, J. Rander, A. Rosowsky, M. Titov
Laboratoire Leprince-Ringuet, Ecole Polytechnique, IN2P3-CNRS, Palaiseau, France
S. Baffioni, F. Beaudette, L. Benhabib, L. Bianchini, M. Bluj15, P. Busson, C. Charlot, N. Daci, T. Dahms, M. Dalchenko, L. Dobrzynski, A. Florent, R. Granier de Cassagnac, M. Haguenauer, P. Min´e, C. Mironov, I.N. Naranjo, M. Nguyen, C. Ochando, P. Paganini, D. Sabes, R. Salerno, Y. Sirois, C. Veelken, A. Zabi
21
Institut Pluridisciplinaire Hubert Curien, Universit´e de Strasbourg, Universit´e de Haute Alsace Mulhouse, CNRS/IN2P3, Strasbourg, France
J.-L. Agram16, J. Andrea, D. Bloch, D. Bodin, J.-M. Brom, E.C. Chabert, C. Collard, E. Conte16, F. Drouhin16, J.-C. Fontaine16, D. Gel´e, U. Goerlach, C. Goetzmann, P. Juillot, A.-C. Le Bihan,
P. Van Hove
Centre de Calcul de l’Institut National de Physique Nucleaire et de Physique des Particules, CNRS/IN2P3, Villeurbanne, France
S. Gadrat
Universit´e de Lyon, Universit´e Claude Bernard Lyon 1, CNRS-IN2P3, Institut de Physique Nucl´eaire de Lyon, Villeurbanne, France
S. Beauceron, N. Beaupere, G. Boudoul, S. Brochet, J. Chasserat, R. Chierici, D. Contardo, P. Depasse, H. El Mamouni, J. Fay, S. Gascon, M. Gouzevitch, B. Ille, T. Kurca, M. Lethuillier, L. Mirabito, S. Perries, L. Sgandurra, V. Sordini, Y. Tschudi, M. Vander Donckt, P. Verdier, S. Viret
Institute of High Energy Physics and Informatization, Tbilisi State University, Tbilisi, Georgia
Z. Tsamalaidze17
RWTH Aachen University, I. Physikalisches Institut, Aachen, Germany
C. Autermann, S. Beranek, B. Calpas, M. Edelhoff, L. Feld, N. Heracleous, O. Hindrichs, K. Klein, J. Merz, A. Ostapchuk, A. Perieanu, F. Raupach, J. Sammet, S. Schael, D. Sprenger, H. Weber, B. Wittmer, V. Zhukov5
RWTH Aachen University, III. Physikalisches Institut A, Aachen, Germany
M. Ata, J. Caudron, E. Dietz-Laursonn, D. Duchardt, M. Erdmann, R. Fischer, A. G ¨uth, T. Hebbeker, C. Heidemann, K. Hoepfner, D. Klingebiel, P. Kreuzer, M. Merschmeyer, A. Meyer, M. Olschewski, K. Padeken, P. Papacz, H. Pieta, H. Reithler, S.A. Schmitz, L. Sonnenschein, J. Steggemann, D. Teyssier, S. Th ¨uer, M. Weber
RWTH Aachen University, III. Physikalisches Institut B, Aachen, Germany
V. Cherepanov, Y. Erdogan, G. Fl ¨ugge, H. Geenen, M. Geisler, W. Haj Ahmad, F. Hoehle, B. Kargoll, T. Kress, Y. Kuessel, J. Lingemann2, A. Nowack, I.M. Nugent, L. Perchalla, O. Pooth,
A. Stahl
Deutsches Elektronen-Synchrotron, Hamburg, Germany
M. Aldaya Martin, I. Asin, N. Bartosik, J. Behr, W. Behrenhoff, U. Behrens, M. Bergholz18, A. Bethani, K. Borras, A. Burgmeier, A. Cakir, L. Calligaris, A. Campbell, F. Costanza, C. Diez Pardos, T. Dorland, G. Eckerlin, D. Eckstein, G. Flucke, A. Geiser, I. Glushkov, P. Gunnellini, S. Habib, J. Hauk, G. Hellwig, H. Jung, M. Kasemann, P. Katsas, C. Kleinwort, H. Kluge, M. Kr¨amer, D. Kr ¨ucker, E. Kuznetsova, W. Lange, J. Leonard, K. Lipka, W. Lohmann18,
B. Lutz, R. Mankel, I. Marfin, I.-A. Melzer-Pellmann, A.B. Meyer, J. Mnich, A. Mussgiller, S. Naumann-Emme, O. Novgorodova, F. Nowak, J. Olzem, H. Perrey, A. Petrukhin, D. Pitzl, R. Placakyte, A. Raspereza, P.M. Ribeiro Cipriano, C. Riedl, E. Ron, M. ¨O. Sahin, J. Salfeld-Nebgen, R. Schmidt18, T. Schoerner-Sadenius, N. Sen, M. Stein, R. Walsh, C. Wissing
University of Hamburg, Hamburg, Germany
V. Blobel, H. Enderle, J. Erfle, U. Gebbert, M. G ¨orner, M. Gosselink, J. Haller, K. Heine, R.S. H ¨oing, G. Kaussen, H. Kirschenmann, R. Klanner, R. Kogler, J. Lange, I. Marchesini, T. Peiffer, N. Pietsch, D. Rathjens, C. Sander, H. Schettler, P. Schleper, E. Schlieckau, A. Schmidt,
22 A The CMS Collaboration
M. Schr ¨oder, T. Schum, M. Seidel, J. Sibille19, V. Sola, H. Stadie, G. Steinbr ¨uck, J. Thomsen, D. Troendle, L. Vanelderen
Institut f ¨ur Experimentelle Kernphysik, Karlsruhe, Germany
C. Barth, C. Baus, J. Berger, C. B ¨oser, T. Chwalek, W. De Boer, A. Descroix, A. Dierlamm, M. Feindt, M. Guthoff2, C. Hackstein, F. Hartmann2, T. Hauth2, M. Heinrich, H. Held, K.H. Hoffmann, U. Husemann, I. Katkov5, J.R. Komaragiri, A. Kornmayer2, P. Lobelle Pardo, D. Martschei, S. Mueller, Th. M ¨uller, M. Niegel, A. N ¨urnberg, O. Oberst, J. Ott, G. Quast, K. Rabbertz, F. Ratnikov, S. R ¨ocker, F.-P. Schilling, G. Schott, H.J. Simonis, F.M. Stober, R. Ulrich, J. Wagner-Kuhr, S. Wayand, T. Weiler, M. Zeise
Institute of Nuclear and Particle Physics (INPP), NCSR Demokritos, Aghia Paraskevi, Greece
G. Anagnostou, G. Daskalakis, T. Geralis, S. Kesisoglou, A. Kyriakis, D. Loukas, A. Markou, C. Markou, E. Ntomari
University of Athens, Athens, Greece
L. Gouskos, T.J. Mertzimekis, A. Panagiotou, N. Saoulidou, E. Stiliaris
University of Io´annina, Io´annina, Greece
X. Aslanoglou, I. Evangelou, G. Flouris, C. Foudas, P. Kokkas, N. Manthos, I. Papadopoulos, E. Paradas
KFKI Research Institute for Particle and Nuclear Physics, Budapest, Hungary
G. Bencze, C. Hajdu, P. Hidas, D. Horvath20, B. Radics, F. Sikler, V. Veszpremi,
G. Vesztergombi21, A.J. Zsigmond
Institute of Nuclear Research ATOMKI, Debrecen, Hungary
N. Beni, S. Czellar, J. Molnar, J. Palinkas, Z. Szillasi
University of Debrecen, Debrecen, Hungary
J. Karancsi, P. Raics, Z.L. Trocsanyi, B. Ujvari
Panjab University, Chandigarh, India
S.B. Beri, V. Bhatnagar, N. Dhingra, R. Gupta, M. Kaur, M.Z. Mehta, M. Mittal, N. Nishu, L.K. Saini, A. Sharma, J.B. Singh
University of Delhi, Delhi, India
Ashok Kumar, Arun Kumar, S. Ahuja, A. Bhardwaj, B.C. Choudhary, S. Malhotra, M. Naimuddin, K. Ranjan, P. Saxena, V. Sharma, R.K. Shivpuri
Saha Institute of Nuclear Physics, Kolkata, India
S. Banerjee, S. Bhattacharya, K. Chatterjee, S. Dutta, B. Gomber, Sa. Jain, Sh. Jain, R. Khurana, A. Modak, S. Mukherjee, D. Roy, S. Sarkar, M. Sharan
Bhabha Atomic Research Centre, Mumbai, India
A. Abdulsalam, D. Dutta, S. Kailas, V. Kumar, A.K. Mohanty2, L.M. Pant, P. Shukla, A. Topkar
Tata Institute of Fundamental Research - EHEP, Mumbai, India
T. Aziz, R.M. Chatterjee, S. Ganguly, S. Ghosh, M. Guchait22, A. Gurtu23, G. Kole,
S. Kumar, M. Maity24, G. Majumder, K. Mazumdar, G.B. Mohanty, B. Parida, K. Sudhakar, N. Wickramage25
Tata Institute of Fundamental Research - HECR, Mumbai, India
23
Institute for Research in Fundamental Sciences (IPM), Tehran, Iran
H. Arfaei26, H. Bakhshiansohi, S.M. Etesami27, A. Fahim26, H. Hesari, A. Jafari, M. Khakzad, M. Mohammadi Najafabadi, S. Paktinat Mehdiabadi, B. Safarzadeh28, M. Zeinali
University College Dublin, Dublin, Ireland
M. Grunewald
INFN Sezione di Baria, Universit`a di Barib, Politecnico di Baric, Bari, Italy
M. Abbresciaa,b, L. Barbonea,b, C. Calabriaa,b, S.S. Chhibraa,b, A. Colaleoa, D. Creanzaa,c, N. De Filippisa,c,2, M. De Palmaa,b, L. Fiorea, G. Iasellia,c, G. Maggia,c, M. Maggia, B. Marangellia,b, S. Mya,c, S. Nuzzoa,b, N. Pacificoa, A. Pompilia,b, G. Pugliesea,c, G. Selvaggia,b, L. Silvestrisa, G. Singha,b, R. Vendittia,b, P. Verwilligena, G. Zitoa
INFN Sezione di Bolognaa, Universit`a di Bolognab, Bologna, Italy
G. Abbiendia, A.C. Benvenutia, D. Bonacorsia,b, S. Braibant-Giacomellia,b, L. Brigliadoria,b, R. Campaninia,b, P. Capiluppia,b, A. Castroa,b, F.R. Cavalloa, M. Cuffiania,b, G.M. Dallavallea, F. Fabbria, A. Fanfania,b, D. Fasanellaa,b, P. Giacomellia, C. Grandia, L. Guiduccia,b, S. Marcellinia, G. Masettia,2, M. Meneghellia,b, A. Montanaria, F.L. Navarriaa,b, F. Odoricia, A. Perrottaa, F. Primaveraa,b, A.M. Rossia,b, T. Rovellia,b, G.P. Sirolia,b, N. Tosia,b, R. Travaglinia,b
INFN Sezione di Cataniaa, Universit`a di Cataniab, Catania, Italy
S. Albergoa,b, M. Chiorbolia,b, S. Costaa,b, F. Giordanoa,2, R. Potenzaa,b, A. Tricomia,b, C. Tuvea,b
INFN Sezione di Firenzea, Universit`a di Firenzeb, Firenze, Italy
G. Barbaglia, V. Ciullia,b, C. Civininia, R. D’Alessandroa,b, E. Focardia,b, S. Frosalia,b, E. Galloa, S. Gonzia,b, V. Goria,b, P. Lenzia,b, M. Meschinia, S. Paolettia, G. Sguazzonia, A. Tropianoa,b
INFN Laboratori Nazionali di Frascati, Frascati, Italy
L. Benussi, S. Bianco, F. Fabbri, D. Piccolo
INFN Sezione di Genovaa, Universit`a di Genovab, Genova, Italy
P. Fabbricatorea, R. Musenicha, S. Tosia,b
INFN Sezione di Milano-Bicoccaa, Universit`a di Milano-Bicoccab, Milano, Italy
A. Benagliaa, F. De Guioa,b, L. Di Matteoa,b, S. Fiorendia,b, S. Gennaia, A. Ghezzia,b, P. Govoni,
M.T. Lucchini2, S. Malvezzia, R.A. Manzonia,b,2, A. Martellia,b,2, A. Massironia,b, D. Menascea, L. Moronia, M. Paganonia,b, D. Pedrinia, S. Ragazzia,b, N. Redaellia, T. Tabarelli de Fatisa,b
INFN Sezione di Napoli a, Universit`a di Napoli ’Federico II’ b, Universit`a della
Basilicata (Potenza)c, Universit`a G. Marconi (Roma)d, Napoli, Italy
S. Buontempoa, N. Cavalloa,c, A. De Cosaa,b, F. Fabozzia,c, A.O.M. Iorioa,b, L. Listaa, S. Meolaa,d,2, M. Merolaa, P. Paoluccia,2
INFN Sezione di Padovaa, Universit`a di Padovab, Universit`a di Trento (Trento)c, Padova,
Italy
P. Azzia, N. Bacchettaa, D. Biselloa,b, A. Brancaa,b, R. Carlina,b, P. Checchiaa, T. Dorigoa, U. Dossellia, M. Galantia,b,2, F. Gasparinia,b, U. Gasparinia,b, P. Giubilatoa,b, A. Gozzelinoa, K. Kanishcheva,c, S. Lacapraraa, I. Lazzizzeraa,c, M. Margonia,b, A.T. Meneguzzoa,b, M. Passaseoa, J. Pazzinia,b, M. Pegoraroa, N. Pozzobona,b, P. Ronchesea,b, F. Simonettoa,b, E. Torassaa, M. Tosia,b, S. Venturaa, P. Zottoa,b, A. Zucchettaa,b, G. Zumerlea,b
INFN Sezione di Paviaa, Universit`a di Paviab, Pavia, Italy
![Figure 7: Ratios of the average multiplicities and scalar p T sums for primary V 0 in the trans- trans-verse region to the same quantities for primary charged particles [1] as a function of charged-particle jet p T](https://thumb-eu.123doks.com/thumbv2/123dok_br/15728148.1071205/16.892.143.761.311.879/figure-ratios-average-multiplicities-quantities-particles-function-particle.webp)
