*Corresponding author: Hernâni Gonçalves, Center for Health Technology and Services Research (CINTESIS), Faculty of Medicine, University of Porto, Portugal, E-mail: [email protected] Mariana Morais: Department of Obstetrics and Gynecology, Medical School, University of Porto, Portugal
Paula Pinto: Center for Health Technology and Services Research (CINTESIS), Faculty of Medicine, University of Porto, Portugal; Department of Obstetrics and Gynecology, Medical School, University of Porto, Portugal; and Hospital Dr Nélio Mendonça, EPE, Funchal
Diogo Ayres-de-Campos: Department of Obstetrics and Gynecology, Medical School, University of Porto, Portugal; Department of Obstetrics and Gynecology, São João Hospital, Portugal; and INEB – Institute of Biomedical Engineering and I3S – Institute for Research and Innovation in Health, University of Porto, Porto, Portugal João Bernardes: Center for Health Technology and Services Research (CINTESIS), Faculty of Medicine, University of Porto, Portugal; Department of Obstetrics and Gynecology, Medical School, University of Porto, Portugal; Department of Obstetrics and Gynecology, São João Hospital, Portugal; and Hospital Pedro Hispano, Unidade Local de Saúde de Matosinhos
Hernâni Gonçalves*, Mariana Morais, Paula Pinto, Diogo Ayres-de-Campos and João Bernardes
Linear and non-linear analysis of uterine
contraction signals obtained with
tocodynamometry in prediction of operative
vaginal delivery
DOI 10.1515/jpm-2016-0036
Received January 29, 2016. Accepted July 25, 2016.
Abstract
Objective: The aim of this study was to explore whether
linear and non-linear analysis of uterine contraction (UC)
signals obtained with external tocodynamometry can
predict operative vaginal delivery (OVD).
Materials and methods: The last 2 h before delivery
(H
1and H
2) of 55 UC recordings acquired with external
tocodynamometry in the labour ward of a tertiary care
hospital were analysed. Signal processing involved the
quantification of UCs/segment (UC
N), and the linear and
non-linear indices: Sample Entropy (SampEn) measuring
signal irregularity; interval index (II) measuring signal
variability, both of which may be associated with uterine
muscle fatigue, and high frequency (HF), associated with
maternal breathing movements. Thirty-two women had
normal deliveries and 23 OVDs. Statistical inference was
performed using 95% confidence intervals (95% CIs) for
the median, and areas under the receiver operating curves
(auROCs), with univariate and bivariate analyses.
Results: A significant association was found between
maternal body mass index (BMI) and UC signal quality
in H
1, with moderate/poor signal quality being more
fre-quent with higher maternal BMI. There was an overall
increase in contraction frequency (UC
N), signal regularity
(SampEn), signal variability (II), and maternal
breath-ing (HF) from H
1to H
2. The OVD group exhibited
signifi-cantly higher values of signal irregularity and variability
(SampEn and II) in H
1, and higher contraction frequency
(UC
N) and maternal breathing (HF) in H
2. Modest auROCs
were obtained with these indices in the discrimination
between normal and OVDs.
Conclusions: The results of this exploratory study
sug-gest that analysis of UC signals obtained with
tocodyna-mometry, using linear and non-linear indices associated
with muscle fatigue and maternal breathing, identifies
significant changes occurring during labour, and
differ-ences between normal and OVDs, but their discriminative
capacity between the two types of delivery is modest.
Fur-ther refinement of this analysis is needed before it may be
clinically useful.
Keywords: Cardiotocography; digital signal
process-ing; entropy; operative vaginal delivery (OVD); spectral
analysis.
Introduction
Dystocia is defined as the slow or absent progression of
labour, and is the most common indication for operative
vaginal deliveries (OVDs) and caesarean section [1]. It is
usually caused by abnormal patterns of uterine
contrac-tions (UCs) [2], and/or by mechanical obstruction to foetal
progress due to the size of the foetus and maternal pelvis,
the capacity of the cervix to dilate, or foetal presentation
or position [2, 3]. Most situations of dystocia occur during
the active phase of labour, which is generally defined as
the period between 4 and 6 cm of cervical dilation to
com-plete dilation. In normal labour, UCs during this phase
occurs with increasing frequency, rhythm and strength [4,
5]. Monitoring of uterine activity is particularly important,
as abnormal UC patterns are a major cause, as well as a
consequence, of dystocia [4].
Several methods are available to monitor UCs:
toco-dynamometry using a mechanical sensor placed on the
maternal abdomen, transabdominal electromyography
evaluated by electrical sensors also placed on the
mater-nal abdomen, or intrauterine pressure devices. The first is
the most frequently used in routine clinical practice, due
to its easy availability and non-invasive nature. However,
it is associated with lower signal quality, particularly in
obese patients [6, 7]. Electromyography is a recent
tech-nique that is not widely available in clinical practice
[7–10]. Intrauterine pressure sensors are generally
con-sidered the most accurate method to monitor UC, but
their invasive nature is associated with increased risks,
they are more expensive, and there is lack of evidence
that they are associated with improved labour outcomes
[6, 7, 11].
Some studies report that the frequency and rhythm
of UCs are good predictors of the type of delivery [4, 5].
However, in addition to the intrinsic contraction activity
of the uterus, the tocodynamometer also captures foetal
movements and respiratory movements of the pregnant
woman. In this way, the use of linear and non-linear
indices, which have proved to be useful in applications
such as in foetal heart rate analysis, can also be
consid-ered in the analysis of the UC signal [12].
The aim of this exploratory study was to evaluate
whether linear and non-linear analysis of UC signals
obtained with tocodynamometry can be useful in the
pre-diction of OVDs.
Materials and methods
An observational study was conducted, evaluating 55 UC recordings acquired between December 2008 and January 2013 at the Hospi-tal Dr Nélio Mendonça, in Funchal, Portugal. The recordings were obtained from an equal number of women, during the last hours of labour, and had a median duration of 264 min (range 88–660 min). Participants satisfied the following inclusion criteria: gestational age equal or higher than 37 weeks, singleton pregnancy, cephalic pres-entation, cervical dilatation of 4–6 cm, spontaneous labour, maxi-mum interval of 5 min between tracing-end and vaginal delivery, and absence of documented malformations. The dataset was divided into two major groups, according to the type of delivery: 32 cases of normal delivery and 23 cases of OVD. The latter were accomplished with vacuum or forceps, according to operator preference. The main maternal and foetal characteristics of the two groups are presented in Table 1.
UC signals were acquired using a conventional external tocody-namometer, placed on the maternal abdomen, linked to a STAN®31
foetal monitor (Neoventa, Gothemburg, Sweden). The UC signal was subsequently exported from the STAN monitor at a sampling rate of 4 Hz, via its RS232 port, to the Omniview-SisPorto® 3.5 system
(Specu-lum, Lisbon, Portugal) for off-line analysis [13]. The hour-before-last (H1) and the last-hour (H2) of labour were analysed, and each hour was divided into 10-min segments. Segments that did not display contractions identified by the Omniview-SisPorto® system (due to
signal loss), were considered as having poor signal quality and were excluded from further analysis (27 from H1 and 15 in H2, out of 330 segments from each hour).
Table 1: Main maternal and foetal characteristics of the normal and operative vaginal delivery (OVD) groups.
Normal (n = 32) OVD (n = 23) P-value
Maternal data, median (min–max)
Age (years) 28 (19–36) 28 (16–37) 0.277
Body mass index 26.6 (20.6–34.4) 27.9 (23.1–33.5) 0.500
Parity, n (%) 0.004
Nullipara 19 (59.4%) 22 (95.7%)
Previous vaginal delivery 13 (40.6%) 1 (4.3%)
Gestational age (weeks) 39.6 (37.0–41.0) 39.9 (37.6–41.3) 0.330
Epidural analgesia, n (%) 31 (96.9%) 22 (95.7%) 1.000
Vacuum/forceps (n) – 12/11 –
Newborn data, median (min–max)
Birthweight (g) 3160 (2400–4045) 3205 (2745–3875) 0.627
1 min Apgar 9 (9–10) 9 (7–10) 0.803
5 min Apgar 10 (9–10) 10 (9–10) 0.195
Umbilical artery blood pH 7.26 (7.05–7.37) 7.22 (7.11–7.34) 0.164
Newborn gender, n (%) 0.413
Male 15 (46.9%) 14 (60.9%)
Female 17 (53.1%) 9 (39.1%)
All the UCs identified by the Omniview-SisPorto 3.5 system were quantified (UCN), and three linear and non-linear indices were
calcu-lated [12]: “sample entropy (SampEn), interval index (II), and high frequency (HF).
SampEn is a non-linear index which quantifies signal irregu-larity [14], and is computed considering the embedding dimension (m) as 2, and the number of points (N) as 2400. The threshold para-meter (r) was automatically computed as defined by Lu et al. [15]. The presence of higher irregularity has been reported in association with muscle fatigue [16].
Interval index, II is a linear index from the time-domain, which assesses short-term UC variability (STV) taking into account long-term variability, and is defined as in the following:
= STV II STD[ ( )]sm i
(1)
where = = 1∑
24M1 + − STV 24M i sm i( 1) sm i( )(2)
M is the number of minutes in the UC segment (10 in the present study), sm(i) are values of the signal on each period of 2.5 s, and STD represents the standard deviation. Increased variability can also be associated with muscle fatigue.
HF is a linear index from the frequency-domain, which cor-responds to the absolute value of the frequency component (area below the spectrum) in the range 0.15–0.40 Hz, and typically corre-sponds to maternal breathing [12]. The HF index was obtained from nonparametric spectral estimation, using the Welch method, with a Hanning window, applied in each segment over sequences of length 256 points, with 62.5% overlap.
The collected data were coded and analysed using the Statisti-cal Package for the Social Sciences (SPSS Statistics 22.0) and MATLAB (MATLAB R2014b, Mathworks). Statistical inference was based on 95% bootstrap (B = 1000) percentile confidence intervals (95% CIs) for the median, and nonparametric Mann-Whitney and Fisher statistical tests, with significance level set at P < 0.05 [17, 18]. The ability of each index to predict OVD was determined using areas under the receiver oper-ating curve (auROC), with corresponding 95% CIs, accomplished by the sensitivity (Sen) and specificity (Spe) associated with the point of the ROC closest (considering the Euclidean distance) to the optimum. The discrimination between normal and OVD groups in the bivariate analysis was performed using the Fisher linear discriminant analysis, for which Sen and Spe were computed based on whole points, as well as on the leave-one-out method (SenLOO and SpeLOO) [17].
Results
The groups were matched for maternal and foetal
charac-teristics, with the exception of parity which was lower in
the operative delivery group (Table 1).
There were 42 women with a body mass index
(BMI) < 30 and 13 women with a BMI ≥ 30. In H
1there were
43 (78%) in which all 10-min segments had good signal
quality, and in H
2this occurred in only two cases (4%). A
significant association was found between maternal BMI
and UC signal quality in H
1, with moderate/poor signal
quality being more frequent in cases with higher maternal
BMI.
In both groups, there was an increase in UC
N,
II, and HF from H
1to H
2, denoting increases in UC
rhythm, variability, and maternal breathing (Table 2).
However, there was a decrease of SampEn from H
1to
H
2, denoting that the signal becomes more regular as
delivery approaches. The OVD group exhibited
signifi-cantly higher values of SampEn and II in H
1, denoting
increased signal irregularity and greater variability, and
higher values of UC
Nand HF in H
2, reflecting increased
UC rhythm and maternal breathing. The evolution of
UC
N, SampEn, II and HF in each segment of H
1and H
2is
presented in Figure 1.
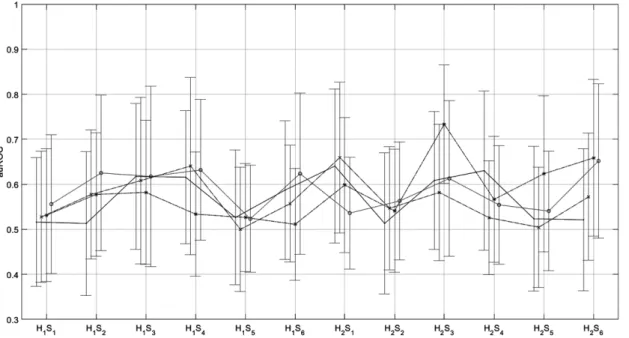
The auROC values for predicting OVD, pertaining to
the indices UC
N, SampEn, II, and HFn are presented in
Figure 2, discriminated for each 10-min segment. The
highest auROC achieved in H
1was 0.641, and in H
20.734.
The overlapping 95% CI obtained with these results does
not allow any comparisons, and suggests a modest
dis-criminative capacity of isolated indices.
With the combination of SampEn and HF, using
Fisher linear discriminant analysis, the values of Sen
and Spe obtained were respectively 66.7% and 71.0%
(Sen
LOO= 61.9% and Spe
LOO= 71.0%) in the third segment of
H
1, whereas combining UC
Nand HF in the sixth segment of
H
1, the values of Sen and Spe were respectively 71.4% and
40.0% (Sen
LOO= 81.0% and Spe
LOO= 50.0%).
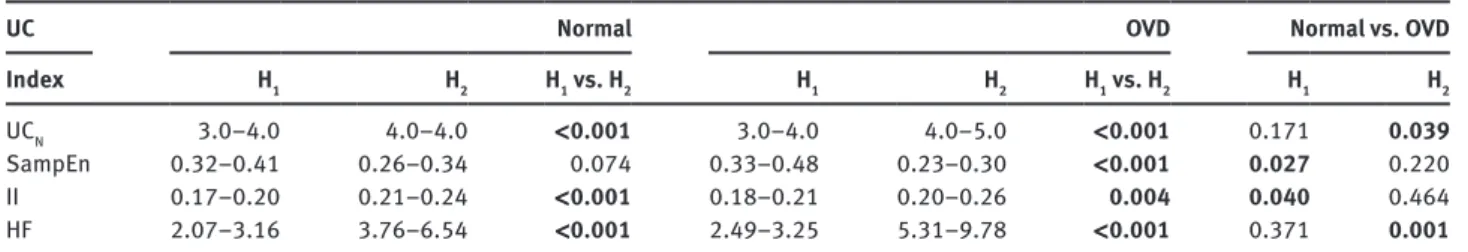
Table 2: UCN, SampEn, II, and HF in H1 and H2 for normal and operative vaginal delivery (OVD) groups.
UC
Normal OVD Normal vs. OVD
Index H1 H2 H1 vs. H2 H1 H2 H1 vs. H2 H1 H2
UCN 3.0–4.0 4.0–4.0 < 0.001 3.0–4.0 4.0–5.0 < 0.001 0.171 0.039
SampEn 0.32–0.41 0.26–0.34 0.074 0.33–0.48 0.23–0.30 < 0.001 0.027 0.220
II 0.17–0.20 0.21–0.24 < 0.001 0.18–0.21 0.20–0.26 0.004 0.040 0.464
HF 2.07–3.16 3.76–6.54 < 0.001 2.49–3.25 5.31–9.78 < 0.001 0.371 0.001
Figure 1: Evolution of the 95% CI pertaining to the indices UCN, SampEn, II, and HF, throughout the segments Si (i = 1,…,6) of H1 and H2, for
the normal (·) and OVD (x) groups. The vertical dashed lines correspond to the transition from H1 to H2. *P-value < 0.05.
Figure 2: Areas under the ROC curves (auROC) and corresponding 95% CI, pertaining to UCN (., solid line), SampEn (o, dotted line), II
(x, dashed line) and HF (*, dash-dotted line), in the discrimination between normal and OVDs, throughout the 10-min segments Si (i = 1,…,6), in the last 2 h of labour (H1 and H2).
Discussion
To the best of our knowledge, this is the first study to
eval-uate UC signals acquired by external tocography in the
prediction of OVD. Tocodynamometry is the main
tech-nology used for UC detection in current clinical practice,
despite the well-known limitations associated with signal
quality. In this study, women with higher BMI had lower
signal quality, mostly in H
1. Possible reasons for this not
occurring in H
2are an increased attention of healthcare
professionals to signal quality during the second stage of
labour, and the greater strength of UCs in this period.
The increased parity seen in the normal delivery
group was expected, and is in agreement with the
well-known fact that nulliparous women are more frequently
diagnosed with obstructed labour and therefore have
increased operative delivery rates [3].
Oppenheimer et al. [5] demonstrated that UCs occur
with increasing frequency and rhythm during the active
phase of labour. These effects are more marked in labours
that progress to vaginal delivery and are not clearly seen
in caesarean sections. Our study showed an
increas-ing frequency of UCs as delivery approaches, but also
increased maternal breathing, greater signal variability,
and regularity.
The increased signal irregularity (SampEn) and
vari-ability (II) in OVDs observed in H
1but not H
2, suggests that
instrument application and traction during H
2-corrected
uterine muscle fatigue. However, increased contraction
frequency (UC
N) and maternal breathing (HF) were
signifi-cantly higher for OVD in H
2, suggesting that
instrumenta-tion increases these parameters. An important limitainstrumenta-tion
of this study is the lack of information on the exact timing
of application of instrumental delivery.
Another limitation of the present study is the small
sample size, which may explain the lack of statistical
significance in the auROC comparisons. However, the
study was only intended to be exploratory in nature and
to evaluate the potential use of such analyses. In the ROC
analysis, SampEn and II provided a reasonable
discrimi-nation of OVD in H
1, suggesting that normalised STV and
signal irregularity may give warning of obstructed labour
with some time in advance, and this could be a simpler
clinical alternative to lactate measurement in the amniotic
fluid [19]. Bivariate analysis of the results, performed with
Fisher linear discriminant analysis, suggests that the
com-bination of indices may improve overall accuracy in
pre-diction of OVDs but further refinement is required before
this analysis may be clinically useful.
Conclusions
Analysis of UC signals obtained with tocodynamometry,
using linear and non-linear indices that are associated
with muscle fatigue (SampEn and II) and maternal
breath-ing (HF) showed that significant changes occur durbreath-ing
labour, and differences exist between normal and OVDs,
but their discriminative capacity between the two types of
delivery is modest. Further refinement of this analysis is
needed before it may be clinically useful.
Acknowledgement: Hernâni Gonçalves is financed by
a post-doctoral grant (SFRH/BPD/69671/2010) from the
Fundação para a Ciência e a Tecnologia (FCT), Portugal.
Conflict of interest statement: Diogo Ayres-de-Campos
and João Bernardes have been involved in the
develop-ment of the Omniview-SisPorto
®system for FHR
analy-sis (Speculum, Portugal). Royalties are fully converted to
institutional research funds.
References
[1] Alijahan R, Kordi M. Risk factors of dystocia in nulliparous women. Iran J Med Sci. 2014;39:254–60.
[2] Karaçam Z, Walsh D, Bugg GJ. Evolving understanding and treatment of labour dystocia. Eur J Obstet Gyn R B. 2014;182C:123–7.
[3] Lowe NK. A review of factors associated with dystocia and caesarean section in nulliparous women. J Midwifery Womens Health. 2007;52:216–28.
[4] Moghaddam TG, Moslemizadeh N, Seifollahpour Z, Shahhosseini Z, Danesh M. Uterine contractions’ pattern in active phase of labour as a predictor of failure to progress. Glob J Health Sci. 2014;6:200–5.
[5] Oppenheimer LW, Bland ES, Dabrowski A, Holmes P, McDonald O, Wen SW. Uterine contraction pattern as a predic-tor of the mode of delivery. J Perinatol. 2002;22:149–53. [6] Bakker PC, Van Rijsiwijk S, Van Geijn HP. Uterine activity
moni-toring during labour. J Perinat Med. 2007;35:468–77. [7] Euliano TY, Nguyen MT, Darmanjian S, McGorray SP, Euliano N,
Onkala A, et al. Monitoring uterine activity during labour: a comparison of 3 methods. Am J Obstet Gynecol. 2013;208:66. e1–6.
[8] Hiersch K, Salzer L, Aviram A, Ben-Haroush A, Ashwal E, Yogev Y. Factors affecting uterine electrical activity during the active phase of labor prior to rupture of membranes. J Matern Fetal Neonatal Med. 2014;29:1–4.
[9] Moslem B, Khalil M, Marque C, Diab MO. Energy distribution analysis of uterine electromyography signals. J Med Biol Eng. 2010;30:361–6.
[10] Vasak B, Graatsma EM, Hekman-Drost E, Eijkemans MJ, van Leeuwen JH, Visser GH, et al. Uterine electromyography for identification of first-stage labor arrest in term nulliparous women with spontaneous onset of labor. Am J Obstet Gynecol. 2013;209:232.e1–8.
[11] Bakker JJ, Verhoeven CJ, Janssen PF, van Lith JM,
van Oudgaarden ED, Bloemenkamp KW, et al. Outcomes after internal versus external tocodynamometry for monitoring labour. N Engl J Med. 2010;362:306–13.
[12] Gonçalves H, Pinto P, Ayres-de-Campos D, Bernardes J. External uterine contractions signal analysis in relation to labour
progression and dystocia. In: XIII Mediterranean Conference on Medical and Biological Engineering and Computing 2013, IFMBE Proceedings, Vol. 41; 2014. p. 555–8.
[13] Ayres-de-Campos D, Sousa P, Costa A, Bernardes J. Omniview-SisPorto 3.5 – a central foetal monitoring station with online alerts based on computerized cardiotogram+ST event analysis. J Perinat Med. 2008;36:260–4.
[14] Richman JS, Moorman JR. Physiological time-series analysis using approximate entropy and sample entropy. Am J Physiol Heart Circ Physiol. 2000;278:H2039–49.
[15] Lu S, Chen X, Kanters JK, Solomon IC, Chon KH. Automatic selection of the threshold value r for approximate entropy. IEEE Trans Biomed Eng. 2008;55:1966–72.
[16] Lin YT, Kuo CH, Hwang IS. Fatigue effect on low-frequency force fluctuations and muscular oscillations during rhythmic isomet-ric contraction. PLoS One. 2014;9:e85578.
[17] Dudewicz E, Mishra S. Modern mathematical statistics. New York, USA: John Wiley and Sons Inc, 1998.
[18] Martinez WL, Martinez AR. Computational statistics handbook with MATLAB. Boca Raton, FL: CRC Press, 2002.
[19] Wiberg-Itzel E, Pettersson H, Cnattingius S, Nordström K. Association between lactate concentration in amniotic fluid and dysfunctional labor. Acta Obstet Gynecol Scand. 2008;87:924–8. The authors stated that there are no conflicts of interest regarding the publication of this article.