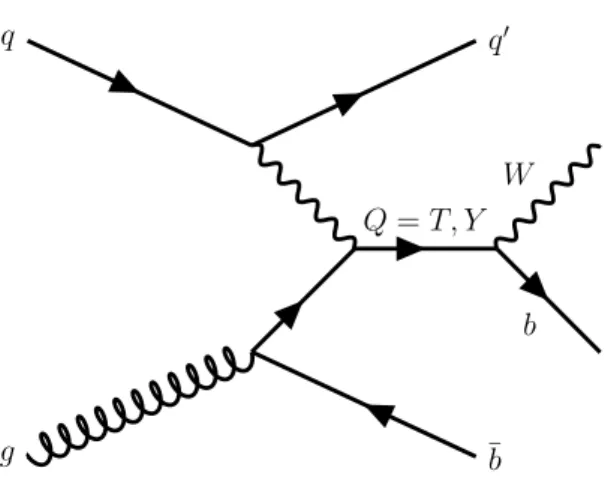
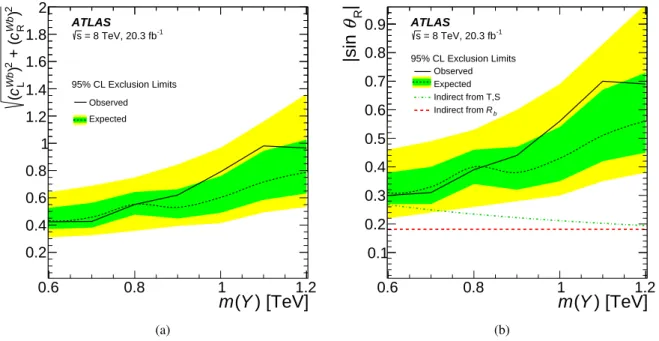
Search for single production of vector-like quarks decaying into Wb in pp collisions at $\sqrt{s} = 8$ TeV with the ATLAS detector
Texto
Imagem


Documentos relacionados
Although the sultan refused, explaining that he was in a truce with Castile, our Muslim emissary received from the king a farm on which to raise his horses, mules, and asses, and
Assim, este documento encontra-se estruturado em três partes: a primeira, em que apresento os objetivos a que me propus no início deste ano letivo; a segunda
Objective: the aim of this study was to analyze possible associations between the epidemiological variables of the study and the clinical stage and malignancy grade of squamous
Resultados: Os dados obtidos revelam que, dos 196 participantes voluntários, 94,9% acreditam ser responsáveis pelo diagnóstico e prevenção do câncer oral, 67,3% consideram seu grau
Alguns fatores são relacionados à higiene bucal insatisfa- tória em crianças hospitalizadas: a faixa etária (os menores não tem coordenação motora suficiente para uma escovação
Através da utilização dos materiais disponibilizados, a turma deve seguir as seguintes regras para jogar: formar um par com um colega do grupo; um dos alunos indica dois
A quantidade de dentifrício consumido no período do estudo também foi uma medida direta controlada por meio da entrega do tubo de dentifrício para o adolescente e outro para a
Diz Urra, (2007) que podemos ir buscar as causas à sociedade que se tornou permissiva e que procura educar as crianças nos direitos mas não nos deveres e assim está em marcha
