EUROPEAN ORGANISATION FOR NUCLEAR RESEARCH (CERN)
Eur. Phys. J. C76 (2016) 605
DOI:10.1140/epjc/s10052-016-4418-9
CERN-EP-2016-135 30th November 2016
Search for the Higgs boson produced in association
with a W boson and decaying to four b-quarks via
two spin-zero particles in pp collisions at 13 TeV
with the ATLAS detector
The ATLAS Collaboration
This paper presents a dedicated search for exotic decays of the Higgs
boson to a pair of new spin-zero particles, H → aa, where the particle
a
decays to b-quarks and has a mass in the range of 20–60 GeV. The
search is performed in events where the Higgs boson is produced in
association with a W boson, giving rise to a signature of a lepton
(elec-tron or muon), missing transverse momentum, and multiple jets from
b-quark decays. The analysis is based on the full dataset of pp
colli-sions at
√
s
= 13 TeV recorded in 2015 by the ATLAS detector at the
CERN Large Hadron Collider, corresponding to an integrated
lumin-osity of 3.2 fb
−1. No significant excess of events above the Standard
Model prediction is observed, and a 95% confidence-level upper limit
is derived for the product of the production cross section for pp → W H
times the branching ratio for the decay H → aa → 4b. The upper limit
ranges from 6.2 pb for an a-boson mass m
a= 20 GeV to 1.5 pb for
m
a= 60 GeV.
c
2016 CERN for the benefit of the ATLAS Collaboration.
1 Introduction
Following the discovery of the Higgs boson by the ATLAS and CMS Collaborations [1,2] at the Large Hadron Collider (LHC), a comprehensive programme of measurements of the properties of this particle is underway. These measurements could uncover deviations from expected Standard Model (SM) branching ratios or allow for the possibility of decays into non-SM particles. Existing measurements constrain the non-SM or “exotic” branching ratio of the Higgs boson decays to less than approximately 30% at 95% confidence level (CL) [3–5]. Exotic decays are predicted by many theories of physics beyond the SM [6], including those with an extended Higgs sector such as the Next-to-Minimal Supersymmetric Standard Model (NMSSM) [7–11], several models of dark matter [12–16], models with a first-order electroweak phase transition [17,18], and theories with neutral naturalness [19–21].
One of the simplest possibilities is that the Higgs boson decays to a pair of new spin-zero particles, a, which in turn decay to a pair of SM particles, mainly fermions [6].1 These kinds of models have been used to explain the recent observations of a gamma-ray excess from the galactic centre by the Fermi Large Area Telescope (FermiLAT) [22,23]. Several searches have been performed for H → aa. The D0 and ATLAS Collaborations have searched for a signal of H → aa → 2µ2τ in the a-boson mass ranges 3.7 GeV ≤ ma ≤ 19 GeV and 3.7 GeV ≤ ma ≤ 50 GeV, respectively [24,25]. The D0 and CMS Collaborations have searched for the signature H → aa → 4µ in the range 2mµ ≤ ma ≤ 2mτ [24,26]. In this analysis, the a-boson is assumed to have a negligibly small lifetime. Several other searches have been performed by the ATLAS, CMS and LHCb Collaborations for signatures that may correspond to a long-lived a-boson: displaced decays of jets or displaced decays of collimated leptons [27–32].
The result presented in this paper covers an unexplored decay mode in searches for H → aa by consid-ering a → bb. The a-boson can be either a scalar or a pseudoscalar under parity transformations, since the decay mode considered in this search is not sensitive to the difference in coupling. An example of a model with predominant a → bb decays is one where the new scalar mixes with the SM Higgs boson and inherits its Yukawa couplings [6]. This search focuses on the pp → W H process, with W → `ν (`= e, µ) and H → 2a → 4b in the range 20 GeV < ma < 60 GeV. The resulting signature has a single lepton accompanied by a high multiplicity of jets originating from a bottom quark (b-jets). Since the b-jets are produced from the decay of the Higgs boson, they tend to have low transverse momentum (pT) compared to mHand can be overlapping, especially for light a-bosons. Events with an electron or muon, including those produced via leptonically decaying τ-leptons, are considered. The W H process is chosen for this search because the charged lepton in the final state provides a powerful handle to efficiently trigger and identify these events against the more ubiquitous background process of strong production of four b-jets. Several kinematic variables, including the reconstructed masses in the decay H → 2a → 4b, are used to identify signal events. The background estimation techniques, systematic uncertainties and statistical treatment closely follow those used in other ATLAS searches with similar signatures [33–36].
2 ATLAS detector
The ATLAS detector [37] covers nearly the entire solid angle2around the collision point. It consists of an inner tracking detector surrounded by a thin superconducting solenoid magnet producing a 2 T axial magnetic field, electromagnetic and hadronic calorimeters, and an external muon spectrometer incorpor-ating three large toroid magnet assemblies. The inner detector consists of a high-granularity silicon pixel detector, including the newly installed insertable B-layer [38], and a silicon microstrip tracker, together providing precision tracking in the pseudorapidity range |η| < 2.5, complemented by a transition radiation tracker providing tracking and electron identification information for |η| < 2.0. The electromagnetic (EM) sampling calorimeter uses lead as the absorber material and liquid argon (LAr) as the active medium, and is divided into barrel (|η| < 1.475) and end-cap (1.375 < |η| < 3.2) regions. Hadron calorimetry is also based on the sampling technique, with either scintillator tiles or LAr as the active medium, and with steel, copper, or tungsten as the absorber material. The scintillator tile calorimeter is divided into barrel (|η| < 1.0) and end-cap (0.8 < |η| < 1.7) regions, and the LAr hadronic calorimeter includes an end-cap (1.5 < |η| < 3.2) and a forward (3.1 < |η| < 4.9) region. The muon spectrometer measures the deflec-tion of muons with |η| < 2.7 using multiple layers of high-precision tracking chambers in a toroidal field of approximately 0.5 T and 1 T in the central and end-cap regions of ATLAS, respectively. The muon spectrometer is also instrumented with separate trigger chambers covering |η| < 2.4. A two-level trigger system, consisting of a custom-hardware level followed by a software-based level, is used to reduce the event rate to a maximum of around 1 kHz for offline storage [39].
3 Event samples and object selection
The search presented in this paper is based on the proton–proton (pp) collision dataset collected by the ATLAS detector at the LHC at √s = 13 TeV with 25 ns bunch spacing during 2015. The full dataset corresponds to an integrated luminosity of 3.2 fb−1. The data for this search were collected using the single-electron or single-muon triggers with the lowest transverse momentum thresholds available [39]. Electron candidates are reconstructed by associating an inner-detector track with an isolated energy de-posit in the EM calorimeter [40, 41]. Candidates are identified using the tight quality criteria and are required to have pT > 25 GeV and |η| < 2.47, excluding the transition region between the barrel and end-cap EM calorimeters, 1.37 < |η| < 1.52. Muon candidates are reconstructed by combining match-ing tracks in the inner detector and the muon spectrometer [42], and are required to satisfy the medium quality criteria and to have pT > 25 GeV and |η| < 2.4. Events are required to have exactly one recon-structed electron or muon that is matched within a cone of size∆R ≡ p(∆η)2+ (∆φ)2= 0.15 to the lepton candidate reconstructed by the trigger algorithms.
In order to distinguish leptons produced in the decays of W bosons from those produced in the decays of heavy-flavour hadrons, all lepton candidates are required to be consistent with originating from the primary interaction vertex, chosen as the vertex with the highest sum of the p2T of its associated tracks. Furthermore, since lepton candidates arising from background sources, such as decays of hadrons, are typically embedded in jets, all lepton candidates are required to be isolated from other particles in the
2ATLAS uses a right-handed coordinate system with its origin at the nominal interaction point (IP) in the centre of the detector
and the z-axis coinciding with the axis of the beam pipe. The x-axis points from the IP to the centre of the LHC ring, and the y-axis points upward. Cylindrical coordinates (r,φ) are used in the transverse plane, φ being the azimuthal angle around the
event. This is achieved by imposing a maximal allowed value on the energy deposited in the calorimeter and/or the momentum of inner-detector tracks within a cone of ∆R = 0.2 around the direction of the lepton candidate’s momentum. The isolation criteria, dependent on pT and η, are applied to produce a nominal efficiency of at least 90% for electrons and muons from Z → `+`− decays after all other identification criteria are applied [42].
Jets are reconstructed from clusters [43] of energy in the calorimeters using the anti-kt clustering al-gorithm [44, 45] with radius parameter R = 0.4. Jets are required to have pT > 20 GeV and |η| < 2.5, and they are calibrated using energy- and η-dependent corrections. A track-based veto is used to sup-press contributions from jets arising from additional pp interactions (pile-up) [46]. Jets consistent with the hadronisation of a b-quark are identified using information from track impact parameters and second-ary vertices, which are combined in a multivariate discriminant [47]. The efficiency to identify b-quark
jets (b-tagging) is approximately 77% for a factor of 126 in rejection against light-quark and gluon jets, about 5 against jets originating from c-quarks, and about 10 against hadronically decaying τ-leptons, as determined in a simulated sample of top-quark pair (t¯t) events [47–49]. Jets tagged by this multivariate discriminant, independently of the flavour of the quark that initiated it, are called b-tagged jets through-out the text, while the term b-jet is reserved for those jets originating from b-quark decays, as determined from simulation.
Jets are required to be separated from the lepton candidates by∆R larger than 0.2 or 0.4 for electrons or muons, respectively. Electrons separated from the nearest jet by 0.2 <∆R < 0.4 are considered part of the jet and not a lepton candidate. The transverse momentum imbalance ~ETmiss, the magnitude of which (EmissT ) is commonly referred to as missing transverse momentum, is defined as the negative vector sum of the transverse momenta of calibrated selected objects, such as electrons, muons and jets. The transverse momenta of charged-particle tracks compatible with the primary vertex and not matched to any of those objects are also included in the negative vector sum [50,51].
4 Signal and background modelling
Simulated event samples are used to study the characteristics of the signal and to calculate its acceptance, and are also used for most of the SM background estimation. Signal samples of associated Higgs boson production with a W boson, pp → W H, are generated with Powheg-Box v2–r3033 [52–55] using the CT10 parton distribution functions (PDFs) [56] at next-to-leading order (NLO). A Higgs boson mass of mH = 125 GeV is assumed and the sample is normalised to the next-to-next-to-leading-order (NNLO) cross section recommended by the Higgs cross-section working group σSM(W H) = 1.37 pb [57]. The Higgs boson decay to two spin-zero a-bosons and the subsequent decay of each a-boson to a pair of b-quarks are simulated with Pythia v8.186 [58]. The a-boson decay is done in the narrow-width approx-imation and the coupling to the b-quarks is assumed to be that of a pseudoscalar. However, since the polarisation of the quarks is not observable, this search is insensitive to the specific parity hypothesis. Pythia v8.186 is used for the showering, hadronisation, and underlying-event (UE) simulation with the A14 set of tuned parameters (tune) [59]. The mass of the a-boson is varied for different signal hypotheses in the range 20 GeV ≤ ma ≤ 60 GeV, in 10 GeV mass steps. Different branching-ratio hypotheses are obtained by scaling the signal sample normalisation.
Samples of t¯t are also produced using the NLO Powheg-Box v2–r3026 generator with the CT10 PDFs. A top-quark mass (mt) of 172.5GeV is assumed. The Powheg-Box model parameter hdamp, which controls matrix element to parton shower (PS) matching and effectively regulates the high-pT radiation, is set to
hdamp= mt. This setting was found to best describe the t¯t-system pTat √
s = 7TeV [60]. The baseline t¯t sample is interfaced to Pythia v6.428 [61] with the Perugia 2012 tune [62]. Alternative t¯t samples are gen-erated using Powheg-Box v2–r3026 interfaced to Herwig++ v2.7 [63] or MadGraph5_aMC@NLO [64] interfaced to Herwig++. The effects of initial- and final-state radiation (ISR/FSR) are explored using two alternative Powheg-Box v2–r3026+Pythia v6.428 samples. The first has hdampset to 2mt, the renor-malisation and factorisation scales set to half the nominal value and uses the Perugia 2012 radHi UE tune, giving more radiation. The second sample uses the Perugia 2012 radLo UE tune, has hdamp = mt and has the renormalisation and factorisation scales set to twice the nominal value, giving less radi-ation [65]. The t¯t samples are normalised to the NNLO theoretical cross section of 832+46−51pb, obtained with Top++ v2.0 [66–72].
The simulated t¯t events are categorised depending on the parton-level flavour content of additional particle jets3 not originating from the decay of the t¯t system. Events containing at least one additional particle jet matched to a b-hadron are labelled as t¯t+ b¯b. Events containing at least one additional particle jet matched to a c-hadron and no b-hadron are labelled as t¯t+ c¯c. The t¯t + b¯b and t¯t + c¯c categories are generically referred to as t¯t+HF events (with HF standing for “heavy flavour”). Remaining events are labelled t¯t+light-jets (referred to as t¯t+light) and also include events with no additional particle jets. The associated heavy-flavour jets in t¯t+HF are modelled in Powheg-Box+Pythia via the PS evolution and are simulated with a five-flavour scheme. The t¯t+ b¯b modelling is improved by reweighting the top-quark pT, t¯t-system pT, and kinematic properties of the associated particle jets not originating from the top-quark decay [33] to agree with a t¯t+ b¯b sample generated at NLO with Sherpa+OpenLoops [73,74]. This Sherpa+OpenLoops sample is simulated with the four-flavour scheme (4FS) using Sherpa v2.1.1 [73] and the CT10 PDF set.
Samples of single-top-quark backgrounds corresponding to the Wt and s-channel production mechanisms are generated with Powheg-Box v2–r2819 [75,76] using the CT10 PDF set. Overlaps between the t¯t and Wtfinal states are handled using the “diagram removal” scheme [77]. Samples of t-channel single-top-quark events are generated using the Powheg-Box [78] NLO generator that uses the 4FS. The single-top-quark samples are normalised to the approximate NNLO theoretical cross sections [79–81]. The parton shower, hadronisation and underlying event are modelled using either Pythia v6.428 with the Perugia 2012 tune or Herwig++v2.7 with the UE-EE-5 [82] tune.
Samples of W/Z+jets events are generated with the Sherpa v2.1.1 generator. The matrix-element calcula-tion is performed up to two partons at NLO and up to four partons at leading order (LO) using Comix [83] and OpenLoops [74] and uses the CT10 PDFs. Both the W+jets and Z+jets samples are normalised to their respective inclusive NNLO theoretical cross section calculated with FEWZ [84].
Samples of diboson production WW/WZ/ZZ+jets events are generated with the NLO generator Sherpa v2.1.1. Samples of t¯t+ γ/W/Z events, including t¯t+ WW, are generated with up to two additional partons using MadGraph5_aMC@NLO and interfaced to Pythia v8.186. Samples of t¯t + H events are generated using MadGraph5_aMC@NLO and interfaced to Herwig++v2.7.
The main signal and background samples use the EvtGen v1.2.0 [85] program to simulate the decay of heavy-flavour hadrons, except for those generated with Sherpa. All are then processed with the full sim-ulation of the ATLAS detector [86] based on GEANT4 [87]. The alternative t¯t samples used to estimate
3Particle jets are reconstructed by clustering stable particles, excluding muons and neutrinos, using the anti-k
talgorithm with
a radius parameter R= 0.4. Muons and neutrinos are excluded to better reproduce the jet reconstruction based on calorimeter
systematic uncertainties are based on a fast simulation of the calorimeter response [88]. Events are gen-erated with pile-up that is simulated with Pythia v8.186 [58] and are reweighted so that the distribution of the multiplicity of pile-up interactions matches the distribution observed in the data. Simulated event samples are processed using the same reconstruction algorithms and analysis chain as the data.
As described in Section5, backgrounds are estimated by fitting predictions derived from simulation to data in several background-enriched samples. The only background prediction not derived from sim-ulation is the multijet background, which contributes to the selected data sample when a jet is mis-reconstructed as a lepton and satisfies the identification criteria. In the electron channel, it consists of non-prompt electrons from heavy-flavour decays, from unidentified photon conversions or from jets with a high fraction of energy deposited in the EM calorimeter. In the muon channel, it consists of heavy-flavour decays and in-flight decays of light mesons.
The multijet background contribution is evaluated from data using the “matrix method” [34, 89, 90], which uses differences between the isolation properties of background (fake/non-prompt) leptons and sig-nal (prompt) leptons from W boson decays. The estimate uses a sample enriched in multijet background events obtained by applying the full event selection except for loosening the lepton isolation requirement. Each event with a lepton candidate that satisfies at least the loosened isolation requirement is scaled by a weight that depends on whether this lepton candidate also satisfies the tighter isolation requirement. The weights are determined from the efficiencies for fake/non-prompt and prompt leptons satisfying the loosened isolation requirement to also satisfy the tighter one [90]. These efficiencies are measured in data
control samples enriched in either fake/non-prompt leptons, mostly multijet events, or prompt leptons, mostly Z → `+`−events. The shape of each multijet background distribution is derived by applying the same method to the sample obtained with an identical selection as described in Section5, but lowering the b-tagged-jet multiplicity requirement to two. This strategy reduces the statistical uncertainty of the multijet background estimate, improving the stability of the fitting method described in Section5.2.
5 Analysis strategy
The H → 2a → 4b decay chain is expected to have multiple b-tagged jets, often three or four, satisfying the object selection. The dominant background arises from t¯t events. Preselected events are required to have exactly one electron or muon and at least three jets, of which at least two must be b-tagged. Events are required to satisfy Emiss
T > 25 GeV and the transverse mass4must fulfil m W
T > 50 GeV, in order to be consistent with W boson decays. Events are categorised into eight channels depending on the number of jets (3, 4 and ≥5) and the number of b-tagged jets (2, 3 and ≥4). These analysis channels are referred to as (nj, mb) indicating n selected jets including m b-tagged jets.
The categories most sensitive to the H → 2a → 4b decay chain are (3j, 3b), (4j, 3b) and (4j, 4b). In these channels, background t¯t events can only satisfy the selection criteria if accompanied by additional b-tagged jets. In the case of (3j, 3b) or (4j, 3b), the main sources of t¯t background are events with jets mis-identified as b-jets, particularly from W → cs decays, where the c-jet is mis-identified, and from W →τν, where the τ-lepton decays hadronically and is likewise mis-identified. In the case of (4j, 4b), the t¯t background includes more events with genuine b-quarks from gluon splitting to b¯b pairs. The main purpose of the five other jet and b-tagged-jet multiplicity channels is to constrain the t¯t+jets background
4The transverse mass is defined as mW
T ≡ q 2Emiss T p ` T(1 − cos∆φ), where p `
Tis the transverse momentum of the lepton and∆φ
is the azimuthal angle between the lepton and ~Emiss
prediction and the related systematic uncertainties (see Section6) through a profile likelihood fit to data (see Section5.2).
The t¯t+light background is dominant in the sample of events with exactly two or three b-tagged jets. The background processes t¯t+ c¯c and t¯t+ b¯b become more important as the jet and b-tagged-jet multiplicities increase. In particular, the t¯t+ b¯b background dominates for events with ≥5 jets and ≥4 b-tagged jets.
5.1 Signal and background discrimination
In order to improve the sensitivity of the search, several kinematic variables are identified to distinguish between signal and background, and are combined into a boosted decision tree (BDT) multivariate dis-criminant [91] that uses the AdaBoost algorithm [92]. The BDT is trained to discriminate between signal events with an a-boson mass of 60 GeV and t¯t events. As described below, the variables chosen as input for the BDT do not depend strongly on the value of maand provide excellent separation between signal and background, so training each mass hypothesis separately with these variables would only slightly improve the sensitivity of the search. The training is performed separately for each of the channels (3j, 3b), (4j, 3b) and (4j, 4b) since the signal and background kinematics differ between them.
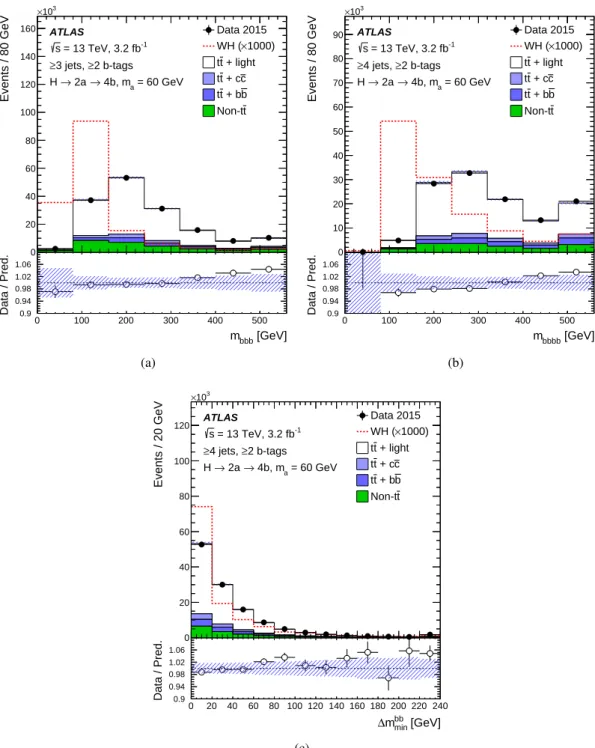
Signal events are characterised by the presence of a resonance resulting from the Higgs boson decay H → 2a → 4b. Two variables are used to reconstruct particles from the signal decay chain. The first is the reconstructed invariant mass of the b-tagged jets, mbbbor mbbbb, defined for events with three or four b-tagged jets respectively, which peaks around the Higgs boson mass for signal events. In the case of three b-tagged jets, the peak is due to events where two b-quarks are merged in a single jet or one of the b-quarks is very soft in an asymmetric decay and has a small impact on the kinematics. The second discriminating variable for events with four b-tagged jets is the minimum difference between the invariant masses of bb pairs (∆mbb
min). For signal events, two pairs of b-quarks originate from a pair of a-bosons, so for the correct jet pairing, mbb ≈ ma, and the difference between the invariant masses of the bb pairs is smaller for signal than for t¯t background events.
Additional kinematic variables exhibit differences between signal and background. The HT variable, defined as the scalar sum of pT for all jets in the event, is a measure of the total hadronic energy in the event, which is typically larger for t¯t than for W H events. The transverse momentum of the W boson, pWT, constructed from the vector sum of the ~EmissT and the lepton ~pT, is slightly higher for signal W H events, where the W boson recoils against the Higgs boson, than for background t¯t events. Another variable used is the average angular separation between all pairs of b-tagged jets, referred to as∆Rbbav. For background t¯tevents, the b-tagged jets originate from the decays of the two top quarks and tend to be spatially more separated than for the signal. A related variable is the minimum ∆R separation between any b-tagged jet and the lepton,∆R`bmin. In t¯t background events, the lepton is typically closer to a b-tagged jet than in signal events, since the lepton and the nearest b-tagged jet often originate from the same top-quark decay. In the case of the signal, the Higgs boson and hence the b-jets recoil against the W boson, which the lepton comes from.
Finally, two variables are used to identify particles from the dominant t¯t background decay chain. The first variable is used in the (4j, 3b) channel to distinguish between t¯t events with two b-tagged jets from the top-quark decays and t¯t events with a third b-tagged jet from a mis-identified charm or light jet from the hadronically decaying W boson. The invariant mass of two b-tagged jets, selected as the pair with the smallest∆R separation, and the non-b-tagged jet, mbb j, reconstructs the hadronically decaying top quark, peaking around the top-quark mass for these background events. The second variable, used in
the (4j, 4b) channel, is a variant of the mT2 observable, defined as the minimum “mother” particle mass compatible with all the transverse momenta and mass-shell constraints [93], that identifies events with several invisible particles. In the case of the t¯t background events, in addition to the ETmiss from the neutrino from a leptonic W boson decay, invisible particles may arise from a τ-lepton decay or from a lost jet from a W boson. In these cases, the mT2 has an endpoint at the top-quark mass, which is not the case for the signal.
Table1indicates which variables are used to train each of the three BDT discriminants for the (3j, 3b), (4j, 3b), and (4j, 4b) categories. Figures1–3show the expected distributions of the kinematical variables obtained after using the statistical procedure and the systematic uncertainties described in Sections5.2
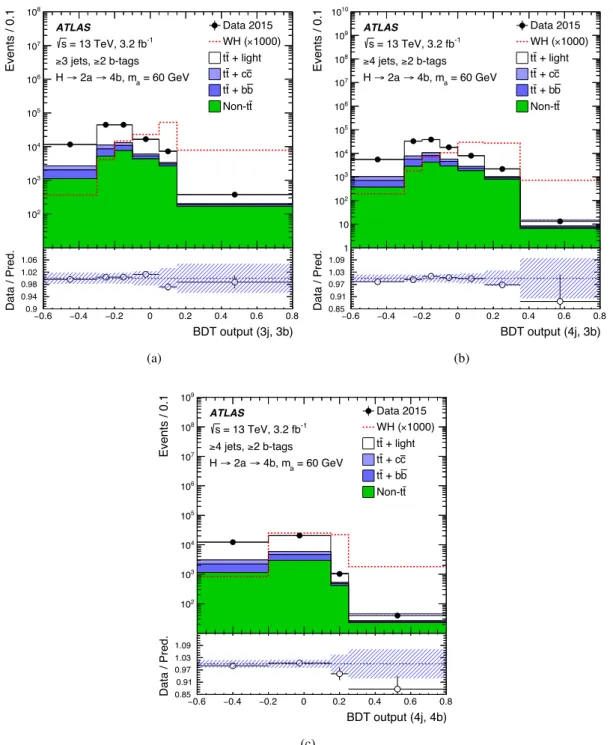
and6, respectively. These variables are used in the BDT discriminants for signal and background for all events that satisfy the event selection criteria, and are shown in Figures1–3inclusively in number of jets and tagged jets. The distributions are dominated by events with the minimum number of b-tagged jets. In this comparison, the jets in each event are ordered by value of the b-tagging discriminant and those with the highest score are used to calculate the input variables of the BDT, even if they do not satisfy the b-tagging criteria used in this analysis. The distributions are similar to those obtained in each analysis channel and indicate that each variable individually has some signal and background discrimination power. The tail in the mbbbb distribution for signal events, shown in Figure1, is mainly formed by events with jets mis-associated to the a-boson decay. The tail is greatly reduced in the signal regions with the tighter requirement on the number of b-tagged jets. Figure4shows the BDT discriminant for signal and background events that satisfy the event selection criteria inclusively in number of jets and b-tagged jets. These distributions are used to validate the BDT modelling in background-enriched samples with kinematic properties that are similar to those in the signal regions.
Region mbbb mbbbb ∆mbbmin HT pWT ∆R bb av ∆R`bmin mbb j mT2 Signal (3j, 3b) D D D D D (4j, 3b) D D D D D (4j, 4b) D D D D D Control D
Table 1: List of variables used in the three signal regions as inputs to the BDT multivariate discriminant and used in the five control regions. The variables are described in the text.
5.2 Fitting procedure
The distributions of the final discriminants in the eight analysis channels considered are combined to test the presence of a signal. The BDT discriminant, described in Section5.1, is used for the channels enriched with signal, (3j, 3b), (4j, 3b) and (4j, 4b), while the HT distribution is used in the five control channels. The statistical analysis is based on a binned likelihood function constructed as a product of Poisson probability terms over all bins considered in the search.
The likelihood function, L, depends on the parameter of interest, the signal-strength µ, defined as:
µ = σ(WH) × BR(H → aa) × BR(a → bb)2, (1)
[GeV] bbb m 0 100 200 300 400 500 Data / Pred. 0.9 0.94 0.98 1.02 1.06 1.1 Events / 80 GeV 0 20 40 60 80 100 120 140 160 3 10 × ATLAS -1 = 13 TeV, 3.2 fb s 2 b-tags ≥ 3 jets, ≥ = 60 GeV a 4b, m → 2a → H Data 2015 1000) × WH ( + light t t c + c t t b + b t t t Non-t (a) [GeV] bbbb m 0 100 200 300 400 500 Data / Pred. 0.9 0.94 0.98 1.02 1.06 1.1 Events / 80 GeV 0 10 20 30 40 50 60 70 80 90 3 10 × ATLAS -1 = 13 TeV, 3.2 fb s 2 b-tags ≥ 4 jets, ≥ = 60 GeV a 4b, m → 2a → H Data 2015 1000) × WH ( + light t t c + c t t b + b t t t Non-t (b) [GeV] min bb m ∆ 0 20 40 60 80 100 120 140 160 180 200 220 240 Data / Pred. 0.9 0.94 0.98 1.02 1.06 1.1 Events / 20 GeV 0 20 40 60 80 100 120 3 10 × ATLAS -1 = 13 TeV, 3.2 fb s 2 b-tags ≥ 4 jets, ≥ = 60 GeV a 4b, m → 2a → H Data 2015 1000) × WH ( + light t t c + c t t b + b t t t Non-t (c)
Figure 1: Comparison of data with the SM background predictions for the distributions of (a) mbbb, (b) mbbbband
(c)∆mbb
min in the sample that is inclusive in number of jets and b-tagged jets. Distributions for the signal model
(W H, H → 2a → 4b), with ma= 60 GeV, normalised to the SM pp → WH cross section, assuming BR(H → aa)
× BR(a → bb)2 = 1 and scaled by a factor of 1000, are overlaid. The hashed area represents the total uncertainty
in the background. Comparisons use events with ≥ 3 jets, except when at least four jets are necessary to define the variable, in which case events with ≥ 4 jets are used. The last bin contains the overflow. Markers are not drawn if they are outside the y-axis range.
[GeV] T H 100 200 300 400 500 600 Data / Pred. 0.9 0.94 0.98 1.02 1.06 1.1 Events / 25 GeV 0 5 10 15 20 25 30 35 40 3 10 × ATLAS -1 = 13 TeV, 3.2 fb s 2 b-tags ≥ 3 jets, ≥ = 60 GeV a 4b, m → 2a → H Data 2015 1000) × WH ( + light t t c + c t t b + b t t t Non-t (a) [GeV] W T p 0 50 100 150 200 250 300 Data / Pred. 0.9 0.94 0.98 1.02 1.06 1.1 Events / 30 GeV 0 10 20 30 40 50 60 70 3 10 × ATLAS -1 = 13 TeV, 3.2 fb s 2 b-tags ≥ 3 jets, ≥ = 60 GeV a 4b, m → 2a → H Data 2015 1000) × WH ( + light t t c + c t t b + b t t t Non-t (b) av bb R ∆ 0 0.5 1 1.5 2 2.5 3 3.5 4 4.5 5 Data / Pred. 0.85 0.91 0.97 1.03 1.09 1.15 Events / 0.5 0 10 20 30 40 50 60 70 80 3 10 × ATLAS -1 = 13 TeV, 3.2 fb s 2 b-tags ≥ 3 jets, ≥ = 60 GeV a 4b, m → 2a → H Data 2015 1000) × WH ( + light t t c + c t t b + b t t t Non-t (c) min lb R ∆ 0.5 1 1.5 2 2.5 3 3.5 4 Data / Pred. 0.75 0.85 0.95 1.05 1.15 1.25 Events / 0.4 0 10 20 30 40 50 60 70 80 3 10 × ATLAS -1 = 13 TeV, 3.2 fb s 2 b-tags ≥ 3 jets, ≥ = 60 GeV a 4b, m → 2a → H Data 2015 1000) × WH ( + light t t c + c t t b + b t t t Non-t (d)
Figure 2: Comparison of data with the SM background predictions for the distributions of (a) HT, (b) pWT, (c)
∆Rbb
av and (d)∆R`bminin the sample that is inclusive in number of jets and b-tagged jets. Distributions for the signal
model (W H, H → 2a → 4b), with ma = 60 GeV, normalised to the SM pp → WH cross section, assuming
BR(H → aa) × BR(a → bb)2= 1 and scaled by a factor of 1000, are overlaid. The hashed area represents the total
[GeV] bbj m 50 100 150 200 250 300 350 400 450 500 Data / Pred. 0.85 0.91 0.97 1.03 1.09 1.15 Events / 20 GeV 0 5 10 15 20 25 30 35 3 10 × ATLAS -1 = 13 TeV, 3.2 fb s 2 b-tags ≥ 4 jets, ≥ = 60 GeV a 4b, m → 2a → H Data 2015 1000) × WH ( + light t t c + c t t b + b t t t Non-t (a) [GeV] T2 m 80 100 120 140 160 180 200 220 240 Data / Pred. 0.9 0.94 0.98 1.02 1.06 1.1 Events / 25 GeV 0 10 20 30 40 50 60 70 80 90 3 10 × ATLAS -1 = 13 TeV, 3.2 fb s 2 b-tags ≥ 4 jets, ≥ = 60 GeV a 4b, m → 2a → H Data 2015 1000) × WH ( + light t t c + c t t b + b t t t Non-t (b)
Figure 3: Comparison of data with the SM background predictions for the distributions of (a) mbb jand (b) mT2in the
sample that is inclusive in number of jets and b-tagged jets. Distributions for the signal model (W H, H → 2a → 4b), with ma = 60 GeV, normalised to the SM pp → WH cross section, assuming BR(H → aa) × BR(a → bb)2= 1 and
scaled by a factor of 1000, are overlaid. The hashed area represents the total uncertainty in the background. The last bin contains the overflow.
Systematic uncertainties in the signal and background predictions (see Section6) are accounted for in the likelihood function as a set of nuisance parameters, θ. These parameters are implemented as Gaussian pri-ors in the case of shape uncertainties and log-normal pripri-ors for uncertainties affecting the normalisation, with width parameters corresponding to the size of the respective uncertainties. Statistical uncertainties in the background estimates in each bin of the discriminant distributions are also taken into account via dedicated nuisance parameters in the fit.
The background-only hypothesis is tested by fitting the background predictions to the observed data, setting µ = 0 and maximising the likelihood over θ. The best-fit µ is obtained by performing a binned likelihood fit to the data under the signal-plus-background hypothesis, i.e. maximising the likelihood function L(µ, θ) over µ and θ. The nuisance parameters θ allow variations of the predicted signal and background according to the corresponding systematic uncertainties, and their fitted values correspond to the deviations from the nominal predictions that globally provide the best fit to the data. This procedure allows a reduction of the impact of systematic uncertainties on the search sensitivity by taking advantage of the highly populated background-dominated channels included in the likelihood fit.
BDT output (3j, 3b) 0.6 − −0.4 −0.2 0 0.2 0.4 0.6 0.8 Data / Pred. 0.9 0.94 0.98 1.02 1.06 1.1 Events / 0.1 2 10 3 10 4 10 5 10 6 10 7 10 8 10 ATLAS -1 = 13 TeV, 3.2 fb s 2 b-tags ≥ 3 jets, ≥ = 60 GeV a 4b, m → 2a → H Data 2015 1000) × WH ( + light t t c + c t t b + b t t t Non-t (a) BDT output (4j, 3b) 0.6 − −0.4 −0.2 0 0.2 0.4 0.6 0.8 Data / Pred. 0.85 0.91 0.97 1.03 1.09 1.15 Events / 0.1 1 10 2 10 3 10 4 10 5 10 6 10 7 10 8 10 9 10 10 10 ATLAS -1 = 13 TeV, 3.2 fb s 2 b-tags ≥ 4 jets, ≥ = 60 GeV a 4b, m → 2a → H Data 2015 1000) × WH ( + light t t c + c t t b + b t t t Non-t (b) BDT output (4j, 4b) 0.6 − −0.4 −0.2 0 0.2 0.4 0.6 0.8 Data / Pred. 0.85 0.91 0.97 1.03 1.09 1.15 Events / 0.1 2 10 3 10 4 10 5 10 6 10 7 10 8 10 9 10 ATLAS -1 = 13 TeV, 3.2 fb s 2 b-tags ≥ 4 jets, ≥ = 60 GeV a 4b, m → 2a → H Data 2015 1000) × WH ( + light t t c + c t t b + b t t t Non-t (c)
Figure 4: Comparison of data with the SM background predictions for the distributions of (a) BDT (3j, 3b), (b) BDT (4j, 3b), and (c) BDT (4j, 4b) in the sample that is inclusive in number of jets and b-tagged jets. Distributions for the signal model (W H, H → 2a → 4b), with ma = 60 GeV, normalised to the SM pp → WH cross section, assuming
BR(H → aa) × BR(a → bb)2= 1 and scaled by a factor of 1000, are overlaid. The hashed area represents the total
uncertainty in the background. Comparisons use events with ≥ 3 jets, except when at least four jets are necessary to define the BDT discriminant, in which case events with ≥ 4 jets are used. The BDT output is determined in the range [−1, 1]. The first and last bin contain the underflow and overflow, respectively.
6 Systematic uncertainties
Several sources of systematic uncertainty are considered that affect the normalisation or the shape of the signal and background contributions to the final discriminant distributions. Each source of systematic uncertainty is considered to be uncorrelated with other sources, but correlated across processes and chan-nels where appropriate. This section describes the sources of systematic uncertainty considered in this search.
Luminosity and pile-up: The uncertainty in the integrated luminosity is 5%, affecting the overall nor-malisation of all processes estimated from the simulation. It is derived, following a methodology similar to that detailed in Ref. [94], from a calibration of the luminosity scale using x–y beam-separation scans performed in August 2015. The uncertainty associated with the modelling of pile-up arises mainly from differences between the expected and observed fraction of the visible pp cross section.
Reconstructed objects: Uncertainties associated with leptons arise from the reconstruction, identifica-tion and trigger efficiencies, as well as lepton momentum scales and resoluidentifica-tions. These efficiencies are measured using tag-and-probe techniques on Z → `+`−data and simulated events. The small differences found are corrected in the simulation. Negligible uncertainties arise from the corrections applied to adjust the lepton momentum scales and resolutions in simulation to match those in data. The combined effect of all these uncertainties results in an overall normalisation uncertainty in the signal and background of less than 1%.
Uncertainties associated with jets arise from the efficiency of jet reconstruction and identification, as well as the jet energy scale and resolution. The largest contribution comes from the jet energy scale uncertainty, which depends on jet pTand η. It affects the normalisation of signal and backgrounds by approximately 5% in the most sensitive search channels. Uncertainties associated with energy scales and resolutions of leptons and jets are propagated to EmissT . An uncertainty in the contribution from charged-particle tracks is also included in the EmissT uncertainty [51]. Additional uncertainties originating from the modelling of the underlying event are negligibly small.
Several uncertainties are associated with the identification of the jet flavour, in particular the modelling of the b-, c-, and light-jet-tagging efficiencies in the simulation, which are corrected to match the effi-ciencies measured in data [47–49]. These uncertainties are derived from studies performed with data at √
s= 8 TeV and are extrapolated to 13 TeV. They depend on the jet pTand the light-jet-tagging addition-ally depends on the jet η. The sources of systematic uncertainty in the tagging efficiencies are taken as uncorrelated between b-jets, c-jets, and light-jets. They have their largest impact in the (4j, 4b) channel, resulting in 4% uncertainty in the t¯t+ b¯b background normalisation associated with the uncertainty in the b-jet-tagging scale factors, 8% uncertainty in the t¯t+ c¯c background normalisation associated with the uncertainty in the c-jet-tagging scale factors, and 45% uncertainty in the normalisation of the t¯t+light background normalisation associated with the uncertainty in the light-jet-tagging scale factors.
Background modelling: Several sources of systematic uncertainty affecting the modelling of t¯t+jets are considered. An uncertainty of approximately 6% is assumed for the t¯t production cross section [72], including contributions from variations of the factorisation and renormalisation scales, and uncertainties arising from the PDFs, αS, and the top-quark mass.
A 50% uncertainty is assigned to the normalisation of the t¯t+ b¯b background. This uncertainty is de-rived from a comparison of the t¯t+ b¯b production cross sections predicted by Powheg-Box+Pythia and by Sherpa+OpenLoops at NLO (see Section 4) [33]. An additional 50% uncertainty is assigned to the
component of the t¯t+ b¯b background that contains exactly one b-hadron not originating from a top-quark decay matched to a particle jet. The same systematic uncertainty of 50% is applied to the normalisation of the t¯t+ c¯c background in the absence of an NLO prediction for this process. The uncertainties in the t¯t+ b¯b components and t¯t+ c¯c are treated as uncorrelated.
Systematic uncertainties affecting the shape of the t¯t background account for the choice of generator, the choice of parton shower and hadronisation models, and the effects of initial- and final-state radiation. The uncertainties are derived from comparisons between the nominal simulation and alternative samples produced with Powheg-Box or MadGraph5_aMC@NLO interfaced to Pythia or Herwig++ (see Sec-tion4) and are treated as uncorrelated across t¯t+jets backgrounds. Additional uncertainties are evaluated to account for the use of Sherpa+OpenLoops NLO to model the t¯t + b¯b background. In particular, uncer-tainties are assessed for the PDFs, as well as the choice of shower recoil model and scale. An additional uncertainty accounts for limited knowledge of the component of the t¯t+ b¯b background originating from multiple parton interactions, which is not included in the NLO prediction. These systematic uncertainties are estimated following the methods described in Ref. [33].
The uncertainties in the predictions for the total cross sections for the other background processes are applied as normalisation uncertainties and are: 5% for each of the W/Z+jets and diboson processes, +5%/−4% for single-top-quark production, 15% for t¯t + γ/W/Z and +9%/−12% for t¯tH [79–81, 95–
99]. An additional uncertainty of 24% is added in quadrature for each additional jet to account for the extrapolation to higher jet multiplicities, based on a comparison among different algorithms for merging LO matrix-element and parton shower simulations [100]. An uncertainty is applied to the modelling of the single-top-quark background to account for the choice of scheme to handle the overlaps between the t¯tand Wt final states. Small uncertainties arising from scale variations, which change the amount of initial-state radiation and thus the event kinematics, are also considered.
Uncertainties in the estimate of the multijet background come from the limited number of events in the data sample without the isolation requirement and from uncertainties in the measured non-prompt and prompt lepton efficiencies. The normalisation uncertainty assigned to this background is 60%, as derived by comparing the multijet background prediction to data in control regions obtained by inverting the requirements on the ETmiss and on mWT. An uncertainty in the shape of the predicted background distribution covers the difference between the prediction obtained by reducing the required number of b-tagged jets and the prediction at high b-tagged-jet multiplicity (see Section4).
Signal modelling: Several sources of systematic uncertainty affect the theoretical modelling of the signal acceptance. Uncertainties originate from the choice of PDFs, the factorization and renormalization scales, and the parton shower, hadronisation and underlying event models.
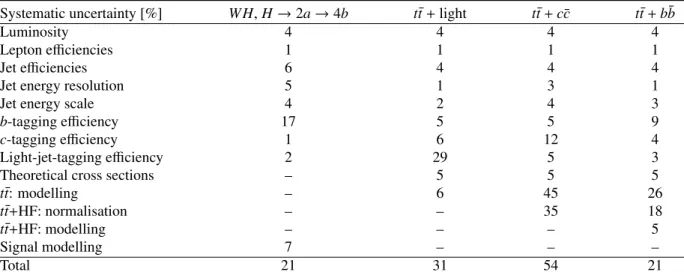
As described in Section5.2, a binned maximum-likelihood fit is performed on the distributions of the final discriminant in the eight channels considered. The fit constrains systematic uncertainties from several sources thanks to the large number of events in the analysis channels considered and the variations in the background composition across channels. The channels with two b-tagged jets constrain the main uncertainties affecting the t¯t+light background prediction, while the channels with ≥5 jets and ≥3 b-tagged jets are sensitive to the dominant uncertainties affecting the t¯t+HF background prediction. After performing the fit, the leading sources of systematic uncertainty are the modelling of the t¯t+jets background and b-, c- and light-jet-tagging efficiencies. Table2summarises the systematic uncertainties by indicating their impact on the normalisation of the signal and the main backgrounds in the (4j, 4b) channel. The uncertainties for the other signal channels (3j, 3b) and (4j, 3b) are reduced to about 7% for the t¯t+light contribution, mainly due to the reduced dependence on the light-jet-tagging efficiency, and
to about 12% for the signal, primarily because of the reduced b-tagging efficiency uncertainty due to the lower b-tagged-jet multiplicity requirement.
Systematic uncertainty [%] W H, H → 2a → 4b t¯t+ light t¯t+ c¯c t¯t+ b¯b
Luminosity 4 4 4 4
Lepton efficiencies 1 1 1 1
Jet efficiencies 6 4 4 4
Jet energy resolution 5 1 3 1
Jet energy scale 4 2 4 3
b-tagging efficiency 17 5 5 9
c-tagging efficiency 1 6 12 4
Light-jet-tagging efficiency 2 29 5 3
Theoretical cross sections – 5 5 5
t¯t: modelling – 6 45 26
t¯t+HF: normalisation – – 35 18
t¯t+HF: modelling – – – 5
Signal modelling 7 – – –
Total 21 31 54 21
Table 2: Summary of the impact of the considered systematic uncertainties (in %) on the normalisation of the signal (ma= 60 GeV) and the main backgrounds for the (4j, 4b) channel after the fit. The total uncertainty can differ from
the sum in quadrature of individual sources due to correlations between them.
7 Results
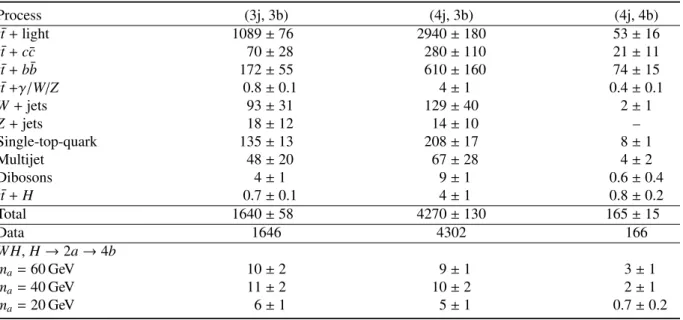
The best fit of the background predictions to data in the binned maximum-likelihood fit is shown in Figures5–7. Table3shows the resulting yields and uncertainties for the signal regions after the fit. The SM background yields obtained after performing the fit are in agreement with the results from a fit using only the HTdistributions in the control regions.
In the absence of a significant excess of data above the background prediction, upper limits are calculated for µ, defined in Eq. (1). The modified frequentist method ((CLs)) [101] and asymptotic formulae [102] are used. Figure8 shows the upper limits obtained at 95% CL. The mass hypothesis ma is tested in steps of 10 GeV between 20 and 60 GeV. The observed (expected) 95% CL upper limits on µ range from 6.2 (8.6) pb, assuming ma = 20 GeV, to 1.5 (2.0) pb, assuming ma = 60 GeV. Assuming the SM pp → W Hcross section, it is not possible to set limits on the branching fraction with the amount of data used. The reduced sensitivity for the light a-boson hypothesis is due to a lower acceptance caused by overlapping b-jets. The event yields indicated in Table3correspond to the sum of all BDT bins, while the fit is most sensitive in the highest BDT bins, where the data are slightly below the prediction, and hence the observed limit is slightly lower than the expected one.
8 Conclusion
This paper presents a dedicated search for exotic decays of the Higgs boson to a pair of new spin-zero particles, H → aa, where the new a-boson decays to b-quarks. The search focuses on the process
[GeV] T H 0 100 200 300 400 500 600 700 800 900 1000 Data / Pred. 0.9 0.94 0.98 1.02 1.06 1.1 Events / 100 GeV 0 5 10 15 20 25 3 10 × ATLAS -1 = 13 TeV, 3.2 fb s 3 jets, 2 b-tags = 60 GeV a 4b, m → 2a → H Data 2015 + light t t c + c t t b + b t t t Non-t (a) [GeV] T H 0 100 200 300 400 500 600 700 800 900 1000 Data / Pred. 0.9 0.94 0.98 1.02 1.06 1.1 Events / 80 GeV 0 5 10 15 20 25 30 3 10 × ATLAS -1 = 13 TeV, 3.2 fb s 4 jets, 2 b-tags = 60 GeV a 4b, m → 2a → H Data 2015 + light t t c + c t t b + b t t t Non-t (b) [GeV] T H 0 100 200 300 400 500 600 700 800 900 1000 Data / Pred. 0.9 0.94 0.98 1.02 1.06 1.1 Events / 80 GeV 0 5 10 15 20 25 30 3 10 × ATLAS -1 = 13 TeV, 3.2 fb s 5 jets, 2 b-tags ≥ = 60 GeV a 4b, m → 2a → H Data 2015 + light t t c + c t t b + b t t t Non-t (c)
Figure 5: Comparison between the data and prediction for the distribution of the HT variable used in the control
regions with two b-tagged jets. These distributions are after the fit is performed on data under the background-only hypothesis. The hashed area represents the total uncertainty in the background. The last bin contains the overflow.
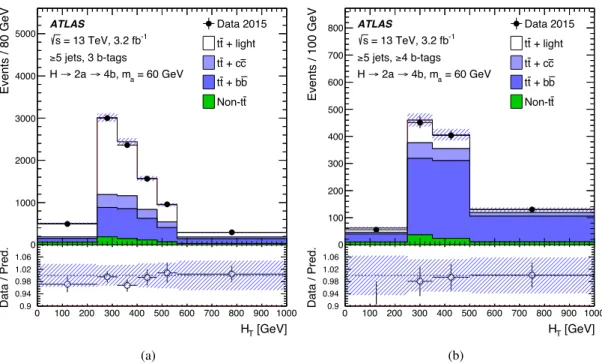
Process (3j, 3b) (4j, 3b) (4j, 4b) t¯t+ light 1089 ± 76 2940 ± 180 53 ± 16 t¯t+ c¯c 70 ± 28 280 ± 110 21 ± 11 t¯t+ b¯b 172 ± 55 610 ± 160 74 ± 15 t¯t+γ/W/Z 0.8 ± 0.1 4 ± 1 0.4 ± 0.1 W+ jets 93 ± 31 129 ± 40 2 ± 1 Z+ jets 18 ± 12 14 ± 10 – Single-top-quark 135 ± 13 208 ± 17 8 ± 1 Multijet 48 ± 20 67 ± 28 4 ± 2 Dibosons 4 ± 1 9 ± 1 0.6 ± 0.4 t¯t+ H 0.7 ± 0.1 4 ± 1 0.8 ± 0.2 Total 1640 ± 58 4270 ± 130 165 ± 15 Data 1646 4302 166 W H, H → 2a → 4b ma = 60 GeV 10 ± 2 9 ± 1 3 ± 1 ma = 40 GeV 11 ± 2 10 ± 2 2 ± 1 ma = 20 GeV 6 ± 1 5 ± 1 0.7 ± 0.2
Table 3: Expected event yields of the SM background processes in the three signal regions after performing the fit with the background-only hypothesis. The observed data and the number of expected signal events are also indicated. The signal yields are quoted for some representative values of maand assume the SM pp → W H cross
section, σSM(W H)= 1.37 pb [57], and BR(H → aa) × BR(a → bb)2 = 1. The uncertainties include statistical and
systematic components (systematic uncertainties are discussed in Section6). The total uncertainty can differ from the sum in quadrature of individual sources due to correlations between them.
pp → W Hwhere the Higgs boson is produced in association with a W boson. The analysis uses the pp collision dataset at √s = 13 TeV recorded by the ATLAS detector at the LHC in 2015, corresponding to an integrated luminosity of 3.2 ± 0.2 fb−1. The search for H → 2a → 4b is performed in the mass range 20 GeV ≤ ma ≤ 60 GeV. The analysis uses several kinematic variables combined in a multivariate discriminant in signal regions and uses control regions to reduce the uncertainties in the backgrounds. No significant excess of data is observed relative to the SM predictions. Upper limits are derived for the product of the production cross section for pp → W H times the branching ratio for the decay H → 2a → 4b. The upper limit ranges from 6.2 pb for an a-boson mass ma= 20 GeV to 1.5 pb for ma = 60 GeV.
Acknowledgements
We thank CERN for the very successful operation of the LHC, as well as the support staff from our institutions without whom ATLAS could not be operated efficiently.
We acknowledge the support of ANPCyT, Argentina; YerPhI, Armenia; ARC, Australia; BMWFW and FWF, Austria; ANAS, Azerbaijan; SSTC, Belarus; CNPq and FAPESP, Brazil; NSERC, NRC and CFI, Canada; CERN; CONICYT, Chile; CAS, MOST and NSFC, China; COLCIENCIAS, Colombia; MSMT CR, MPO CR and VSC CR, Czech Republic; DNRF and DNSRC, Denmark; IN2P3-CNRS, CEA-DSM/IRFU, France; GNSF, Georgia; BMBF, HGF, and MPG, Germany; GSRT, Greece; RGC, Hong Kong SAR, China; ISF, I-CORE and Benoziyo Center, Israel; INFN, Italy; MEXT and JSPS, Japan; CNRST, Morocco; FOM and NWO, Netherlands; RCN, Norway; MNiSW and NCN, Poland; FCT, Por-tugal; MNE/IFA, Romania; MES of Russia and NRC KI, Russian Federation; JINR; MESTD, Serbia;
[GeV] T H 0 100 200 300 400 500 600 700 800 900 1000 Data / Pred. 0.9 0.94 0.98 1.02 1.06 1.1 Events / 80 GeV 0 1000 2000 3000 4000 5000 ATLASs = 13 TeV, 3.2 fb-1 5 jets, 3 b-tags ≥ = 60 GeV a 4b, m → 2a → H Data 2015 + light t t c + c t t b + b t t t Non-t (a) [GeV] T H 0 100 200 300 400 500 600 700 800 900 1000 Data / Pred. 0.9 0.94 0.98 1.02 1.06 1.1 Events / 100 GeV 0 100 200 300 400 500 600 700 800 ATLAS -1 = 13 TeV, 3.2 fb s 4 b-tags ≥ 5 jets, ≥ = 60 GeV a 4b, m → 2a → H Data 2015 + light t t c + c t t b + b t t t Non-t (b)
Figure 6: Comparison between the data and prediction for the distribution of the HT variable used in the control
regions with three and four b-tagged jets. These distributions are after the fit is performed on data under the background-only hypothesis. The last bin contains the overflow.
MSSR, Slovakia; ARRS and MIZŠ, Slovenia; DST/NRF, South Africa; MINECO, Spain; SRC and Wallenberg Foundation, Sweden; SERI, SNSF and Cantons of Bern and Geneva, Switzerland; MOST, Taiwan; TAEK, Turkey; STFC, United Kingdom; DOE and NSF, United States of America. In addition, individual groups and members have received support from BCKDF, the Canada Council, CANARIE, CRC, Compute Canada, FQRNT, and the Ontario Innovation Trust, Canada; EPLANET, ERC, FP7, Ho-rizon 2020 and Marie Skłodowska-Curie Actions, European Union; Investissements d’Avenir Labex and Idex, ANR, Région Auvergne and Fondation Partager le Savoir, France; DFG and AvH Foundation, Ger-many; Herakleitos, Thales and Aristeia programmes co-financed by EU-ESF and the Greek NSRF; BSF, GIF and Minerva, Israel; BRF, Norway; Generalitat de Catalunya, Generalitat Valenciana, Spain; the Royal Society and Leverhulme Trust, United Kingdom.
The crucial computing support from all WLCG partners is acknowledged gratefully, in particular from CERN, the ATLAS Tier-1 facilities at TRIUMF (Canada), NDGF (Denmark, Norway, Sweden), CC-IN2P3 (France), KIT/GridKA (Germany), INFN-CNAF (Italy), NL-T1 (Netherlands), PIC (Spain), ASGC (Taiwan), RAL (UK) and BNL (USA), the Tier-2 facilities worldwide and large non-WLCG resource pro-viders. Major contributors of computing resources are listed in Ref. [103].
BDT output (3j, 3b) 0.6 − −0.4 −0.2 0 0.2 0.4 0.6 0.8 Data / Pred. 0.75 0.85 0.95 1.05 1.15 1.25 Events / 0.1 1 10 2 10 3 10 4 10 5 10 6 10 7 10 ATLAS -1 = 13 TeV, 3.2 fb s 3 jets, 3 b-tags = 60 GeV a 4b, m → 2a → H Data 2015 WH + light t t c + c t t b + b t t t Non-t (a) BDT output (4j, 3b) 0.6 − −0.4 −0.2 0 0.2 0.4 0.6 0.8 Data / Pred. 0.75 0.85 0.95 1.05 1.15 1.25 Events / 0.1 2 − 10 1 − 10 1 10 2 10 3 10 4 10 5 10 6 10 7 10 8 10 9 10 ATLAS -1 = 13 TeV, 3.2 fb s 4 jets, 3 b-tags = 60 GeV a 4b, m → 2a → H Data 2015 WH + light t t c + c t t b + b t t t Non-t (b) BDT output (4j, 4b) 0.6 − −0.4 −0.2 0 0.2 0.4 0.6 0.8 Data / Pred. 0.25 0.55 0.85 1.15 1.45 1.75 Events / 0.1 3 − 10 2 − 10 1 − 10 1 10 2 10 3 10 4 10 5 10 6 10 7 10 8 10 ATLAS -1 = 13 TeV, 3.2 fb s 4 jets, 4 b-tags = 60 GeV a 4b, m → 2a → H Data 2015 WH + light t t c + c t t b + b t t t Non-t (c)
Figure 7: Comparison between the data and prediction for the distribution of the BDT discriminant used in the signal regions. These distributions are after the fit is performed on data under the background-only hypothesis. The hashed area represents the total uncertainty in the background. The distributions for the signal model (W H, H → 2a → 4b), with ma = 60 GeV, are normalised to the SM pp → WH cross section, assuming BR(H → aa) × BR(a → bb)2= 1.
The BDT output is determined in the range [−1, 1]. The first and last bin contain the underflow and overflow, respectively. Markers are not drawn if they are outside the y-axis range.
[GeV] a m 20 30 40 50 60 BR [pb] × (WH) σ 95% C.L. upper limits on 0 10 20 Observed 95% CLs σ 1 ± Expected 95% CLs σ 2 ± Expected 95% CLs (WH) SM σ ATLAS s = 13 TeV, 3.2 fb-1
Figure 8: Upper limit at 95% CL on σ(W H) × BR, where BR= BR(H → aa) × BR(a → bb)2, versus m a. The
observed (CLs) values (solid black line) are compared to the expected (median) (CLs) values under the
background-only hypothesis (dotted black line). The surrounding shaded bands correspond to the 68% and 95% CL intervals around the expected (CLs) values, denoted by ±1σ and ±2σ, respectively. The solid red line indicates the SM
pp → W Hcross section, assuming BR(H → aa) × BR(a → bb)2 = 1. Markers are not drawn if they are outside the y-axis range.
References
[1] ATLAS Collaboration, Observation of a new particle in the search for the Standard Model Higgs boson with the ATLAS detector at the LHC,Phys. Lett. B 716 (2012) 1,
arXiv:1207.7214 [hep-ex]. [2] CMS Collaboration,
Observation of a new boson at a mass of 125 GeV with the CMS experiment at the LHC,
Phys. Lett. B 716 (2012) 30, arXiv:1207.7235 [hep-ex].
[3] ATLAS Collaboration, Measurements of the Higgs boson production and decay rates and coupling strengths using pp collision data at √s= 7 and 8 TeV in the ATLAS experiment,
Eur. Phys. J. C 76 (2016) 6, arXiv:1507.04548 [hep-ex]. [4] CMS Collaboration,
Precise determination of the mass of the Higgs boson and tests of compatibility of its couplings with the standard model predictions using proton collisions at 7 and 8 TeV,
[5] ATLAS and CMS Collaborations,
Measurements of the Higgs boson production and decay rates and constraints on its couplings from a combined ATLAS and CMS analysis of the LHC pp collision data at √s= 7 and 8 TeV, (2016), arXiv:1606.02266 [hep-ex].
[6] D. Curtin et al., Exotic decays of the 125 GeV Higgs boson,Phys. Rev. D 90 (2014) 075004, arXiv:1312.4992 [hep-ph].
[7] B. A. Dobrescu and K. T. Matchev,
Light axion within the next-to-minimal supersymmetric standard model,JHEP 09 (2000) 031, arXiv:hep-ph/0008192.
[8] U. Ellwanger et al., Towards a no lose theorem for NMSSM Higgs discovery at the LHC, (2003), arXiv:hep-ph/0305109.
[9] R. Dermisek and J. F. Gunion, Escaping the large fine tuning and little hierarchy problems in the next to minimal supersymmetric model and h —> aa decays,Phys. Rev. Lett. 95 (2005) 041801, arXiv:hep-ph/0502105.
[10] S. Chang et al., Nonstandard Higgs Boson Decays,Ann. Rev. Nucl. Part. Sci. 58 (2008) 75–98, arXiv:0801.4554 [hep-ph].
[11] D. E. Morrissey and A. Pierce,
Modified Higgs Boson Phenomenology from Gauge or Gaugino Mediation in the NMSSM,
Phys. Rev. D 78 (2008) 075029, arXiv:0807.2259 [hep-ph].
[12] V. Silveira and A. Zee, Scalar Phantoms,Phys. Lett. B 161 (1985) 136. [13] M. Pospelov, A. Ritz and M. B. Voloshin, Secluded WIMP Dark Matter,
Phys. Lett. B 662 (2008) 53–61, arXiv:0711.4866 [hep-ph].
[14] P. Draper et al., Dark Light Higgs,Phys. Rev. Lett. 106 (2011) 121805, arXiv:1009.3963 [hep-ph].
[15] S. Ipek, D. McKeen and A. E. Nelson, A Renormalizable Model for the Galactic Center Gamma Ray Excess from Dark Matter Annihilation,Phys. Rev. D 90 (2014) 055021,
arXiv:1404.3716 [hep-ph]. [16] A. Martin, J. Shelton and J. Unwin,
Fitting the Galactic Center Gamma-Ray Excess with Cascade Annihilations,
Phys. Rev. D 90 (2014) 103513, arXiv:1405.0272 [hep-ph]. [17] S. Profumo, M. J. Ramsey-Musolf and G. Shaughnessy,
Singlet Higgs phenomenology and the electroweak phase transition,JHEP 08 (2007) 010, arXiv:0705.2425 [hep-ph].
[18] N. Blinov et al., Electroweak Baryogenesis from Exotic Electroweak Symmetry Breaking,
Phys. Rev. D 92 (2015) 035012, arXiv:1504.05195 [hep-ph].
[19] G. Burdman et al., Folded supersymmetry and the LEP paradox,JHEP 02 (2007) 009, arXiv:hep-ph/0609152.
[20] N. Craig et al., Naturalness in the Dark at the LHC,JHEP 07 (2015) 105, arXiv:1501.05310 [hep-ph].
[21] D. Curtin and C. B. Verhaaren, Discovering Uncolored Naturalness in Exotic Higgs Decays,
[22] M. Ajello et al.,
Fermi-LAT Observations of High-Energyγ-Ray Emission Toward the Galactic Center,
Astrophys. J. 819 (2016) 44, arXiv:1511.02938 [astro-ph.HE].
[23] C. Boehm et al., Extended gamma-ray emission from Coy Dark Matter,JCAP 1405 (2014) 009, arXiv:1401.6458 [hep-ph].
[24] V. Abazov et al., Search for NMSSM Higgs bosons in the h → aa → µµµµ, µµττ channels using p anti-p collisions at √s= 1.96 TeV,Phys. Rev. Lett. 103 (2009) 061801,
arXiv:0905.3381 [hep-ex].
[25] ATLAS Collaboration, Search for Higgs bosons decaying to aa in the µµττ final state in pp collisions at √s= 8 TeV with the ATLAS experiment,Phys. Rev. D 92 (2015) 052002, arXiv:1505.01609 [hep-ex].
[26] CMS Collaboration, A search for pair production of new light bosons decaying into muons,
Phys. Lett. B 752 (2016) 146–168, arXiv:1506.00424 [hep-ex].
[27] ATLAS Collaboration, Search for long-lived neutral particles decaying into lepton jets in proton-proton collisions at √s= 8 TeV with the ATLAS detector,JHEP 11 (2014) 088, arXiv:1409.0746 [hep-ex].
[28] CMS Collaboration, Search for long-lived particles that decay into final states containing two electrons or two muons in proton-proton collisions at √s= 8 TeV,
Phys. Rev. D 91 (2015) 052012, arXiv:1411.6977 [hep-ex].
[29] ATLAS Collaboration, Search for long-lived, weakly interacting particles that decay to displaced hadronic jets in proton-proton collisions at √s= 8 TeV with the ATLAS detector,
Phys. Rev. D 92 (2015) 012010, arXiv:1504.03634 [hep-ex].
[30] ATLAS Collaboration, Search for pair-produced long-lived neutral particles decaying in the ATLAS hadronic calorimeter in pp collisions at √s= 8 TeV,Phys. Lett. B 743 (2015) 15, arXiv:1501.04020 [hep-ex].
[31] CMS Collaboration, Search for Long-Lived Neutral Particles Decaying to Quark-Antiquark Pairs in Proton-Proton Collisions at √s= 8 TeV,Phys. Rev. D 91 (2015) 012007,
arXiv:1411.6530 [hep-ex].
[32] LHCb Collaboration, Search for long-lived particles decaying to jet pairs,
Eur. Phys. J. C 75 (2015) 152, arXiv:1412.3021 [hep-ex].
[33] ATLAS Collaboration, Search for the Standard Model Higgs boson produced in association with top quarks and decaying into b¯b in pp collisions at √s= 8 TeV with the ATLAS detector,
Eur. Phys. J. C 75 (2015) 349, arXiv:1503.05066 [hep-ex].
[34] ATLAS Collaboration, Search for production of vector-like quark pairs and of four top quarks in the lepton-plus-jets final state in pp collisions at √s= 8 TeV with the ATLAS detector,
JHEP 08 (2015) 105, arXiv:1505.04306 [hep-ex].
[35] ATLAS Collaboration, Search for flavour-changing neutral current top quark decays t → Hq in pp collisions at √s= 8 TeV with the ATLAS detector,JHEP 12 (2015) 061,
arXiv:1509.06047 [hep-ex].
[36] ATLAS Collaboration, Search for charged Higgs bosons in the H±→ tb decay channel in pp collisions at √s= 8 TeV using the ATLAS detector,JHEP 03 (2016) 127,
[37] ATLAS Collaboration, The ATLAS Experiment at the CERN Large Hadron Collider,
JINST 3 (2008) S08003.
[38] ATLAS Collaboration, ATLAS Insertable B-Layer Technical Design Report, ATLAS-TDR-19 (2010), url:http://cdsweb.cern.ch/record/1291633.
[39] ATLAS Collaboration, 2015 start-up trigger menu and initial performance assessment of the ATLAS trigger using Run-2 data, ATL-DAQ-PUB-2016-001 (2016),
url:http://cdsweb.cern.ch/record/2136007.
[40] ATLAS Collaboration, Electron reconstruction and identification efficiency measurements with the ATLAS detector using the 2011 LHC proton-proton collision data,
Eur. Phys. J. C 74 (2014) 2941, arXiv:1404.2240 [hep-ex].
[41] ATLAS Collaboration, Electron efficiency measurements with the ATLAS detector using the 2012 LHC proton–proton collision data, ATLAS-CONF-2014-032 (2014),
url:http://cdsweb.cern.ch/record/1706245.
[42] ATLAS Collaboration, Muon reconstruction performance of the ATLAS detector in proton–proton collision data at √s= 13 TeV,Eur. Phys. J. C 76 (2016) 292, arXiv:1603.05598 [hep-ex].
[43] ATLAS Collaboration,
Topological cell clustering in the ATLAS calorimeters and its performance in LHC Run 1, (2016), arXiv:1603.02934 [hep-ex].
[44] M. Cacciari and G. P. Salam, Dispelling the N3myth for the ktjet-finder,
Phys. Lett. B 641 (2006) 57, arXiv:0512210 [hep-ph].
[45] M. Cacciari, G. P. Salam and G. Soyez, The anti-ktjet clustering algorithm,
JHEP 04 (2008) 063, arXiv:0802.1189 [hep-ph]. [46] ATLAS Collaboration,
Performance of pile-up mitigation techniques for jets in pp collisions with the ATLAS detector,
Nucl. Instrum. Meth. A 824 (2016) 367, arXiv:1510.03823 [hep-ex].
[47] ATLAS Collaboration, Expected performance of the ATLAS b-tagging algorithms in Run-2, ATL-PHYS-PUB-2015-022 (2015), url:http://cdsweb.cern.ch/record/2037697. [48] ATLAS Collaboration, Performance of b-Jet Identification in the ATLAS Experiment,
JINST 11 (2016) P04008, arXiv:1512.01094 [hep-ex]. [49] ATLAS Collaboration,
Commissioning of the ATLAS b-tagging algorithms using t¯t events in early Run-2 data, ATLAS-PHYS-PUB-2015-039 (2015), url:http://cdsweb.cern.ch/record/2047871. [50] ATLAS Collaboration, Performance of Missing Transverse Momentum Reconstruction in
Proton-Proton Collisions at 7 TeV with ATLAS,Eur. Phys. J. C 72 (2012) 1844, arXiv:1108.5602 [hep-ex].
[51] ATLAS Collaboration, Performance of missing transverse momentum reconstruction for the ATLAS detector in the first proton-proton collisions at at √s= 13 TeV,
ATL-PHYS-PUB-2015-027 (2015), url:http://cdsweb.cern.ch/record/2037904. [52] S. Frixione, P. Nason and G. Ridolfi,
A Positive-weight next-to-leading-order Monte Carlo for heavy flavour hadroproduction,
[53] P. Nason, A New method for combining NLO QCD with shower Monte Carlo algorithms,
JHEP 11 (2004) 040, arXiv:hep-ph/0409146 [hep-ph]. [54] S. Frixione, P. Nason and C. Oleari,
Matching NLO QCD computations with Parton Shower simulations: the POWHEG method,
JHEP 11 (2007) 070, arXiv:0709.2092 [hep-ph].
[55] S. Alioli et al., A general framework for implementing NLO calculations in shower Monte Carlo programs: the POWHEG BOX,JHEP 06 (2010) 043, arXiv:1002.2581 [hep-ph].
[56] H.-L. Lai et al., New parton distributions for collider physics,Phys. Rev. D 82 (2010) 074024, arXiv:1007.2241 [hep-ph].
[57] J. R. Andersen et al., Handbook of LHC Higgs Cross Sections: 3. Higgs Properties,
(2013), ed. by S Heinemeyer et al., arXiv:1307.1347 [hep-ph].
[58] T. Sjöstrand, S. Mrenna and P. Skands, A Brief Introduction to Pythia 8.1,
Comput. Phys. Commun. 178 (2008) 852, arXiv:0710.3820 [hep-ph].
[59] ATLAS Collaboration, ATLAS Run 1 Pythia8 tunes, ATL-PHYS-PUB-2014-021 (2014), url:http://cdsweb.cern.ch/record/1966419.
[60] ATLAS Collaboration, Comparison of Monte Carlo generator predictions to ATLAS measurements of top pair production at √s= 7TeV,
ATL-PHYS-PUB-2015-002 (2015),http://cdsweb.cern.ch/record/1981319. [61] T. Sjöstrand, S. Mrenna and P. Z. Skands, PYTHIA 6.4 Physics and Manual,
JHEP 05 (2006) 026, arXiv:hep-ph/0603175 [hep-ph].
[62] P. Z. Skands, Tuning Monte Carlo Generators: The Perugia Tunes,
Phys. Rev. D 82 (2010) 074018, arXiv:1005.3457 [hep-ph].
[63] M. Bahr et al., Herwig++ Physics and Manual,Eur. Phys. J. C 58 (2008) 639–707, arXiv:0803.0883 [hep-ph].
[64] J. Alwall et al., The automated computation of tree-level and next-to-leading order differential cross sections, and their matching to parton shower simulations,JHEP 07 (2014) 079,
arXiv:1405.0301 [hep-ph].
[65] ATLAS Collaboration, Comparison of Monte Carlo generator predictions from Powheg and Sherpa to ATLAS measurements of top pair production at 7 TeV,
ATL-PHYS-PUB-2015-011 (2015),http://cdsweb.cern.ch/record/2020602. [66] M. Cacciari et al., Top-pair production at hadron colliders with next-to-next-to-leading
logarithmic soft-gluon resummation,Phys. Lett. B 710 (2012) 612, arXiv:1111.5869 [hep-ph].
[67] M. Beneke et al., Hadronic top-quark pair production with NNLL threshold resummation,
Nucl. Phys. B 855 (2012) 695–741, arXiv:1109.1536 [hep-ph].
[68] P. Bärnreuther, M. Czakon and A. Mitov, Percent-Level-Precision Physics at the Tevatron: Next-to-Next-to-Leading Order QCD Corrections to q¯q → t¯t+ X,
Phys. Rev. Lett. 109 (2012) 132001, arXiv:1204.5201 [hep-ph].
[69] M. Czakon and A. Mitov, NNLO corrections to top-pair production at hadron colliders: the all-fermionic scattering channels,JHEP 12 (2012) 054, arXiv:1207.0236 [hep-ph].
[70] M. Czakon and A. Mitov,
NNLO corrections to top pair production at hadron colliders: the quark-gluon reaction,
JHEP 01 (2013) 080, arXiv:1210.6832 [hep-ph]. [71] M. Czakon, P. Fiedler and A. Mitov,
Total Top-Quark Pair-Production Cross Section at Hadron Colliders Through O(α4S),
Phys. Rev. Lett. 110 (2013) 252004, arXiv:1303.6254 [hep-ph]. [72] M. Czakon and A. Mitov,
Top++: A Program for the Calculation of the Top-Pair Cross-Section at Hadron Colliders,
Comput. Phys. Commun. 185 (2014) 2930, arXiv:1112.5675 [hep-ph]. [73] T. Gleisberg et al., Event generation with SHERPA 1.1,JHEP 02 (2009) 007,
arXiv:0811.4622 [hep-ph].
[74] F. Cascioli, P. Maierhofer and S. Pozzorini, Scattering Amplitudes with Open Loops,
Phys. Rev. Lett. 108 (2012) 111601, arXiv:1111.5206 [hep-ph]. [75] S. Alioli et al.,
NLO single-top production matched with shower in POWHEG: s- and t-channel contributions,
JHEP 09 (2009) 111, [Erratum: JHEP 02, 011 (2010)], arXiv:0907.4076 [hep-ph]. [76] E. Re,
Single-top Wt-channel production matched with parton showers using the POWHEG method,
Eur. Phys. J. C 71 (2011) 1547, arXiv:1009.2450 [hep-ph].
[77] S. Frixione et al., Single-Top Production in MC@NLO,JHEP 03 (2006) 092, arXiv:hep-ph/0512250.
[78] R. Frederix, E. Re and P. Torrielli, Single-top t-channel hadroproduction in the four-flavour scheme with POWHEG and aMC@NLO,JHEP 09 (2012) 130, arXiv:1207.5391 [hep-ph]. [79] N. Kidonakis, Next-to-next-to-leading-order collinear and soft gluon corrections for t-channel
single top quark production,Phys. Rev. D 83 (2011) 091503, arXiv:1103.2792 [hep-ph]. [80] N. Kidonakis,
Two-loop soft anomalous dimensions for single top quark associated production with a W- or H-,
Phys. Rev. D 82 (2010) 054018, arXiv:1005.4451 [hep-ph].
[81] N. Kidonakis, NNLL resummation for s-channel single top quark production,
Phys. Rev. D 81 (2010) 054028, arXiv:1001.5034 [hep-ph]. [82] M. H. Seymour and A. Siodmok,
Constraining MPI models usingσe f f and recent Tevatron and LHC Underlying Event data,
JHEP 10 (2013) 113, arXiv:1307.5015 [hep-ph].
[83] T. Gleisberg and S. Höche, Comix, a new matrix element generator,JHEP 12 (2008) 039, arXiv:0808.3674 [hep-ph].
[84] C. Anastasiou et al., High precision QCD at hadron colliders: Electroweak gauge boson rapidity distributions at NNLO,Phys. Rev. D 69 (2004) 094008, arXiv:hep-ph/0312266.
[85] D. J. Lange, The EvtGen particle decay simulation package,
Nucl. Instrum. Meth. A 462 (2001) 152–155.
[86] ATLAS Collaboration, The ATLAS Simulation Infrastructure,Eur. Phys. J. C 70 (2010) 823, arXiv:1005.4568 [physics.ins-det].
[87] S. Agostinelli et al., GEANT4: A simulation toolkit,Nucl. Instr. Meth. A 506 (2003) 250. [88] ATLAS Collaboration, The simulation principle and performance of the ATLAS fast calorimeter
simulation FastCaloSim, ATLAS-PHYS-PUB-2010-013 (2010), url:http://cdsweb.cern.ch/record/1300517.
[89] ATLAS Collaboration, Measurement of the top quark-pair production cross section with ATLAS in pp collisions at √s= 7 TeV,Eur. Phys. J. C 71 (2011) 1577, arXiv:1012.1792 [hep-ex]. [90] ATLAS Collaboration, Estimation of non-prompt and fake lepton backgrounds in final states
with top quarks produced in proton-proton collisions at √s= 8 TeV with the ATLAS detector, ATLAS-CONF-2014-058 (2014), url:http://cdsweb.cern.ch/record/1951336. [91] F. Pedregosa et al., Scikit-learn: Machine Learning in Python,
Journal of Machine Learning Research 12 (2011) 2825–2830. [92] Y. Freund and R. E. Schapire,
A Decision-Theoretic Generalization of On-Line Learning and an Application to Boosting,
Journal of Computer and System Sciences 55 (1997) 119.
[93] M. Burns et al., Using Subsystem MT2 for Complete Mass Determinations in Decay Chains with Missing Energy at Hadron Colliders,JHEP 03 (2009) 143, arXiv:0810.5576 [hep-ph]. [94] ATLAS Collaboration, Improved luminosity determination in pp collisions at √(s)= 7 TeV
using the ATLAS detector at the LHC,Eur. Phys. J. C 73 (2013) 2518, arXiv:1302.4393 [hep-ex].
[95] J. M. Campbell and R. K. Ellis, An Update on vector boson pair production at hadron colliders,
Phys. Rev. D 60 (1999) 113006, arXiv:hep-ph/9905386.
[96] J. M. Campbell and R. K. Ellis, t¯tW±production and decay at NLO,JHEP 07 (2012) 052, arXiv:1204.5678 [hep-ph].
[97] M. V. Garzelli et al., t¯tW±and t¯tZ Hadroproduction at NLO accuracy in QCD with Parton Shower and Hadronization effects,JHEP 11 (2012) 056, arXiv:1208.2665 [hep-ph]. [98] S. Dittmaier et al., Handbook of LHC Higgs Cross Sections: 1. Inclusive Observables,(2011),
arXiv:1101.0593 [hep-ph]. [99] ATLAS Collaboration,
Modelling of the t¯tH and t¯tV (V = W, Z) processes for √s= 13 TeV ATLAS analyses, ATL-PHYS-PUB-2016-005 (2016), url:http://cdsweb.cern.ch/record/2120826. [100] J. Alwall et al., Comparative study of various algorithms for the merging of parton showers and
matrix elements in hadronic collisions,Eur. Phys. J. C 53 (2008) 473–500, arXiv:0706.2569 [hep-ph].
[101] A. L. Read, Presentation of search results: The CL(s) technique,J. Phys. G 28 (2002) 2693. [102] G. Cowan et al., Asymptotic formulae for likelihood-based tests of new physics,
Eur. Phys. J. C 71 (2011) 1554, [Erratum: Eur. Phys. J.C73, 2501 (2013)], arXiv:1007.1727 [physics.data-an].
[103] ATLAS Collaboration, ATLAS Computing Acknowledgements 2016–2017,