EUROPEAN ORGANIZATION FOR NUCLEAR RESEARCH
CERN-PH-EP-2012–339 November 6, 2012
D
∗and D Meson Production
in Muon Nucleon Interactions at 160 GeV/c
The COMPASS CollaborationAbstract
The production of D∗ and D mesons in inelastic scattering of 160 GeV/c muons off a 6LiD tar-get has been investigated with the COMPASS spectrometer at CERN for 0.003 (GeV/c)2< Q2< 10 (GeV/c)2and 3 × 10⁻⁵< xB j< 0.1. The study is based on 8100 events where a D0or ¯D0is
de-tected subsequently to a D∗+or D∗−decay, and on 34000 events, where only a D0or ¯D0is detected. Kinematic distributions of D∗, D and K2∗(1430) are given as a function of their energy E, transverse momentum pT, energy fraction z, and of the virtual photon variables ν, Q2and xB j. Semi-inclusive
differential D∗production cross-sections are compared with theoretical predictions for D∗ produc-tion via photon-gluon fusion into open charm. The total observed producproduc-tion cross-secproduc-tion for D∗± mesons with laboratory energies between 22 and 86 GeV is (1.9 ± 0.4) nb. Significant cross-section asymmetries are observed between D∗+and D∗−production for ν < 40 GeV and z > 0.6.
(submitted to European Physical Journal C)
C. Adolph8, M.G. Alekseev24, V.Yu. Alexakhin7, Yu. Alexandrov15,*, G.D. Alexeev7, A. Amoroso27, A.A. Antonov7, A. Austregesilo10,17, B. Badełek30, F. Balestra27, J. Barth4, G. Baum1, Y. Bedfer22, A. Berlin2, J. Bernhard13, R. Bertini27, M. Bettinelli16, K. Bicker10,17, J. Bieling4, R. Birsa24,
J. Bisplinghoff3, P. Bordalo12,a, F. Bradamante25, C. Braun8, A. Bravar24, A. Bressan25, M. B¨uchele9, E. Burtin22, L. Capozza22, M. Chiosso27, S.U. Chung17, A. Cicuttin26, M.L. Crespo26, S. Dalla Torre24, S. Das6, S.S. Dasgupta6, S. Dasgupta6, O.Yu. Denisov28, L. Dhara6, S.V. Donskov21, N. Doshita32, V. Duic25, W. D¨unnweber16, M. Dziewiecki31, A. Efremov7, C. Elia25, P.D. Eversheim3, W. Eyrich8, M. Faessler16, A. Ferrero22, A. Filin21, M. Finger19, M. Finger jr.7, H. Fischer9, C. Franco12,
N. du Fresne von Hohenesche13,10, J.M. Friedrich17, V. Frolov10, R. Garfagnini27, F. Gautheron2, O.P. Gavrichtchouk7, S. Gerassimov15,17, R. Geyer16, M. Giorgi25, I. Gnesi27, B. Gobbo24, S. Goertz4, S. Grabm¨uller17, A. Grasso27, B. Grube17, R. Gushterski7, A. Guskov7, T. Guth¨orl9,b, F. Haas17, D. von Harrach13, F.H. Heinsius9, F. Herrmann9, C. Heß2, F. Hinterberger3, N. Horikawa18,c, Ch. H¨oppner17, N. d’Hose22, S. Huber17, S. Ishimoto32,d, O. Ivanov7, Yu. Ivanshin7, T. Iwata32, R. Jahn3, V. Jary20, P. Jasinski13, R. Joosten3, E. Kabuß13, D. Kang13, B. Ketzer17, G.V. Khaustov21, Yu.A. Khokhlov21, Yu. Kisselev2, F. Klein4, K. Klimaszewski30, S. Koblitz13, J.H. Koivuniemi2, V.N. Kolosov21,
K. Kondo32, K. K¨onigsmann9, I. Konorov15,17, V.F. Konstantinov21, A. Korzenev22,e, A.M. Kotzinian27, O. Kouznetsov7,22, M. Kr¨amer17, Z.V. Kroumchtein7, F. Kunne22, K. Kurek30, L. Lauser9,
A.A. Lednev21, A. Lehmann8, S. Levorato25, J. Lichtenstadt23, T. Liska20, A. Maggiora28,
A. Magnon22, N. Makke22,25, G.K. Mallot10, A. Mann17, C. Marchand22, A. Martin25, J. Marzec31, T. Matsuda14, G. Meshcheryakov7, W. Meyer2, T. Michigami32, Yu.V. Mikhailov21, A. Morreale22,f, A. Mutter9,13, A. Nagaytsev7, T. Nagel17, F. Nerling9, S. Neubert17, D. Neyret22, V.I. Nikolaenko21, W.-D. Nowak9, A.S. Nunes12, A.G. Olshevsky7, M. Ostrick13, A. Padee31, R. Panknin4, D. Panzieri29, B. Parsamyan27, S. Paul17, E. Perevalova7, G. Pesaro25, D.V. Peshekhonov7, G. Piragino27,
S. Platchkov22, J. Pochodzalla13, J. Polak11,25, V.A. Polyakov21, J. Pretz4,g, M. Quaresma12,
C. Quintans12, J.-F. Rajotte16, S. Ramos12,a, V. Rapatsky7, G. Reicherz2, E. Rocco10, E. Rondio30, N.S. Rossiyskaya7, D.I. Ryabchikov21, V.D. Samoylenko21, A. Sandacz30, M.G. Sapozhnikov7, S. Sarkar6, I.A. Savin7, G. Sbrizzai25, P. Schiavon25, C. Schill9, T. Schl¨uter16, A. Schmidt8,
K. Schmidt9,b, L. Schmitt17,h, H. Schm¨ıden3, K. Sch¨onning10, S. Schopferer9, M. Schott10,
O.Yu. Shevchenko7, L. Silva12, L. Sinha6, A.N. Sissakian7,*, M. Slunecka7, G.I. Smirnov7, S. Sosio27, F. Sozzi24, A. Srnka5, L. Steiger24, M. Stolarski12, M. Sulc11, R. Sulej30, H. Suzuki32,c, P. Sznajder30, S. Takekawa28, J. Ter Wolbeek9,b, S. Tessaro24, F. Tessarotto24, L.G. Tkatchev7, S. Uhl17, I. Uman16, M. Vandenbroucke22, M. Virius20, N.V. Vlassov7, L. Wang2, T. Weisrock13, M. Wilfert13,
R. Windmolders4, W. Wi´slicki30, H. Wollny22, K. Zaremba31, M. Zavertyaev15, E. Zemlyanichkina7, M. Ziembicki31, N. Zhuravlev7and A. Zvyagin16
1Universit¨at Bielefeld, Fakult¨at f¨ur Physik, 33501 Bielefeld, Germanyi
2Universit¨at Bochum, Institut f¨ur Experimentalphysik, 44780 Bochum, Germanyi
3Universit¨at Bonn, Helmholtz-Institut f¨ur Strahlen- und Kernphysik, 53115 Bonn, Germanyi 4Universit¨at Bonn, Physikalisches Institut, 53115 Bonn, Germanyi
5Institute of Scientific Instruments, AS CR, 61264 Brno, Czech Republicj
6Matrivani Institute of Experimental Research & Education, Calcutta-700 030, Indiak 7Joint Institute for Nuclear Research, 141980 Dubna, Moscow region, Russial 8Universit¨at Erlangen–N¨urnberg, Physikalisches Institut, 91054 Erlangen, Germanyi 9Universit¨at Freiburg, Physikalisches Institut, 79104 Freiburg, Germanyi
10CERN, 1211 Geneva 23, Switzerland
11Technical University in Liberec, 46117 Liberec, Czech Republicj 12LIP, 1000-149 Lisbon, Portugalm
14University of Miyazaki, Miyazaki 889-2192, Japann 15Lebedev Physical Institute, 119991 Moscow, Russia
16Ludwig-Maximilians-Universit¨at M¨unchen, Department f¨ur Physik, 80799 Munich, Germanyio 17Technische Universit¨at M¨unchen, Physik Department, 85748 Garching, Germanyio
18Nagoya University, 464 Nagoya, Japann
19Charles University in Prague, Faculty of Mathematics and Physics, 18000 Prague, Czech Republicj 20Czech Technical University in Prague, 16636 Prague, Czech Republicj
21State Research Center of the Russian Federation, Institute for High Energy Physics, 142281 Protvino,
Russia
22CEA IRFU/SPhN Saclay, 91191 Gif-sur-Yvette, France
23Tel Aviv University, School of Physics and Astronomy, 69978 Tel Aviv, Israelp 24Trieste Section of INFN, 34127 Trieste, Italy
25University of Trieste, Department of Physics and Trieste Section of INFN, 34127 Trieste, Italy 26Abdus Salam ICTP and Trieste Section of INFN, 34127 Trieste, Italy
27University of Turin, Department of Physics and Torino Section of INFN, 10125 Turin, Italy 28Torino Section of INFN, 10125 Turin, Italy
29University of Eastern Piedmont, 15100 Alessandria, and Torino Section of INFN, 10125 Turin,
Italy
30National Centre for Nuclear Research and University of Warsaw, 00-681 Warsaw, Polandq 31Warsaw University of Technology, Institute of Radioelectronics, 00-665 Warsaw, Polandq 32Yamagata University, Yamagata, 992-8510 Japann
aAlso at IST, Universidade T´ecnica de Lisboa, Lisbon, Portugal
bSupported by the DFG Research Training Group Programme 1102 “Physics at Hadron
Accelera-tors”
cAlso at Chubu University, Kasugai, Aichi, 487-8501 Japann dAlso at KEK, 1-1 Oho, Tsukuba, Ibaraki, 305-0801 Japan eOn leave of absence from JINR Dubna
fpresent address: National Science Foundation, 4201 Wilson Boulevard, Arlington, VA 22230,
United States
gpresent address: RWTH Aachen University, III. Physikalisches Institut, 52056 Aachen, Germany hAlso at GSI mbH, Planckstr. 1, D-64291 Darmstadt, Germany
iSupported by the German Bundesministerium f¨ur Bildung und Forschung jSupported by Czech Republic MEYS Grants ME492 and LA242
kSupported by SAIL (CSR), Govt. of India lSupported by CERN-RFBR Grants 08-02-91009
mSupported by the Portuguese FCT - Fundac¸˜ao para a Ciˆencia e Tecnologia, COMPETE and QREN,
Grants CERN/FP/109323/2009, CERN/FP/116376/2010 and CERN/FP/123600/2011
nSupported by the MEXT and the JSPS under the Grants No.18002006, No.20540299 and No.18540281;
Daiko Foundation and Yamada Foundation
oSupported by the DFG cluster of excellence ‘Origin and Structure of the Universe’
(www.universe-cluster.de)
pSupported by the Israel Science Foundation, founded by the Israel Academy of Sciences and
Hu-manities
qSupported by the Polish NCN Grant DEC-2011/01/M/ST2/02350 *Deceased
1 Introduction
The production of D mesons in inelastic scattering of 160 GeV/c muons on nucleons µN → µ0DX is assumed to be dominated by a process where the exchanged virtual photon γ∗ fuses with a gluon g into a charm anti-charm quark pair, γ∗g→ c ¯c. The cross-section σγ∗g→c ¯c of this photon-gluon fusion
(PGF) process and its dependence on the relative polarization of photon and gluon can be calculated in perturbative QCD [1–8]. Thus, using polarized muons and polarized nucleons, a measurement of the photon nucleon cross-section asymmetry ∆σγ∗N→c ¯cX/σγ∗N→c ¯cX allows the determination of the gluon
polarization ∆g/g in the nucleon. With this objective, open charm production has been studied in the COMPASS experiment at CERN for longitudinally polarized muons interacting with longitudinally po-larized deuterons. The incoming muon energy of 160 GeV was chosen, since the cross-section difference ∆σγ
∗N→c ¯cX
for parallel and anti-parallel spins of photon and nucleon reaches a maximum for virtual photon energies around 80 GeV according to most models for the gluon helicity distribution function ∆g(xB j, Q2), and the polarization transfer from muon to virtual photon is large in the relevant photon
energy range.
Final states, where the decays D0→ K−π+or D∗+→ D0π+→ K−π+π+or the charge conjugate decays are detected, are chosen in order to achieve the best possible combination of mass resolution, signal-over-background ratio and signal statistics. Based on samples of events with these final states, extracted from data taken during the years 2002-2006, COMPASS has published results for h∆g/gi [9].
The photon-gluon cross-section asymmetry aLL = ∆σγ
∗g→c ¯c
/σγ∗g→c ¯c needed for extracting h∆g/gi is
estimated making two assumptions: only PGF contributes as calculated in leading order QCD and charm and anti-charm quarks hadronize independently of the target polarization. The parton kinematics are estimated event-by-event on the basis of the observed 3-momentum of the D0meson and the momentum difference of the incoming and the scattered muon using a parametrisation based on the Monte Carlo event generator AROMA with default charm quark fragmentation [10].
However, production mechanisms other than PGF with standard charm quark fragmentation may con-tribute to the observed events with charmed mesons. The interaction of the virtual photon with intrinsic charm [11–13] is one possible competing mechanism. The associated production of ΛcD¯0[14] or, more
generally, asymmetric hadronization of c and ¯clike in the Dual Parton model with a meson and a baryon string [15, 16] may play an important role in some regions of phase space. A study of the phase space dis-tributions and semi-inclusive differential cross-sections of the D0and D∗mesons within the acceptance of the COMPASS spectrometer may yield information about the contributions of different production mechanisms [17].
At HERA, i.e. at much larger center-of-mass energy, charm electro-production has been studied in detail by the H1 and ZEUS Collaborations, see [18–20] and references therein. In addition to the PGF other production mechanisms also contribute in this case, like gluon-gluon fusion to c ¯cfrom a resolved pho-ton. The hadronizations of c and ¯ccan more safely be assumed to be independent. COMPASS covers a complementary kinematic region with virtual photon energies in the range from threshold at about 30 GeV up to 140 GeV in the laboratory frame. Prior to COMPASS, this energy range was covered only by the EMC experiment [21], which collected about 90 D0 meson events produced by deep inelastic
scat-tering of 240 or 280 GeV muons on hydrogen and deuterium targets for a study of the charm production mechanism. Only one charm photo-production experiment explored the region close to threshold [22], while two concentrated on high energy photons [16, 23].
The present article shows details of the phase space distributions of D meson production as a function of various kinematic variables: the energy ν = Eµ− E
0
µ of the exchanged virtual photon γ
∗ (assuming
single photon exchange) with four momentum q = p − p0, the inelasticity y = ν/Eµ of the event, the
negative invariant γ∗ mass squared Q2 = −q2= −(p − p0)2 and the Bjorken scaling variable xB j =
Q2/2P · q = Q2/2Mpν . Here Eµ and E 0
µ are the laboratory energies, p and p
4 2 EXPERIMENTAL SETUP
of the incoming and scattered muon respectively, P is the 4-momentum of the target nucleon and Mpis
the proton mass.
In order to describe both D∗and D0 meson production, the following kinematic variables are used: the transverse momentum pT of the Kπ pair (from the D0 decay) with respect to the γ∗ direction, the D0
energy E in the laboratory system and the energy fraction z = E/ν.
The outline of the paper is as follows: after a brief overview of the experimental set-up (section 2) and a detailed description of the data selection procedure (section 3), the methods of signal extraction are described in section 4. The kinematic distributions of events from signal and background regions are shown in section 5. They are based on the entire available data sample collected during the years 2002-2006, and are not corrected for acceptance. The purpose of this section is to compare the distributions of open charm to those of background events. Section 6 describes the acceptance correction and luminosity calculation needed to extract the total and differential semi-inclusive cross sections for charm production. They are performed for the 2004 data only. In section 7, the differential cross-sections as a function of the various kinematic variables and the total cross-section obtained by integration are shown and compared with available theoretical (AROMA) predictions for the production of D mesons by PGF. Significant differences between D∗+ and D∗− meson production are observed for the acceptance-corrected data from 2004. A statistically more precise comparison of D∗+ and D∗− production is based on the entire data sample (2002-2006). Particle-antiparticle asymmetries are determined under the assumption, which is verified for the 2004 data, that the D∗+and D∗−acceptances are equal to a good approximation.
2 Experimental setup
The data were taken using the COMPASS spectrometer situated at the M2 beam line at the CERN Super Proton Synchrotron. A detailed description of the COMPASS spectrometer can be found in Ref. [24]. The momentum of the positive muon beam is about 160 GeV/c with a spread of 5%. The momentum of each incoming muon is measured with a precision of ∆p/p < 1% in the beam momentum spectrometer located upstream of the experimental hall, and its direction is measured with a precision of 30 µrad with a detector telescope in front of the target.
The (polarized)6LiD target consisted of two 60 cm long cells during the years 2002-2004 and of 3 cells with a total length of 120 cm in 2006. The polarization is reversed regularly such that the products of integrated luminosities times acceptance are equal for both polarizations. The sum of both corresponds to the unpolarized case. Hence unpolarized distributions, which are the subject of the present analysis, are obtained from the sum of all data. The target is housed in a superconducting solenoid magnet, which determines the angular acceptance of the spectrometer. The acceptance in the polar angle, measured at the upstream edge of the target, was 70 mrad in 2002-2004, while with the new target magnet in 2006 it was increased to 180 mrad.
The 2-stage spectrometer is designed to reconstruct and identify the scattered muon and produced hadrons over a wide momentum range. It contains a large angle (LAS) and a small angle (SAS) part, each part equipped with a dipole magnet. Tracking detectors are located in front and behind each magnet, and electromagnetic and hadron calorimeters behind. The LAS covers polar laboratory angles from about 15 mrad up to 70 mrad in 2002-2004 and, with the new target magnet, up to 180 mrad in 2006. The SAS covers the polar laboratory angles below 20 mrad.
Particle tracking is done with a large variety of tracking detectors: several stations of silicon microstrip detectors, scintillating fiber detectors, high resolution micromesh gaseous chambers, gas electron-multi-plier chambers, drift chambers, large area straw drift chambers, multiwire proportional chambers and muon drift tubes. The scattered muons are identified downstream of additional hadron absorbers placed behind the hadron calorimeters. Charged hadrons are identified by a Ring Imaging Cherenkov detector
(RICH) in the LAS.
The trigger system [25] uses hodoscope and calorimeter information to select inelastic muon interactions with minimum bias. The overall trigger and muon track reconstruction efficiency is in the range 60% to 80% for most of the kinematic region covered by COMPASS.
3 Data selection
The total number of events with an incoming muon (140 GeV/c < pµ < 180 GeV/c) and a scattered
muon from a common vertex is 5.2 × 10⁹, which corresponds to an integrated luminosity of about 2.8 fb−1. This sample is used to search for D0( ¯D0) and D∗±mesons. A fiducial volume cut makes sure that the extrapolated incoming muon trajectory traverses all target cells and that the primary vertex is located within the volume of one of the target cells.
Since the COMPASS experiment uses a large solid target, the detection of a secondary decay vertex, which is a standard method in open charm detection, is excluded and the selection of D0( ¯D0) and D∗± mesons relies on requirements on event kinematics and particle identification. The event selection is the same as used in the previous COMPASS open charm publication [9] except for stricter requirements on the selection of the incoming muon.
Cuts used to select D0 originating from the decay of a D∗ (referred to as D∗ or ‘tagged’ D0 sample) slightly differ from those used to select directly produced D0 mesons (referred to as ‘untagged’ D0 sample). An event from the untagged D0 sample contains at least one candidate for the 2-body decay D0→ K−
π+ or its charge conjugate (c.c.), while in the tagged D0 sample a slow pion from the decay chain D∗+→ D0π+
s → K−π+πs+(or c.c) has to be present in addition.
Particles are identified by using the RICH. All tracks with momentum measured in one or both spec-trometer stages and falling within the geometrical acceptance of the RICH are used to calculate the likelihoods (LKs) that the Cherenkov photons detected by the RICH are due to electron, muon, pion, kaon, proton, or background. The LK for a specific particle is calculated only if the particle velocity is above the threshold for the emission of Cherenkov photons in the radiator gas. This threshold depends on the refractive index that is extracted from the data on a run-by-run basis. For pions, kaons, and protons, this gives an average momentum threshold of 2.5, 8.9 and 16.9 GeV/c respectively. At large momenta pions and kaons cannot be efficiently separated, thus it is required that the momentum of the particle is below 50 GeV/c. In the tagged D0 sample, due to the small mass difference between the D∗(2010) and the D0(1865), only a limited energy is available for the pion produced in the D∗→ D0
πsdecay. In
this case, the πscandidate must not have been identified as an electron by the RICH. Details on the LK
requirements and the use of the RICH information can be found in Ref. [17].
For untagged D0, the following cuts are applied to the K−π+and K+π− combinations: pπ> 7 GeV/c,
z> 0.2, |M(Kπ) − M(D0)| < 700 and | cos θ
K| < 0.65, where θK is the decay kaon angle in the D0
center-of-mass system with respect to the D0direction of flight.
For the tagged D0, the Kππs invariant mass is calculated only if the Kπ system has an invariant mass
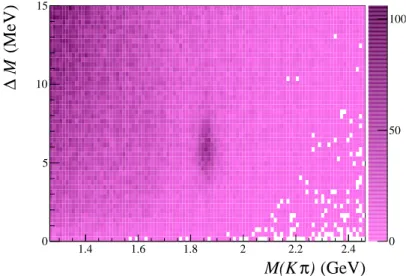
in the range |M(Kπ) − M(D0)| < 700 MeV. The distribution of ∆M = M(Kππs) − M(Kπ) − M(π) as
a function of M(Kπ) is shown in Fig. 1. Here a clear spot for the D∗ is visible at ∆M ∼ 6 MeV in the region of the D0 mass. The cut 3.2 MeV < ∆M < 8.9 MeV improves the D0 signal with respect to the combinatorial background by more than an order of magnitude. The Kπ system is also required to have z> 0.2 and | cos θK| < 0.9.
These sets of cuts define the untagged and tagged D0samples, i.e. the D0and D∗candidates.
The cos θK distribution is the only distribution where a safe theoretical prediction can be made. The
6 3 DATA SELECTION (GeV) ) π M(K 1.4 1.6 1.8 2 2.2 2.4 (MeV) M ∆ 0 5 10 15 0 50 100
Fig. 1: Scatter plot for D∗ candidates before applying the ∆M cut. Vertical axis: ∆M; horizontal axis: M(Kπ). The accumulation of events around the D0 nominal mass of 1.864 GeV and ∆M = 6.1 MeV corresponds to the decay sequence D∗→ πsD0→ πs(Kπ).
) K θ cos( -1 -0.8 -0.6 -0.4 -0.2 0 0.2 0.4 0.6 0.8 1 Events 0 1000 2000 3000 0.001 × raw 5 × sig 1 × cor
Fig. 2: Distribution of cos θK in the Kπ rest frame for (mostly) background combinations (scaled by
0.001, solid line), for the D0signal region (scaled by 5, full circles) and for the acceptance corrected D0 signal (open squares). The dashed lines correspond to the | cos θK| < 0.9 cut. The D0signal is from the
2004 tagged D0sample.
Fig. 2 is strongly peaked towards cos θK= −1. For signal events, the cos θK distribution should be flat
after acceptance correction since the D0has spin 0. This expectation for the D0is confirmed in Fig. 2 where, for the tagged D0sample, the distribution for D0is shown before and after acceptance correction (the method of signal extraction and the correction for the acceptance will be described in secs. 4 and 6). The so-called ambiguity cut applied in Ref. [9] is not applied in the present analysis. This cut discards an event if two D0 or ¯D0meson candidates are found within the mass window of ±700 MeV and removes a significant number of good events. However, the probability to find two D0(or two ¯D0) mesons in the signal peak is practically zero. Hence the present analysis, which extracts the number of signal events from fitting separately the D0and ¯D0peaks, does not suffer from this ambiguity.
In the mass window of ±700 MeV around the nominal D0mass, the tagged D0sample consists of 160 × 103 neutral Kπ combinations. In order to avoid overlapping samples, at this stage, the D∗ candidates
(GeV) ) π M(K 1500 2000 2500 Events 0 100 200 300 400 3 10 × + π K and -π + K + π -K -π + K (a) (GeV) ) π M(K 1500 2000 2500 Events 0 20 40 3 10 × + π K and -π + K (b) (GeV) ) π M(K 1500 2000 2500 Events 0 1000 2000 3000 4000 π+ K and -π + K + π -K -π + K (c) (GeV) ) π M(K 1500 2000 2500 Events 0 500 1000 + π K and -π + K (d)
Fig. 3: Invariant M(Kπ) mass spectra within a window of ±700 MeV around the nominal D0mass. (a) D0sample before and (b) after background subtraction, (c) D∗sample before and (d) after background subtraction. Both neutral charge combinations are shown separately, together with their sum in (a) and (c). See text for the background subtraction by fits.
are taken out of the untagged D0 sample. In the same mass window, the untagged D0sample comprises 17 × 106neutral Kπ combinations.
The invariant Kπ mass spectra are shown in Fig. 3a for the untagged D0 sample, for all neutral Kπ combinations and also separately for the K+π−and K−π+combinations. These spectra exhibit the D0 peak at 1865 MeV. The prominent peak to the left is due to the decay of the narrow K2∗(1430). In Fig. 3c invariant mass spectra are shown for the tagged D0sample. In this case, only some feed-through of the K2∗(1430) resonance is seen and a pronounced, rather narrow peak about 250 MeV below the nominal D0mass. As shown by Monte Carlo simulations, this peak at 1620 MeV results from 3-body decays of the D0→ Kππ0, where the π0 escaped detection, with some contributions from D∗ decays with more
than 3 particles in the final state. The signal-over-background (S/B) ratio is about 1:1 for the events of the tagged D0sample. For the untagged D0sample, S/B is only 1:10, but the number of signal events is four times higher1.
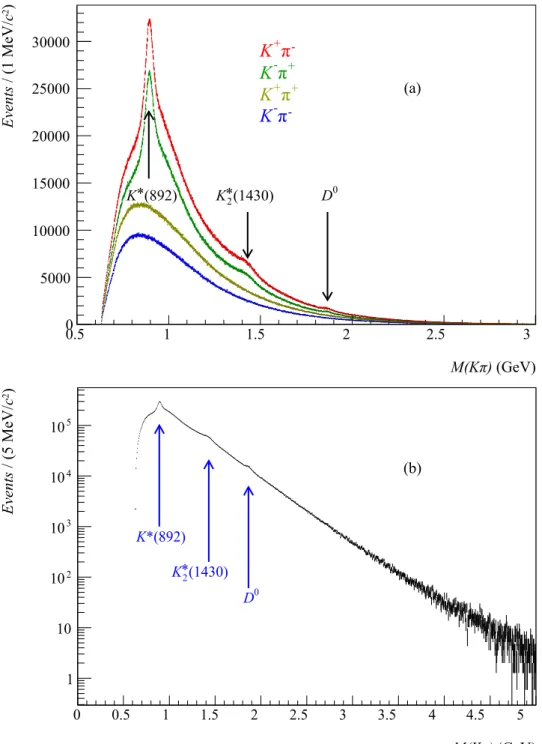
Mass spectra of all the Kπ combinations are shown in Fig. 4a separately, using only data from 2004. The spectra for the two neutral charge combinations show three narrow peaks corresponding to K∗(890), K2∗(1430) and D0(1865). Also, other short lived kaonic (strange) resonances are present but they super-impose together with combinatorial background to a structureless distribution that can almost perfectly be described by a single exponential function, see Fig.4b.
8 3 DATA SELECTION M(Kπ) (GeV) 0.5 1 1.5 2 2.5 3 Events / (1 MeV/ c 2) 0 5000 10000 15000 20000 25000 30000 K*(892) K*(1430)2 D0
-π
+K
+π
-K
+π
+K
-π
-K
0 0.5 1 1.5 2 2.5 3 3.5 4 4.5 5 1 10 2 10 3 10 4 10 5 10 K*(892) *(1430)2 K 0 D M(Kπ) (GeV) Events / (5 MeV/ c 2) (b) (a)Fig. 4: Kπ invariant mass distribution for the full mass range using data from 2004 only. (a) All four charge combinations (from top to bottom + –, – +, – –, + +) are shown separately, with a linear vertical scale; (b) only neutral, non-exotic charge combinations (– +, + –) summed up, logarithmic vertical scale.
4 Method of signal extraction
The invariant Kπ mass spectra shown in Figs. 3a,c are fitted with a function given by the sum of the following elements: a Gaussian for the D0 → Kπ signal, an exponential for the background, a shape determined by Monte Carlo simulations for the peak at 1620 MeV from 3-body decays of the D0 and by relativistic Breit-Wigner intensities for the K2∗(1430) and K3∗(1780). The latter K resonance is barely visible in this spectrum but shows up clearly in certain kinematic regions, see below.
The Kπ spectra are remarkably well described fitting them with 12 parameters, as described above. Figs. 3b,d show the spectra after subtraction of the exponential background. From the fits one obtains (3610 ± 90) D∗+→ (K−π+)πs+ and (4530 ± 100) D∗−→ (K+π−)πs−for the tagged sample as well as
(15200 ± 800) D0→ K−π+and (18400 ± 900) ¯D0→ K+π−for the untagged D0sample.
The dependence on kinematic variables of the production rate of D0 and D∗, together with those of the neighbouring K2∗(1430) resonance and the background, is extracted by fitting the mass spectra for each kinematic bin. Alternatively, the signal distributions of the D0 and the D∗ are obtained by side-band subtraction.
Using the first method, the fit yields in every bin of a given kinematic variable the number of D, K2∗(1430) and K3∗(1780) together with the background. In Figs. 5a-f examples of the Kπ invariant mass spectra for different intervals in z are shown before and after the subtraction of the fitted exponential background. These fits did not include the K3∗(1780). The fitting method allows monitoring of all details of the fit, as illustrated in the inserts of Fig. 5. The broad structure showing up for z > 0.75 in Fig. 5 is attributed to the K3∗(1780) resonance. This resonance follows the same behaviour as the K2∗(1430) resonance, i.e. it is produced at larger values of z than the D0(see sec. 5). The introduction of the K3∗(1780) resonance in the final fit also removed a small but statistically significant and unexplained discrepancy between fit and data on the left side of the D0→ Kπ peak in the z-integrated spectrum, where the fit before the inclusion of the K3∗(1780) was systematically below the data (see Fig. 5g to be compared with Fig. 3b, where the K3∗(1780) has been included).
The second method for signal extraction is the standard side-band subtraction. This method can only be applied to the D0and the D∗signals, due to the limited mass range (±700 MeV around the nominal D0 mass). Three Kπ mass windows are chosen. The central one, which is 100 MeV wide and centered at the nominal D0mass, contains the D0→ Kπ signal plus background. The two side-bands contain only background events. They are 50 MeV wide and centered at ±100 MeV above or below the nominal D0 mass. Thus three independent distributions are obtained as a function of each kinematic variable. The sum of the band distributions is subtracted from the central distribution, assuming that the side-band distributions correctly represent the distribution of background under the signal. This assumption is supported by the observed similar behaviour of the distributions in the two side-bands.
Usually, the background below the signal is obtained by linear interpolation between the side-bands. Such a linear interpolation overestimates the background under the signal. Therefore it cannot be applied for the untagged D0sample, where S/B ∼ 1/10. Instead, an estimate of the background under the signal is obtained from the fit. The total number of background events in the two side-bands is correspondingly rescaled.
For the chosen width of the central window, about 5% of the signal is found outside. Hence the number of signal events obtained by side-band subtraction is expected to be lower by 5% than that obtained with the signal fitting method.
10 4 METHOD OF SIGNAL EXTRACTION M(Kπ) (GeV) 1500 2000 2500 Events 0 10000 20000 30000 40000 (1430) * 2 K D0 0.45 < z < 0.50 1200 1400 1600 1800 2000 2200 2400 2600 0 1000 2000 3000 4000 5000 M(Kπ) (GeV) 1500 2000 2500 Events 0 10000 20000 30000 (1430) * 2 K D0 0.55 < z < 0.60 1200 1400 1600 1800 2000 2200 2400 2600 0 1000 2000 3000 4000 5000 M(Kπ) (GeV) 1500 2000 2500 Events 0 5000 10000 15000 (1430) * 2 K D0 0.65 < z < 0.70 1200 1400 1600 1800 2000 2200 2400 2600 0 500 1000 1500 2000 2500 3000 3500 4000 4500 M(Kπ) (GeV) 1500 2000 2500 Events 0 2000 4000 6000 8000 10000 (1430) * 2 K D0 0.75 < z < 0.80 1200 1400 1600 1800 2000 2200 2400 2600 0 500 1000 1500 2000 2500 3000 M(Kπ) (GeV) 1500 2000 2500 Events 0 1000 2000 3000 4000 5000 (1430) * 2 K D0 0.85 < z < 0.90 1200 1400 1600 1800 2000 2200 2400 2600 -200 0 200 400 600 800 1000 1200 1400 1600 M(Kπ) (GeV) 1500 2000 2500 Events 0 2000 4000 6000 (1430) * 2 K D0 0.95 < z < 1.00 1200 1400 1600 1800 2000 2200 2400 2600 -500 0 500 1000 1500 (a) (d) (c) (b) (f) (e) M(Kπ) (GeV) 1500 2000 2500 40 20 ×103 (g) Events
Fig. 5: a–f) Invariant Kπ mass spectra in bins of the energy fraction z for the untagged D0 sample. The vertical (red) lines indicate the nominal positions of K2∗(1430) and D0. The inserts demonstrate
the signal behaviour after the removal of the fitted exponential background. The fit contains D0→ Kπ at 1865 MeV, D0→ Kππ0 at 1620 MeV, the K∗
2(1430) and an exponential background. g) shows the
signal behaviour after removal of the fitted exponential background for the entire z range (no K3∗(1780) assumed). This figure has to be compared with Fig. 3b where the K3∗(1780) was included in the fit.
5 Comparison of kinematic distributions
In this section, event distributions are shown as a function of the relevant kinematic parameters, for both the tagged and untagged D0 samples as well as for the K2∗(1430) and background. The data collected in 2002-2006 are used, and the distributions are not corrected for acceptance. However, the geometric acceptances for the various compared Kπ systems are similar.
The distributions of the K2∗(1430) signal are obtained from the untagged D0 sample using the signal fitting method. The distributions of the Kπ-background combinations are extracted from the two Kπ side bands of the tagged D0 sample, at invariant masses of 1765 ± 50 and 1965 ± 50 MeV. The kinematic distributions of D0 and D∗ are obtained by applying both signal extraction methods described above, allowing to cross-check the stability of the result. While for the tagged D0 sample perfect agreement is found between the two methods, for the untagged sample some disagreement beyond the statistical error is observed, for instance at low values of z or low Kπ energy E. This is the result of strongly varying background shapes with additional broad resonances emerging below the K2∗(1430). The corresponding data points for D0 and K2∗(1430) are omitted, since a more complex background description would be needed.
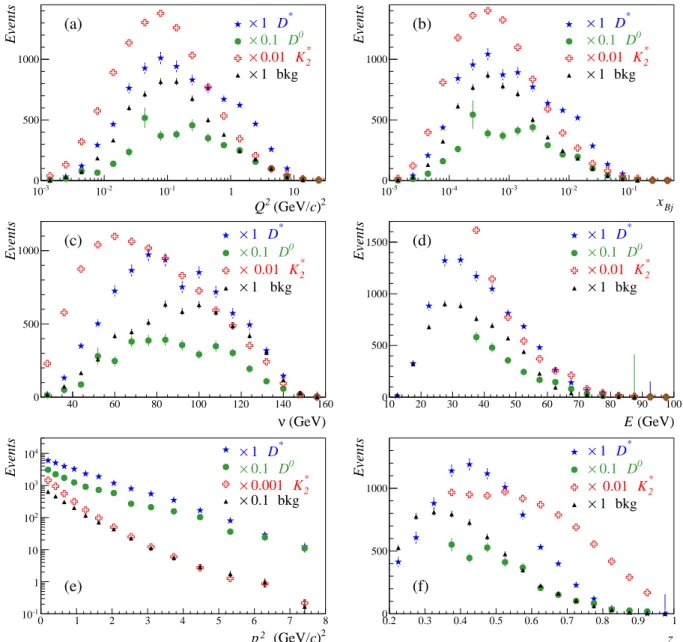
In Fig. 6, the distributions of the D0, the K2∗(1430) and the background under the D0 are compared,
showing their different behaviour. The distributions as a function of the inclusive variables Q2 and xB j
are displayed in Figs. 6a,b. For the tagged sample, the average values of Q2 and xB j extracted from
these distributions are about 0.5 (GeV/c)2 and 0.005, respectively. Some differences between signal and background events are observed at large values of Q2and xB j. As a function of ν, the distributions
for the various Kπ systems are significantly different (see Fig. 6c). The K2∗(1430) distribution peaks at lower values than that of D0, and the rise at low ν that is caused by the increase of both acceptance and cross-section starts at lower ν. The background peaks at a somewhat higher values, but has a similar rise with ν as D0and D∗.
No clear differences are observed between the distributions as a function of the Kπ energy E (see Fig. 6d). Given the reason described above, the K2∗(1430) and the D0data points at lower values of E are omitted from the untagged sample. The distribution for the D∗ signal as a function of p2T (Fig. 6e) shows an almost single-exponential decrease, while the distribution for the D0 flattens above 3 (GeV/c)2. The difference between D0 and D∗may be related to the fact that for the D∗only the p2T of the 2-body sub-system is shown. Both distributions are significantly different from those of background and K2∗(1430). From a fit of an exponential function up to p2T= 2(GeV/c)2, the following slopes are obtained in units
of (GeV/c)−2: −0.84 ± 0.03 for D∗, −0.96 ± 0.06 for D0, −1.94 ± 0.01 for K2∗(1430) and −1.69 ± 0.01 for background. The distributions in z show significant differences, too. The background is concen-trated at smaller values of z than the D0 signal. Moreover, the distribution of the K2∗(1430) is peaked at significantly higher values of z than that of the D0.
In conclusion of the comparison: remarkable differences are observed between the distributions of the D meson signals, the K2∗(1430), and the background as a function of the kinematic variables ν, pT and z.
This clearly points to different production mechanisms for D mesons and the K2∗(1430). The observed differences between D mesons and K2∗(1430) agree qualitatively with the differences expected if the D mesons result from the fragmentation of a pair of charm quarks and the K2∗(1430) from the fragmentation of a quark knocked out in a leading order process.
The interpretation of the kinematic distributions of the background is more complex, since this back-ground is dominated by combinatorial entries. No attempt is made to interpret it. However, one should mention that other background events of non-combinatorial origin (e.g. in the untagged sample the back-ground taken from side bands has also large contributions from resonances or from πK correlated pro-duction in the fragmentation) have been observed to behave very similar to the background shown in Fig. 6.
12 6 ACCEPTANCE AND INTEGRATED LUMINOSITY 2 ) c (GeV/ 2 Q -3 10 -2 10 -1 10 1 10 Events 0 500 1000 * D 1 × 0 D 0.1 × * 2 K 0.01 × bkg 1 × (a) Bj x -5 10 -4 10 -3 10 -2 10 -1 10 Events 0 500 1000 * D 1 × 0 D 0.1 × * 2 K 0.01 × bkg 1 × (b) (GeV) ν 40 60 80 100 120 140 160 Events 0 500 1000 * D 1 × 0 D 0.1 × * 2 K 0.01 × bkg 1 × (c) (GeV) E 10 20 30 40 50 60 70 80 90 100 Events 0 500 1000 1500 * D 1 × 0 D 0.1 × * 2 K 0.01 × bkg 1 × (d) 2 ) c (GeV/ 2 T p 0 1 2 3 4 5 6 7 8 Events -1 10 1 10 2 10 3 10 4 10 ×1 D* 0 D 0.1 × * 2 K 0.001 × bkg 0.1 × (e) z 0.2 0.3 0.4 0.5 0.6 0.7 0.8 0.9 1 Events 0 500 1000 * D 1 × 0 D 0.1 × * 2 K 0.01 × bkg 1 × (f)
Fig. 6: Measured kinematic distributions of various (Kπ) systems before acceptance correction as a function of (a) Q2, (b) xB j, (c) ν, (d) E, (e) p2T, and (f) z. The symbols D0 and K2∗ denote D0 and
K2∗(1430) from the untagged sample. The symbols D∗and bkg denote D∗and background from the two side-band windows for the D∗sample. The data are from the years 2002 to 2006.
6 Acceptance and integrated luminosity
Acceptances and integrated luminosity, which are needed to extract semi-inclusive total and differential cross-sections, are calculated only for the tagged D0 sample of the year 2004. Since this is the first detailed acceptance calculation for this particular final state at COMPASS, the present section also aims at illustrating the acceptances of the COMPASS spectrometer for the detection of the scattered muon and the D∗±. For this reason, 2-dimensional acceptances will be shown as a function of selected variables. Acceptance calculations are done using a complete Monte Carlo simulation of the detector configuration, including the triggers and the track reconstruction code for the 2004 data. Events are generated using AROMA 2.2.4 [10], which assumes photon-gluon fusion into c ¯cto be the dominant underlying mecha-nism for D∗production. Default fragmentation functions are used and parton showers are generated. The charm quark mass is set to 1.35 GeV. Produced D∗s are forced to decay to D0π+→ K−π+π+for D∗+or to ¯D0π−→ K+π−π−for D∗−. Trigger conditions and data selection criteria applied to the Monte Carlo
Bj x -4 10 10-3 10-2 10-1 1 y 0 0.2 0.4 0.6 0.8 1 0 5000 10000 15000 20000 (a) ) c (GeV/ p 0 1 2 3 4 5 (GeV) E 0 50 100 150 0 50 100 3 10 × (b)
Fig. 7: Number of generated (AROMA) events as a function of (a) xB jand y and (b) p⊥and E.
Bj x -4 10 10-3 10-2 10-1 1 y 0 0.2 0.4 0.6 0.8 1 0 0.2 0.4 0.6 0.8 1 (a) Bj x -4 10 10-3 10-2 10-1 1 y 0 0.2 0.4 0.6 0.8 1 0 0.02 0.04 0.06 0.08 0.1 (b)
Fig. 8: (a) ’Inclusive’ acceptance Aµ(xB j, y) and (b) overall acceptance AD∗(xB j, y) before applying the E
cut.
events are the same as for real data. In total, 107events were generated for both decays. The acceptances are calculated as a function of the reconstructed values of the kinematic variables, thus accounting for experimental resolution and bin-to-bin smearing.
Figure 7 shows the number of generated events (a) as a function of xB j, y and (b) as a function of p⊥, E
of the D meson. The transverse momentum p⊥is measured with respect to the direction of the incoming
muon beam. In both pictures the generated events are mainly concentrated in the lower left corner. For illustration, the acceptance for D∗ production is shown at two stages, i.e. after requiring the recon-struction of the scattered muon and after the additional reconrecon-struction of the three hadrons from the D∗ decay. The ‘inclusive’ acceptance Aµ(xB j, y) is shown in Fig. 8a, and the overall acceptance AD∗(xB j, y)
in Fig. 8b. In the kinematic region relevant for charm production, the inclusive acceptance Aµ(xB j, y)
is fairly homogeneous and ranges between 50% and 80%. The overall acceptance AD∗(xB j, y) is also
homogeneous for y > 0.2 and ranges from 1% to 5%. The cut-off at y = 0.2 is due to the momentum selection for the RICH identification.
The overall acceptance AD∗ as a function of E and p⊥ (i.e. transverse momentum with respect the
in-coming muon) is shown in Fig. 9. The upper limit of about 100 mrad for the spectrometer acceptance in the year 2004 can be seen at low energy and large p⊥. For 20 GeV < E < 80 GeV the acceptance
ranges between 5% and 13%. Outside this energy region the acceptance drops to zero due to the lack of particle identification and therefore 20 GeV < E < 80 GeV is required in the further analysis. The one-dimensional acceptances used below to determine the differential inclusive cross-sections are limited to this range of D0energies.
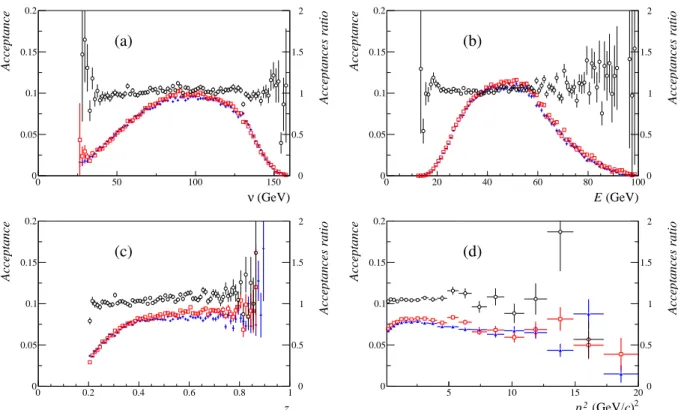
The one-dimensional acceptance functions AD∗+ and AD∗− are shown in Fig. 10 as a function of ν, E, z
and p2T. In addition, the ratio of the D∗+acceptance over that of D∗− is shown in each case. Note that
14 6 ACCEPTANCE AND INTEGRATED LUMINOSITY ) c (GeV/ p 0 1 2 3 4 (GeV) E 20 40 60 80 100 0 0.02 0.04 0.06 0.08 0.1 0.12 0.14
Fig. 9: Overall acceptance AD∗(p⊥, E)
(GeV) ν 0 50 100 150 Acceptance 0 0.05 0.1 0.15 0.2 Acceptances ratio 0 0.5 1 1.5 2 (a) (GeV) E 0 20 40 60 80 100 Acceptance 0 0.05 0.1 0.15 0.2 Acceptances ratio 0 0.5 1 1.5 2 (b) z 0 0.2 0.4 0.6 0.8 1 Acceptance 0 0.05 0.1 0.15 0.2 Acceptances ratio 0 0.5 1 1.5 2 (c) 2 ) c (GeV/ 2 T p 5 10 15 20 Acceptance 0 0.05 0.1 0.15 0.2 Acceptances ratio 0 0.5 1 1.5 2 (d)
Fig. 10: One-dimensional acceptances for D∗± production as a function of (a) ν, (b) E, (c) z and (d) p2T. Red boxes correspond to D∗+, blue triangles to D∗− events. The black circles show the ratio of acceptances AD∗+/AD∗−, the ordinates for the ratios are drawn on the right-hand side of the figures.
and D∗−, with the acceptance for D∗+being slightly higher than that for D∗−.
The integrated luminosity L is determined by a comparison of the measured number of inclusive in-elastic muon scattering events with the best available measurement of the corresponding cross-section. The differential number of events is the product of integrated luminosity, inclusive muon acceptance and inclusive differential cross-section:
d2N(xB j, y) dxB jdy =L · Aµ(xB j, y) · d2σµ N→µ 0X (xB j, y) dxB j dy . (1)
The inclusive inelastic muon-deuteron cross-section was measured by the NMC Collaboration for various muon energies between 90 and 280 GeV and published as a parameterization of the structure function F2[26]. Thus the cross-section has to be reconstructed based on this F2parameterization. The measured
cross-section is connected with the one-photon exchange cross-section via a radiative correction factor η (xB j, y): d2σµ N→µ 0X (xB j, y) dxB jdy = 1 η (xB j, y) d2σ1γ(xB j, y) dxB jdy . (2)
The one-photon exchange cross-section is connected with F2by :
d2σ1γ(xB j, y) dxB j dy =4π(α ¯hc) 2 xB jyQ2 1 − y − Q 2 4E2 µ +(1 − 2m 2/Q2)(y2+ Q2/E2 µ) 2(1 + R(xB j, Q2)) ! F2(xB j, Q2) , (3)
where m is the muon mass. The factor R(xB j, Q2) is the cross-section ratio for longitudinal over transverse
photons:
R(xB j, Q2) =
σL
σT
. (4)
The radiative correction factor η(xB j, y) is calculated with codes based on [27]. The ratios R(xB j, Q2) are
determined as in Ref. [28]. Given the light material composing the target (Li, D and He), nuclear effects have been neglected.
The integrated luminosity is determined in bins of (xB j, y) as:
L = 1 Aµ(xB j, y) · d 2N(x B j, y)/(dxB jdy) d2σµ N→µ0X(x B j, y)/(dxB j dy) . (5)
The integrated luminosity on the left-hand side of Eq. 5 has to be constant, while all terms on the right-hand side depend on xB jand y. As a side product of extracting the integrated luminosity, this equation can
be used to evaluate the uncertainty of the muon acceptance calculation for Q2 values larger than about 0.6 (GeV/c)2, where the NMC parameterization is valid. The values ofL obtained for different (xB j, y)
bins vary indeed by up to 20% over the relevant (xB j, y) range, so that an overall systematic uncertainty
of 20% is attributed to the product of integrated luminosity and inclusive muon acceptance. The average value of the integrated luminosity is calculated as a weighted mean of the luminosities determined in (xB j, y) bins, using the data at Q2> 0.6 (GeV/c)2. For a given bin the weight is the number of events in
that bin. The result for the integrated luminosity of the 2004 data is 0.71 ± 0.14 fb−1. Since the statistical uncertainty is negligible, only the systematic one is quoted.
7 D∗±production cross-sections
The acceptance uncorrected distributions presented in Sec. 5 were given for all data taken in 2002-2006. The signals for D0 and ¯D0were summed up, and so were those for D∗+ and D∗−. In the following, the semi-inclusive differential cross-sections for D∗± production, determined for data from the year 2004 only, will be obtained separately for D∗+ and D∗−. The acceptances, the integrated luminosity and the known branching ratio (2.6%) of D∗ to Kππ are taken into account. At the end of this section, D∗+ and D∗− asymmetries will be shown for all 2002 to 2006 data, since integrated luminosity and also the acceptances cancel in these asymmetries to a good approximation.
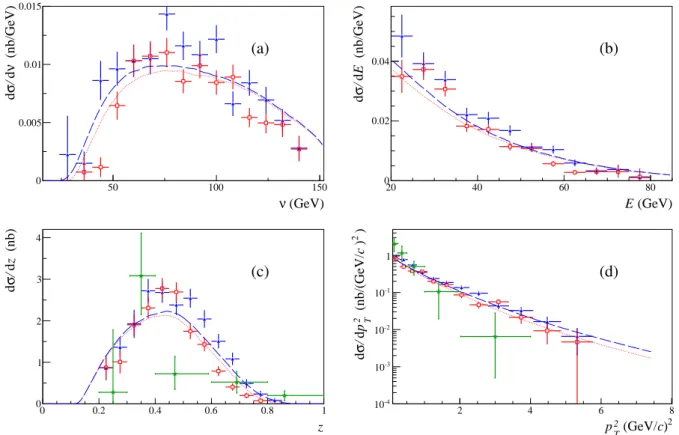
Figure 11 displays the semi-inclusive differential cross-sections of D∗+and D∗− events as a function of ν , E, z and p2T. The numerical values of the measured differential cross-sections are compiled in Table 1. These cross-sections are compared with the theoretical predictions obtained from the AROMA generator, which assumes c ¯cproduction via photon gluon fusion and includes parton showers. The AROMA total cross-section is rescaled to the value of 1.9 nb measured by COMPASS, see below. They were calculated
16 7 D∗±PRODUCTION CROSS-SECTIONS (GeV) ν 50 100 150 (nb/GeV) ν d / σ d 0 0.005 0.01 0.015 (a) (GeV) E 20 40 60 80 (nb/GeV) E d / σ d 0 0.02 0.04 (b) z 0 0.2 0.4 0.6 0.8 1 (nb) z d / σ d 0 1 2 3 4 (c) 2 ) c (GeV/ 2 T p 2 4 6 8 ) 2 ) c (nb/(GeV/ 2 T p d / σ d -4 10 -3 10 -2 10 -1 10 1 (d)
Fig. 11: Semi-inclusive differential cross-sections for D∗+and D∗−production as a function of (a) virtual photon energy ν, (b) D0energy E, (c) fractional energy z and (d) squared transverse momentum p2T. For
all distributions, the red squares correspond to D∗+and blue triangles to D∗−events (2004 data, D∗ sam-ple). The green circles are semi-inclusive differential cross-sections for D0from the EMC experiment, see text. The curves represent AROMA predictions, dashed for D∗− and dotted for D∗+.
using the same program package parameters as those for the determination of acceptances. The p2T and z distributions are also compared with results published by the EMC Collaboration 20 years ago [21], based on 92 events, obtained with higher muon beam energy and a cut on Q2> 3 (GeV/c)2. EMC combined ¯D0and D0as within the statistical precision no differences were observed. In order to compare with the present data, their measured values and uncertainties are divided by a factor of 2.
Good agreement is observed between the shapes of the measured distributions and the corresponding AROMA predictions. The distributions of D∗+ and D∗−as a function of ν show that the points for D∗− are systematically higher than those for D∗+. The effective threshold of D∗+appears to be about 10 GeV higher than that of D∗−. The AROMA generator produces also somewhat more D∗− than D∗+ but the differences at threshold are far less pronounced. A similar feature can be observed for the z distribution. In the large-z region, that has a large contribution from low-ν events, the cross-section of D∗−becomes significantly larger than that of D∗+. The AROMA calculations predicts more D∗−than D∗+as well, but the size of the effect is smaller. For the semi-inclusive differential cross-sections as a function of E and p2T, no remarkable differences are observed between the shapes of the distributions of D∗+ and D∗−. The total cross-sections for D∗+, D∗−and D∗±production are extracted by integration of the differential ones. The differences between the results from the integration over ν, E, z and p2T (see Table 1) are
used to evaluate the systematic uncertainty of acceptance corrections. Using the RMS of the four results (from ν, E, z and p2T) one obtains a systematic contribution of 0.05 for both D∗+and D∗− and 0.10 for the sum D∗±, i.e. at the level of the statistical uncertainty. In the ratio of D∗+over D∗− the acceptances almost cancels. The values of the ratio vary between 0.77 and 0.81, with an average of 0.80 and a RMS of < 0.02, i.e. two to three times smaller than the statistical uncertainty of ∼ 0.05.
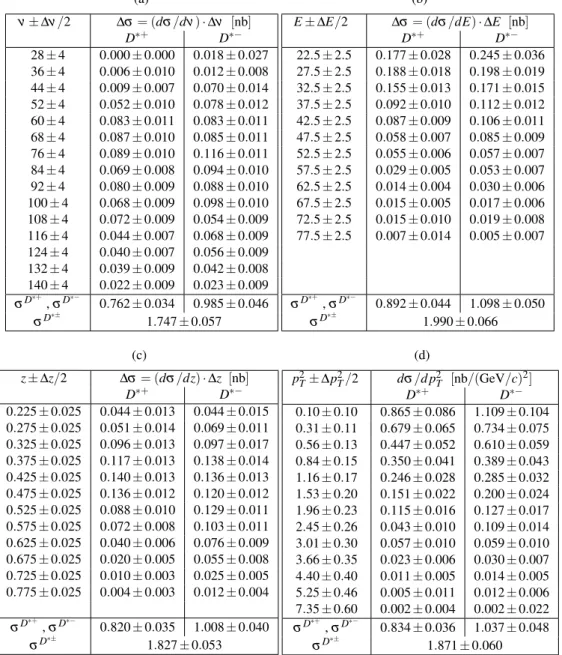
Table 1: Semi-inclusive differential cross-sections for D∗+ and D∗− production as a function of (a) γ∗ energy ν, (b) D0 energy E, (c) fractional energy z and (d) squared transverse momentum p2T of the D0. The central values and bin sizes of ν and E are given in units of GeV, those of p2T in (GeV/c)2. The last
two lines show the integrated cross-sections. Statistical uncertainties are given. (a) ν ± ∆ν /2 ∆σ = (dσ /dν ) · ∆ν [nb] D∗+ D∗− 28 ± 4 0.000 ± 0.000 0.018 ± 0.027 36 ± 4 0.006 ± 0.010 0.012 ± 0.008 44 ± 4 0.009 ± 0.007 0.070 ± 0.014 52 ± 4 0.052 ± 0.010 0.078 ± 0.012 60 ± 4 0.083 ± 0.011 0.083 ± 0.011 68 ± 4 0.087 ± 0.010 0.085 ± 0.011 76 ± 4 0.089 ± 0.010 0.116 ± 0.011 84 ± 4 0.069 ± 0.008 0.094 ± 0.010 92 ± 4 0.080 ± 0.009 0.088 ± 0.010 100 ± 4 0.068 ± 0.009 0.098 ± 0.010 108 ± 4 0.072 ± 0.009 0.054 ± 0.009 116 ± 4 0.044 ± 0.007 0.068 ± 0.009 124 ± 4 0.040 ± 0.007 0.056 ± 0.009 132 ± 4 0.039 ± 0.009 0.042 ± 0.008 140 ± 4 0.022 ± 0.009 0.023 ± 0.009 σD∗+, σD∗− 0.762 ± 0.034 0.985 ± 0.046 σD ∗± 1.747 ± 0.057 (b)
E± ∆E/2 ∆σ = (dσ /dE) · ∆E [nb]
D∗+ D∗− 22.5 ± 2.5 0.177 ± 0.028 0.245 ± 0.036 27.5 ± 2.5 0.188 ± 0.018 0.198 ± 0.019 32.5 ± 2.5 0.155 ± 0.013 0.171 ± 0.015 37.5 ± 2.5 0.092 ± 0.010 0.112 ± 0.012 42.5 ± 2.5 0.087 ± 0.009 0.106 ± 0.011 47.5 ± 2.5 0.058 ± 0.007 0.085 ± 0.009 52.5 ± 2.5 0.055 ± 0.006 0.057 ± 0.007 57.5 ± 2.5 0.029 ± 0.005 0.053 ± 0.007 62.5 ± 2.5 0.014 ± 0.004 0.030 ± 0.006 67.5 ± 2.5 0.015 ± 0.005 0.017 ± 0.006 72.5 ± 2.5 0.015 ± 0.010 0.019 ± 0.008 77.5 ± 2.5 0.007 ± 0.014 0.005 ± 0.007 σD∗+, σD∗− 0.892 ± 0.044 1.098 ± 0.050 σD ∗± 1.990 ± 0.066 (c) z± ∆z/2 ∆σ = (dσ /dz) · ∆z [nb] D∗+ D∗− 0.225 ± 0.025 0.044 ± 0.013 0.044 ± 0.015 0.275 ± 0.025 0.051 ± 0.014 0.069 ± 0.011 0.325 ± 0.025 0.096 ± 0.013 0.097 ± 0.017 0.375 ± 0.025 0.117 ± 0.013 0.138 ± 0.014 0.425 ± 0.025 0.140 ± 0.013 0.136 ± 0.013 0.475 ± 0.025 0.136 ± 0.012 0.120 ± 0.012 0.525 ± 0.025 0.088 ± 0.010 0.129 ± 0.011 0.575 ± 0.025 0.072 ± 0.008 0.103 ± 0.011 0.625 ± 0.025 0.040 ± 0.006 0.076 ± 0.009 0.675 ± 0.025 0.020 ± 0.005 0.055 ± 0.008 0.725 ± 0.025 0.010 ± 0.003 0.025 ± 0.005 0.775 ± 0.025 0.004 ± 0.003 0.012 ± 0.004 σD ∗+ , σD∗− 0.820 ± 0.035 1.008 ± 0.040 σD ∗± 1.827 ± 0.053 (d) p2T± ∆p2 T/2 dσ /d p2T [nb/(GeV/c)2] D∗+ D∗− 0.10 ± 0.10 0.865 ± 0.086 1.109 ± 0.104 0.31 ± 0.11 0.679 ± 0.065 0.734 ± 0.075 0.56 ± 0.13 0.447 ± 0.052 0.610 ± 0.059 0.84 ± 0.15 0.350 ± 0.041 0.389 ± 0.043 1.16 ± 0.17 0.246 ± 0.028 0.285 ± 0.032 1.53 ± 0.20 0.151 ± 0.022 0.200 ± 0.024 1.96 ± 0.23 0.115 ± 0.016 0.127 ± 0.017 2.45 ± 0.26 0.043 ± 0.010 0.109 ± 0.014 3.01 ± 0.30 0.057 ± 0.010 0.059 ± 0.010 3.66 ± 0.35 0.023 ± 0.006 0.030 ± 0.007 4.40 ± 0.40 0.011 ± 0.005 0.014 ± 0.005 5.25 ± 0.46 0.005 ± 0.011 0.012 ± 0.006 7.35 ± 0.60 0.002 ± 0.004 0.002 ± 0.022 σD∗+, σD∗− 0.834 ± 0.036 1.037 ± 0.048 σD∗± 1.871 ± 0.060
The final result for the D∗meson production cross-section is then σ (µN → µ0D∗±X) = 1.86±0.06 (stat)± 0.10 (sys) ± 0.37 (luminosity) nb. The only cut applied is the energy window for the D0meson between 20 GeV < E < 80 GeV in the laboratory frame, corresponding to 22 GeV < E < 86 GeV for the D∗ energy.
For charm-anticharm production, AROMA gives a cross-section of 7.2 nb with 1.35 GeV chosen as the default charm quark mass. Using the common assumption of 0.6 D∗ mesons per charm event and accounting for the energy cut 20 GeV < E < 80 GeV, which reduces the number of charm Monte Carlo events by another factor of 0.6, the corresponding AROMA cross-section predicted for COMPASS is 2.6 nb. Given the number of assumptions which underlie the AROMA default options (charm quark mass, fragmentation, no radiative corrections, leading order QCD apart from parton showers) the agreement with the above experimental result is considered to be good.
18 7 D∗±PRODUCTION CROSS-SECTIONS (GeV) ν 40 60 80 100 120 140 Asymmetry -1 -0.5 0 0.5 1 Data Aroma (a) (GeV) E 10 20 30 40 50 60 70 80 Asymmetry -1 -0.5 0 0.5 1 Data Aroma (b) z 0.2 0.3 0.4 0.5 0.6 0.7 0.8 0.9 Asymmetry -1 -0.5 0 0.5 1 Data Aroma (c) 2 ) c (GeV/ 2 T p 0 1 2 3 4 5 6 7 8 Asymmetry -1 -0.5 0 0.5 1 Data Aroma (d)
Fig. 12: Measured D∗+and D∗−asymmetries for data (blue stars) and AROMA generator (red crosses) events as a function of X = ν, E, z and p2T (coloured online). All 2002-2006 data are used.
However, deviations from the AROMA predictions are observed in the data with respect to D∗+ and D∗−production. These may provide valuable insight into their production mechanisms. In a simple LO approach, assuming photon-gluon fusion with independent fragmentation of the charm and anti-charm quarks to be the relevant production mechanism, no differences should be observed between D∗+ and D∗−. Differences may occur for all processes where the quark content of the target nucleon matters. The quark content of D∗mesons indicate that only D∗−may contain a valence quark from the target nucleon. Furthermore, instead of fragmenting into D∗+the c quark, together with a diquark of the target nucleon, can hadronize into a charmed baryon, leading to associated production of e.g. D∗−Λc. Thus the D∗−may
result from a valence quark and/or associated production. If parton showers are included in AROMA the flavour dependent quark distribution functions of the nucleon come into play. Processes like associated production of D∗−Λc lead to differences between kinematic distributions of D∗+ and D∗−. The same
happens for processes where an initial quark in the nucleon absorbs the virtual photon and radiates a heavy gluon which then decays to c ¯c, or where in the course of fragmentation the ¯c quark picks up quarks from the nucleon.
In order to provide statistically more precise information on the potentially interesting differences be-tween D∗+ and D∗− production, Fig. 12 shows particle-antiparticle asymmetries of the semi-inclusive cross-sections, A(X ) =dσ D∗+(X ) − dσD∗−(X ) dσD∗+ (X ) + dσD∗− (X ) (6)
as a function of X = ν, E, z and p2T for both the D∗ sample and Monte Carlo events generated by
AROMA. Here the full statistics of the years 2002-2006 is used. It is assumed that the acceptances for the two charge combinations are equal. In the previous section it was shown that for the year 2004 this is indeed approximately true. The numerical values of the measured asymmetries are given in Table 2, where only statistical uncertainties are shown, based on the assumption that acceptance cancels. A small
Table 2: Measured asymmetry A(X ) as a function of X = ν, E, z and p2T. The central values and bin
sizes of ν and E in (a) and (b) are given in units of GeV, those of p2T in (d) in units of (GeV/c)2. (a) ν ± ∆ν /2 A(ν) 28 ± 4 −0.130 ± 0.415 36 ± 4 −0.610 ± 0.098 44 ± 4 −0.272 ± 0.082 52 ± 4 −0.207 ± 0.059 60 ± 4 −0.032 ± 0.051 68 ± 4 −0.174 ± 0.047 76 ± 4 −0.123 ± 0.044 84 ± 4 −0.078 ± 0.046 92 ± 4 −0.116 ± 0.053 100 ± 4 −0.109 ± 0.048 108 ± 4 −0.027 ± 0.057 116 ± 4 −0.108 ± 0.060 124 ± 4 −0.090 ± 0.068 132 ± 4 −0.018 ± 0.084 140 ± 4 +0.016 ± 0.119 148 ± 4 −0.215 ± 0.420 (b) E± ∆E/2 A(E) 12.5 ± 2.5 −0.263 ± 0.333 17.5 ± 2.5 −0.099 ± 0.092 22.5 ± 2.5 −0.149 ± 0.051 27.5 ± 2.5 −0.034 ± 0.041 32.5 ± 2.5 −0.045 ± 0.039 37.5 ± 2.5 −0.038 ± 0.042 42.5 ± 2.5 −0.148 ± 0.043 47.5 ± 2.5 −0.139 ± 0.049 52.5 ± 2.5 −0.159 ± 0.050 57.5 ± 2.5 −0.203 ± 0.057 62.5 ± 2.5 −0.180 ± 0.080 67.5 ± 2.5 −0.103 ± 0.109 72.5 ± 2.5 −0.235 ± 0.185 77.5 ± 2.5 +0.074 ± 0.231 82.5 ± 2.5 +0.593 ± 0.604 87.5 ± 2.5 +0.288 ± 2.146 (c) z± ∆z/2 A(z) 0.225 ± 0.025 −0.090 ± 0.082 0.275 ± 0.025 +0.042 ± 0.071 0.325 ± 0.025 +0.011 ± 0.052 0.375 ± 0.025 −0.054 ± 0.043 0.425 ± 0.025 +0.002 ± 0.041 0.475 ± 0.025 −0.068 ± 0.040 0.525 ± 0.025 −0.137 ± 0.041 0.575 ± 0.025 −0.223 ± 0.046 0.625 ± 0.025 −0.193 ± 0.052 0.675 ± 0.025 −0.260 ± 0.059 0.725 ± 0.025 −0.479 ± 0.078 0.775 ± 0.025 −0.609 ± 0.099 0.825 ± 0.025 −0.939 ± 0.213 0.875 ± 0.025 −0.926 ± 0.419 (d) p2T± ∆p2 T/2 A(p 2 T) 0.10 ± 0.10 −0.094 ± 0.046 0.31 ± 0.11 −0.105 ± 0.046 0.56 ± 0.13 −0.151 ± 0.045 0.84 ± 0.15 −0.082 ± 0.045 1.16 ± 0.17 −0.083 ± 0.045 1.53 ± 0.20 −0.076 ± 0.044 1.96 ± 0.23 −0.148 ± 0.049 2.45 ± 0.26 −0.192 ± 0.058 3.01 ± 0.30 −0.165 ± 0.061 3.66 ± 0.35 −0.124 ± 0.077 4.40 ± 0.40 −0.208 ± 0.105 5.25 ± 0.46 −0.253 ± 0.155 6.23 ± 0.52 +0.380 ± 0.266 7.35 ± 0.60 −0.520 ± 0.496
cross-section assymmetry between D+ and D− production has been observed recenlty in a different energy range by the LHCb experiment [29].
As one can see from the figure, the measured asymmetry decreases significantly stronger than that pre-dicted by AROMA when ν decreases below 40 GeV and/or when z increases above 0.6. The distributions shown as a function of ν clearly exhibit different thresholds for D∗+and D∗−production, which supports a stronger presence of mechanisms other than PGF with independent fragmentation. As a function of z, the most pronounced differences between D∗+and D∗−are seen at large values of z, whereas at z values lower than 0.5 the production rates are nearly equal. Values of z larger than 0.5 indicate an asymmetric sharing of the energies between a D meson and its associated partner with opposite charm content. Since the cross-section of D∗−, which contains a down and an anti-charm quark, increases with increasing z stronger than that of D∗+, this observation suggests processes where the anti-charm quark is fast and the charm-quark is slow. Here, a candidate process is again associated production of a D∗− along with a charmed baryon, i.e D∗− Λc. Alternatively, since the D∗− may also contain a valence quark of the
nucleon whereas the D∗+ does not, one may think of processes other than associated production, which involve valence quarks of the nucleon.
numer-20 REFERENCES
ous earlier experiments (see e.g. [22] for charm photoproduction and [30–36] for charm production by hadrons), although not as pronounced as in the present experiment that covers the region of virtual-photon energies from threshold up to 140 GeV.
8 Summary and conclusions
The observed total cross section of (1.9 ± 0.4) nb for the production of D∗+ and D∗− mesons in in-elastic muon nucleon interactions at 160 GeV incident muon energy within the COMPASS acceptance (20 GeV < E < 80 GeV and 22 GeV < E < 86 GeV, for D0and D∗respectively) lies within the range of values expected if the dominant process is photon-gluon fusion to open charm production. The total error is dominated by the uncertainty on the luminosity.
The detailed comparison of the measured differential cross sections of D∗ production as a function of the variables ν, E, z and p2T shows good agreement with those expected from the model underlying
the AROMA generator used to produce the theoretical distributions. This is remarkable as most of the kinematic distributions of D mesons are quite different in shape compared to those of the background and the neighbouring K2∗(1430) resonance.
The observed large asymmetries between D∗+and D∗−production for ν < 40 GeV and z > 0.6 can only partially be described by the model used in AROMA, which predicts differences of the same sign but of smaller magnitude. This indicates that the hadronization processes of charm and anti-charm quarks differ more significantly than expected or/and processes other than PGF contribute by a larger amount than assumed.
The observed dependences of these differences on the kinematic variables, in particular on the photon energy ν and the fractional energy z, suggest that associated production (e.g. DΛc) plays a dominant role
at low photon energy. Also, D∗− production involving valence quarks of the nucleon may contribute to the observed asymmetries between D∗+and D∗−production.
Acknowledgements
We gratefully acknowledge the support of the CERN management and staff and the skill and effort of the technicians of our collaborating institutes. Special thanks go to V. Anosov and V. Pesaro for their technical support during the installation and the running of this experiment. This work was made possible by the financial support of our funding agencies.
References
[1] A. D. Watson, Z. Phys. C 12 (1982) 123.
[2] W. W. Beenakker, H. Kuijf and W. L. van Neerven, Phys. Rev. D 40 (1989) 54.
[3] R. K. Ellis and P. Nason, Nucl. Phys. B 312 (1989) 551.
[4] J. Smith and W. L. van Neerven, Nucl. Phys. B 374 (1992) 36.
[5] S. Frixione et al., Nucl. Phys. B 412 (1994) 225.
[6] I. Bojak and M. Stratmann, Nucl. Phys. B 540 (1999) 345.
[7] S. Frixione and C. Oleari, Nucl. Phys. B 565 (2000) 245.
[8] S. Frixione et al., J. Phys. G 27 (2001) 1111.
[10] G. Ingelmann et al., Comput. Phys. Commun. 101 (1997) 135.
[11] S. J. Brodsky et al., Phys. Rev. Lett. 78 (1997) 4683.
[12] R. Vogt and S. J. Brodsky, Nucl. Phys. B. 478 (1996) 311.
[13] S. J. Brodsky, C. Peterson and N. Sakai, Phys. Rev. D 23 (1981) 2745.
[14] M. P. Rekalo and E. Tomasi-Gustafsson, Phys. Lett. B 541 (2002) 101.
[15] A. Capella and J. Tran Thanh Van, Phys. Lett. B 93 (1980) 146.
[16] NA14/2 Collaboration, M. P. Alvarez et al., Z. Phys. C 60 (1993) 53.
[17] A. Zvyagin, “D-meson production by muons in the COMPASS experiment at CERN”, Dissertation, Ludwig-Maximilian-University Munich, January, 2011.
[18] H1 Collaboration, F. D. Aaron et al., Phys. Lett. B 686 (2010) 91.
[19] ZEUS Collaboration, S. Chekanov et al., Nucl. Phys. B 729 (2005) 492.
[20] A. V. Lipatov and N. P. Zotov, Phys. Rev. D 75 (2007) 014028.
[21] EMC Collaboration, J. J. Aubert et al., Phys. Lett. B 167 (1986) 127.
[22] E687 Collaboration, P. L. Frabetti et al., Phys. Lett. B 370 (1996) 222.
[23] Tagged Photon Collaboration, J. C. Anjos et al., Phys. Rev. Lett. 65 (1990) no. 20, 2503.
[24] COMPASS Collaboration, P. Abbon et al., Nucl. Instr. Meth. A 577 (2007) 455.
[25] COMPASS Collaboration, C. Bernet et al., Nucl. Instr. Meth. A 550 (2005) 217.
[26] NMC Collaboration, M. Arneodo et al., Phys. Lett. B 364 (1995) 107.
[27] A. A. Akhundov, D. Y. Bardin, L. Kalinovskaya and T. Riemann, Fortschr. Phys. 44 (1996) 373.
[28] COMPASS Collaboration, E. Ageev et al., Phys. Lett. B 633 (2006) 25.
[29] LHCb Collaboration, R. Aaij et al., arXiv:1210.4112.
[30] SELEX Collaboration, M. Iori Nucl. Phys. B (Proc. Suppl.) 115 (2003) 103.
[31] SELEX Collaboration, M. Kaya et al., Phys. Lett. B 558 (2003) 34.
[32] WA82 Collaboration, M. I. Adamovich et al., Phys. Lett. B 305 (1993) 402.
[33] WA769 Collaboration, G. A. Alves et al., Phys. Rev. Lett. 72 (1994) 812.
[34] E791 Collaboration, E. M. Aitala et al., Phys. Lett. B 411 (1997) 230.
[35] WA89 Collaboration, M. I. Adamovich et al., Eur. Phys. J.C 13 (2000) 247.