HURLY-BURLY: AN EXPERIMENTAL FRAMEWORK FOR SOUND
BASED SOCIAL NETWORKING
João Cordeiro, Nicolas Makelberge
Research Center for Science and Technology of the Arts (CITAR)
Portuguese Catholic University - School of the Arts
Rua Diogo Botelho 1327, 4169-005 Porto, Portugal
{jcordeiro; nmakelberge}@porto.ucp.ptABSTRACT
This project deals with the topic of social interrelations; its aim is to achieve a deeper understanding of the underlying mechanisms of these relations through the use of sound and mobile devices/ubiquitous computing. The proposed framework follows two interdependent directions: 1) using environmental sounds as input data for context analysis, 2) using sound as an output to express results (sonification).
This project is part of a long-term research project concerning sound based social networks, conducted at the Research Centre for Science and Technology in Arts (CITAR). The aim of this paper is to share some initial results, both practical and conceptual in form of a related work overview on social networking technologies, a conceptual design for a Facebook® application based on the project initial idea
(including an IPhone® graphic interface proposal) and last but
not least, an experimental framework for data communication between an IPhone® and a computer (using Pure Data through
RjDj).
Keywords - ubiquitous computing, mobile devices, social networking, soundscape, virtual community, data visualization, sonification, field recording, sound classification, interface design, auditory scene analysis.
1. INTRODUCTION
The average person, normally operating on a casual listening mode [1], has an overall low awareness of his or her sonic milieu. It often takes a disruptive sound or one out of the ordinary to perceive and become conscious of changes in a personal soundscape. These disruptive sounds often owe their conspicuousness to their lack of reference to any visual cues which can be true both with sounds operating clearly out of context and/or because a sound source is out of one’s sight. Other forms of disruptive sounds include those that listeners dislike but are forced to live with, while not being completely unaware of its source (ex. a neighbor’s dog barking outside your window at 6 o’clock in the morning).
However, we as sound designers are more fully aware of our sound environment and subtle changes in it. We also are aware of its potential to convey information and portray not only places themselves but also specific situations. In cinema for example, any background noise often sets the sonic context
where actions are to take place, which in turn is many times manipulated to induce certain emotions in the spectator, often relating to narrative tensions in the script. Sound designers in general are very well aware of background sounds psychoacoustic possibilities, and are not afraid to explore its potential. The same meticulous attentiveness is not only suitable for sound design in cinema but also, as we have seen, for public health, marketing, architecture, urbanism, environmentalism, videogames, automobiles or product design etc.
As far as we know, soundscapes - as an integral element of social-network-building is still a quite unexplored area. Hence, we would like to investigate this same potential (as we see in all aforementioned examples) to characterize people’s auditory milieus. We see soundscapes as yet another untapped source, which could provide unforeseen, interesting and valuable information about a person’s life-style. Information, which we hope, may enrich and complement a social networkers profile.
The value added as we see it, is that by using sound as a tool within social networking, we not only allow for a new understanding of social interrelations within a group (a network) but also an different, yet efficient way for group awareness.
Beside the systems social function, it could also be applied as a research tool where one is enabled through the dissemination of such a technology to gather sound data on a wide scale. Researchers from various areas such as sound ecology, sociology, social geography could all benefit from this wealth of soundscape information to draw new conclusions concerning the constitution of various environments or sounds vis-à-vis other user variables such as location, age, gender, etc.
2. SOCIAL NETOWRKING AND SOUNDSCAPES It is difficult to conceive the subsistence and development of human society without the act of communication among its constituent parts, humans. Nowadays, this idea as been extrapolated to such a degree, that we use the term information society when referring to developed societies. A society only possible by the emergence of technological information networks (mainly CMC) that completely subverted time and space dimensions turning them to “immediacy” and “space fluxes”, respectively [2]. Computer mediated social networking could be said to be the byproduct of this technological development applied to the social interrelations realm. With this, new processes came forward to supply old needs on a wide
range of human activities, such as work, entertainment, love or knowledge.
“One cannot, for example, be friends with absolutely anybody. People are constrained by geography, socioeconomic status, technology, and even genes to have certain kinds of social relationships and to have a certain number of them. The key to understanding people is understanding the ties between them; (...)” [3].
By the annulment of time and space in computer mediated communications, relations between people in the network became easier to establish and easier to cease. Chat rooms took worldwide proportions and fake identities with stylish avatars circumvented embarrassing issues, like shyness or ugliness. All these issues seemed to promote the right context for the proliferation of social networks over the Internet, as one can verify on World Map of Social Networks (information on the map retrieved with Alexa & Google Trends for Websites traffic data) [4].
Users of social networks are normally invited to build a profile that others can see, sharing factual information (name, age, place of birth, look, etc.) and less-factual information (thoughts, convictions, whishes, moods, etc.) in order to build a virtual identity on the network. According to our research, the privileged type of information conveyed by each network will determine its character and, in some extent, the character of its users virtual community. Thus, a social network like Myspace, where users can easily upload music onto their profile page, tends to (not surprisingly) grow within a musical community made up of bands, producers and DJ’s. This same tendency, in general, can be seen among other social networks oriented towards all different types of relations, such as friendship, professional, artistic or touristic etc. These very same concerns are further developed in our research, although for now we will remain at the more practical questions concerning our project. As previously mentioned, our project privileges soundscape information rather then any other kind of information (including music and speech in a strict sense). Paradoxically, we don’t assume this network to be tailor-made exclusively for musician or sound designers (even if we believe these will interested) but for everyone engaged in social networking, especially those interested in friendship (on Myspace, for example, we observe a community not only formed by bands and musicians but also by their fans and friends).
We also recognize that sound is an integral part of people’s lives and might be somewhat overlooked in our image-preponderant society, which might warrant a method to rescue and update the concept of acoustic community postulated by Schafer [5].
“Community can be defined in many ways: as a political, geographical, religious or social entity. But I am about to propose that ideal community may also be defined advantageously along acoustic lines.”
To support the idea of acoustic community we suggest the creation of “acoustic link” throughout the users network
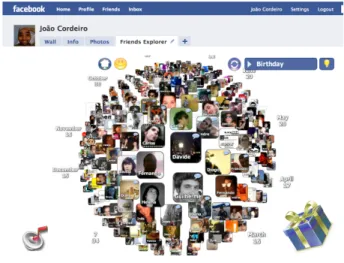
Figure 1 - GUI for Friends Explorer (visualization by birthday criterion).
connections, allowing the expansion of each user “acoustic space” beyond the inherently physical constraints.
3. RELATED WORK
The reduced size of this short paper is incompatible with the expected long and detailed description of a related work chapter. Thus, we will point out solely three examples, which we consider significant to our research for different but complementary reasons, as we explain later.
3.1. Friends Explorer
Friends Explorer is a Facebook application developed by Emonect (http://www.emonect.com/), which permits new visualizations and interactions within the user virtual community (Fig. 1), such as dynamic overview of all friends grouped by friends lists or other criterion (birthday, place of birth, actual place and alphabetic). Besides, this application is also designed for mobile devices interfaces, and pays special attention to usability issues like tactile navigation and scaling options.
This project is important to us once it also addresses network data visualization on mobile devices (though our regards auditory criteria).
3.2. FaceMic
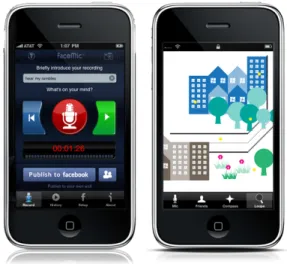
FaceMic is a Facebook application developed by Voicetal LLC (http://www.voicetal.com/), to post audio updates from anywhere directly to the user Facebook wall using iPhone or iPod Touch. Like Friends Explorer, a suitable interface design for mobile devices as been achieved, with a simple and intuitive GUI (Fig. 2 - left).
Our project shares some characteristics with this application, once they both intent to work with pre-existent computer mediated social networks and make use of audio recordings with mobile devices (namely IPhone).
Figure 2 – IPhone GUI: FaceMic (left); Hurly-Burly - proposal for a graphic visualization (right).
3.3. Out To Lunch
Out to Lunch is a software prototype developed by Johnatan Choen, that “attempted to foster this sense of group awareness by using background sounds and an electric signboard to inform physically dispersed or isolated groups members about each other’s presence” [6]. Succinctly, the software triggers background sounds (and visual sign) in each computer within a network, which relate to other users’ presence. Thus, it emulates the physical presence by means of visual and auditory displays.
This project has much to do with our research, once both look forward to achieve a group awareness feeling with the use of displaced sounds over a computer network.
4. DESIGN WORKFLOW FOR A FACEBOOK APPLICATION
As described above, the goal of the project is to establish a social network based on sound, more precisely on users sonic environments or soudscapes. Therefore, we propose to capture and analyze the sonic environment of each user on a daily base, and distribute the data over the network, as described further on.
4.1. Name
Hurly-Burly is a popular expression used to describe a noisy and boisterous activity. We chose this name given the sonic result reached by each user when manipulating the application. 4.2. Social Network Application Framework
As a starting point we need a social network connected by means of a software application (virtual community). This can be accomplished by several means: 1) by setting up a new social network from scratch - people would have to sign up and invite friends; 2) by setting up a new social network based on
contacts and profiles of an pre-exiting one; 3) by designing an application (app) for an existing software social network (like Facebook for example).
For now, we will assume the third method once it provides excellent starting conditions: 1) An established and well-known social community – users of Hurly-Burly could use their profiles and network community to run it; 2) Facebook policy encourages the development of new applications by external developers; 3) Facebook has a mobile platform.
However, we should note that by using Facebook as a platform is, yet, not a definitive option for Hurly-Burly framework. The perfect scenario would be an application suitable to be used with multiple social networks platforms as also as a standalone application (a new social network). 4.3. Device Framework
In order to serve the purpose of the project, mobile devices should be used to keep track on users daily moves. Beside mobility, this equipment should also live up to the following prerequisites: 1) Be part of users every day lives (non intrusive), 3) be able to compute data (ubiquity/pervasive computing), 4) be able to connect to the Internet, 5) be able to capture and convert audio to the digital domain, 6) have geo-reference capacity, 7) have a graphical display.
Despite these demanding specifications, most smartphones available nowadays in the market comply with these requisites. At this initial stage of the project, our choice falls to Apple IPhone which not only complies with all the requisites mentioned above but it’s also a best seller (therefore, more suitable as an ubiquitous device), it’s programmable, and its target market matches that which engages extensively in social networking.
Again, we assume that there may exist other devices that also fit the needs of the project, or even beat IPhone to the task. However, we will at this initial stage appoint the IPhone as the main hardware device of our experimental framework for now. Nonetheless, the tool should ideally not be exclusive, since the aim of the project is to reach an as broad audience as possible. Therefore, a cross-platform/cross-device application would ideally be desired.
4.4. Operation
Now that we covered the two main aspects of the system – social network application and device - we will explain how those two interrelate and how the proposed system works. Thereunto, we will describe the user experience:
First, the user A (our main user) should add the Hurly-Burly app to his Facebook page through the mobile device and be connected with friends (B, C and D) whom also are using both applications on mobile devices. User A’s IPhone will record small samples of audio (about 3 seconds) every time the sound environment significantly changes. This audio is then uploaded to a server to be automatically classified according to
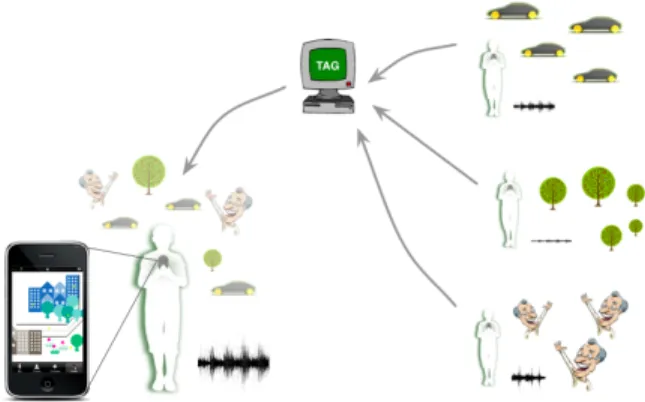
Figure 3: Data flow sonification (corresponds to the invisible status on regular instant messaging applications).
function and meaning (semiotics and semantics)1. We do know
that the further we get with sound classification, the more accurate the system will be. However we also believe that an accurate classification of few soundscape classes can, thus, provide important information (noisy environment vs quiet, musical vs non musical, human vs non human). The audio and the data resultant from classification are then distributed to all of his network connections.
4.5. Data Visualization
Once the entire network is connected and exchanging data, a map will be displayed on the IPhone of each user. This map is based (primarily) on the received audio classifications, rather than on the geographical data of the other users (geo-localization). Thus, the resulting map is a cartographic iconic visualization designed according to the different sound classes (ex. people, traffic, animals, music.). Each map is unique and represents the sum of friends’ soundscapes.
4.6. Auditory Display
The auditory display follows two different approaches (or modes): 1) soundscape composition and 2) sound mapping (sonification). Ideally, the user should be able to choose which one he prefers to use.
4.6.1. Soundscape composition
In this mode the collected data (audio) from each user is received by his/hers mobile device. The volume of each recording reproduction varies according to specific criteria such as geographic distance (from the user), friendship relevance (strong or weak connection) or network activity. The result is a mixture of background recordings.
1 Although we consider automatic classification a non-trivial
function, at this point we are not able to describe the technology implied, nor the adopted sound classification method.
Figure 4 – Framework using an IPhone and a Macbook.
4.6.2. Sound mapping (sonification)
Sound mapping mode represents a sonification of the graphical displayed data. The process consists in associating different sound classifications (retrieved from recordings) to sound sources (synthesized sound; sampled sounds) and manipulate them according to the same criteria used in soundscape mode. Through this process, each user can personalize his “friendship composition” by defining his own set of sounds, mappings and manipulations (sound processing, volume, synthesis parameters, etc.).
5. EXPERIMENTAL FRAMEWORK
In order to test some basic procedures regarding audio capture and data transmission with IPhone, we developed an experimental framework application using an IPhone, a Macbook, Pure Data (vanilla) software and RjDj platform. The framework includes two different patches: one sending data (running on IPhone trough a RjDj scene) another receiving and displaying (running on a Macbook computer). The patch responsible for sending data, analyzes sound input and classifies it as pitched or non-pitched (using fiddle~, an PD object by Miller Puckette).
This information is then sent to the computer via UDP protocol (using netsend), where the “receiver patch” displays (using GEM) a triangle or a square, accordingly. The test clarified preliminary uncertainties: IPhone supports basic audio analysis and data transmission (without significant latency for us) over Internet. The experiment took place during a RjDj sprint; no further improvements have been made to date.
6. FUTURE WORK
For the future, our goal is to implement this yet conceptual project and extend the underlying paradigm through geo-location to specific places, in addition to people.
7. ACKNOWLEDGMENT
Hurly-Burly concept was conceived during the workshop Interface Design for Mobile Applications that took place at the Future Places digital media festival, organized by Oporto University at October 2009. Ana Parada, João Cordeiro and Kateina Marková composed the group responsible for the core idea. Figure 2 (right) was design by Katerina Marková.
8. REFERENCES
[1] M. Chion, Audio-Vision. Sound On Screen. (C. Gorbman, Ed., Eng. Tr.) New York: Columbia University Press, 1994.
[2] M. Castells, A Sociedade em Rede. A Era da Informação: Economia, Sociedade e Cultura, 3rd ed., vol. 1, Lisbon:
Fundação Calouste Gulbenkian, 2007.
[3] N. Christakis & J. Fowler, Connected: The Amazing Power of Social Networks and How They Shape Our Lives. London: Harper Press, 2009
[4] V. Cosenza, (retrieved at 03/02/2010)
http://www.vincos.it/world-map-of-social-networks/ [5] R. M. Schafer, The soundscape: our sonic environment and
the tuning of the world (1994 ed.). Destiny Books, 1977. [6] J. Cohen, “Out to Lunch: Further Adventures Monitoring
Background Activity.” in G. Kramer, & S. Smith (Ed.), Proceedings of the Second International Conference on Auditory Display, 1994, pp. 15 - 20.