See discussions, stats, and author profiles for this publication at: https://www.researchgate.net/publication/281491464
Proceedings of the International Conference
Turning data into knowledge: New
opportunities for statistics education
BOOK · MAY 2015 READS163
8 AUTHORS, INCLUDING: Hélia Margarida Oliveira University of Lisbon 75 PUBLICATIONS 133 CITATIONS SEE PROFILE Ana Henriques University of Lisbon 25 PUBLICATIONS 23 CITATIONS SEE PROFILE João Pedro da Ponte University of Lisbon 249 PUBLICATIONS 512 CITATIONS SEE PROFILE Rosa Tomás Ferreira University of Porto 17 PUBLICATIONS 5 CITATIONS SEE PROFILE Available from: Hélia Margarida Oliveira Retrieved on: 28 January 2016PROCEEDINGS OF THE
INTERNATIONAL CONFERENCE TURNING DATA
INTO KNOWLEDGE: NEW OPPORTUNITIES FOR STATISTICS EDUCATION
22-23 JUNE, 2015
Institute of Education of the University of Lisbon
Portugal
EDITORS
Hélia Oliveira Ana Henriques Ana Paula CanavarroCarlos Monteiro Carolina Carvalho João Pedro da Ponte Rosa Tomás Ferreira
Proceedings of the International Conference Turning data into knowledge: New opportunities for statistics education
Editors: Hélia Oliveira, Ana Henriques, Ana Paula Canavarro, Carlos Monteiro, Carolina Carvalho, João Pedro da Ponte, Rosa Tomás Ferreira, Susana Colaço
Publisher: Instituto de Educação da Universidade de Lisboa 2015, June – Lisbon, Portugal
ISBN: 978-989-8753-13-7
Composition of Proceedings: Ana Isabel Mota
Cite as:
Oliveira, H., Henriques, A., Canavarro, A. P., Monteiro, C., Carvalho, C., Ponte, J. P., Ferreira, R. T., & Colaço, S. (Eds.) (2015). Proceedings of the International
Conference Turning data into knowledge: New opportunities for statistics education.
Lisbon, Portugal: Instituto de Educação da Universidade de Lisboa.
This publication was co-financed by national funds through FCT – Fundação para a Ciência e Tecnologia, under the project Developing statistical literacy: Student learning and teacher education (contract PTDC/CPECED/117933/2010).
COMMITTEES
CONFERENCE SCIENTIFIC COMMITTEE
Hélia Oliveira (Co-Chair) | University of Lisbon, Portugal João Pedro da Ponte (Co-Chair) | University of Lisbon, Portugal Ana Henriques | University of Lisbon, Portugal
Ana Paula Canavarro | University of Évora, Portugal Carlos Monteiro | Federal University of Pernambuco, Brazil Carolina Carvalho | University of Lisbon, Portugal
Dani Ben-Zvi | University of Haifa, Israel
David Pratt | Institute of Education, London, United Kingdom Iddo Gal | University of Haifa, Israel
Irene Carzola | State University of Santa Cruz, Brazil Janet Ainley | University of Leicester, United Kingdom José António Fernandes | University of Minho, Portugal José Contreras | University of Granada, Spain
Joana Brocardo | Polytechnic Institute of Setúbal, Portugal Katie Makar | University of Queensland, Australia
Maria Eugénia Graça Martins | University of Lisbon, Portugal
Maria Manuel Nascimento | University of Trás-os-Montes and Alto Douro, Portugal Markus Vogel | University of Education of Heidelberg, Germany
Randall Groth | Salisbury University, United States of America Rolf Biehler | University of Paderborn, Germany
Rosa Tomás Ferreira | University of Porto, Portugal Susana Colaço | Polytechnic Institute of Santarém, Portugal
CONFERENCE ORGANIZING COMMITTEE
Ana Henriques | Ana Isabel Mota | Ana Paula Canavarro | Carolina Carvalho | Hélia Oliveira | João Pedro da Ponte | Rosa Tomás Ferreira | Susana Colaço
COLABORATORS
CONTENTS
INTRODUCTION ... 1 Welcome to Lisbon, welcome to the Conference ... 2
Hélia Oliveira
PLENARY TALKS ... 5 The uses of statistical literacy ... 6
Janet Ainley
The challenge of developing students’ statistical reasoning ... 6
Dani Ben-Zvi
PLENARY PANEL ... 7 Statistics education: Issues and perspectives ... 8
Janet Ainley, Dani Ben-Zvi, Andreas Eichler, João Pedro da Ponte
PROJECT DSL PANEL ... 9 Developing statistical literacy: Student learning and teacher education ... 10
Hélia Oliveira, Ana Paula Canavarro, Ana Henriques, Susana Colaço
RESEARCH PAPERS ... 13 Understanding conditional probability through visualisation ... 14
Katharina Böcherer-Linder, Andreas Eichler, Markus Vogel
Probability content in the entrance to university tests in Andalucia ... 24
José-Miguel Contreras, M. del Mar López-Martín, Pedro Arteaga, Magdalena Carretero
Semiotic complexity levels and activities related to statistical graphs in Chilean primary education textbooks ... 34
Danilo Díaz-Levicoy, Pedro Arteaga, Carmen Batanero, María Magdalena Gea
Using models and modeling to support the development of college-level students’ reasoning about statistical inference ... 44
Maria Meletiou-Mavrotheris, Marina Appiou Nikiforou
Using Tinkerplots software to learn about sampling variability and distributions as a basis for making informal statistical inferences ... 54
Luis Saldanha
Pedagogical statistical knowledge of a prospective teacher ... 64
Raquel Santos, João Pedro da Ponte
Interpretation of pictograms by 3rd grade pupils: The teacher’s role ... 74
Luciano Veia, Joana Brocardo, João Pedro da Ponte
Teachers’ practices and grade 3 students’ understanding of bar graph representations ... 84
Isabel Velez, João Pedro da Ponte
SHORT ORAL COMMUNICATIONS ... 95 Innovative didactic solutions for Statistics education in Italian schools ... 96
Barbara Ascari
Explorística - Adventures in statistics ... 98
Pedro Campos
Communication, actions and questions of one teacher in conducting statistical tasks ... 100
Ana Caseiro, João Pedro da Ponte, Cecília Monteiro
The role of the context during a statistical investigation with children ... 102
Susana Colaço
Inquiry-based teaching in Statistics and challenges for elementary and secondary school mathematics teachers ... 104
Everton Estevam, Márcia Cyrino
Statistical knowledge for teaching: The case of Sara and modelling tasks with two-dimensional distributions ... 106
Nélida Filipe, Ana Paula Canavarro, Leonor Santos
Developing statistical literacy in the 5th grade: A teaching experience ... 108
Cátia Freitas
5th grade students’ informal inferential reasoning when using Tinkerplots .... 110
Marisa Gregório, Ana Henriques, Hélia Oliveira
Statistical literacy in teaching of Natural Science ... 112
Aneta Hybšová
Relationships between hypothesis testing and probability/other inference topics ... 114
3
Sixth-graders interpretation of information using bar graphs and isolated cases ... 116
Ema Mamede, Liliane Carvalho
Don’t panic: In-service teachers’ attitudes towards statistics from elementary school ... 118
José Alexandre Martins, Assumpta Estrada, Maria Manuel Nascimento
Reasons to choose a statistical graph: A study with teachers of elementary school ... 120
Niedja Martins, Carolina Carvalho
Learning statistics through R Programming: An activity for linear regression ... 122
Maite Mascaró, Ana Isabel Sacristán, Marta Rufino
Graph reading and interpretation: An investigation of introductory Statistics college students’ knowledge ... 124
Marina Appiou Nikiforou, Maria Meletiou-Mavrotheris
Collaborative work as a tool to promote statistical literacy in an elementary school ... 126
Carlos Monteiro, Carolina Carvalho, Niedja Martins, Laura Nunes, Ana Pereira, Ana Rodrigues, Jorge Barroco
Teachers’ perspectives on promoting a statistical reasoning learning environment ... 128
Hélia Oliveira, Ana Henriques
The teaching of measures of variability at secondary level: Examining two teachers' PCK ... 130
Sandra Quintas, Rosa Tomás Ferreira, Hélia Oliveira
On the understanding and computing of probabilities through data in contingency tables ... 132
Carla Santos, Cristina Dias
POSTERS ... 135 Students’ covariational reasoning: Results of a teaching experiment using Tinkerplots ... 136
Patrícia Antunes, Ana Henriques
Big data in grade 10 ... 137
Lonneke Boels, Anne van Bodegraven, Patrick Hamersma
4
The challenges of teaching Statistics to deaf students ... 138
Carolina Carvalho, Carlos Monteiro, Niedja Martins, Laura Nunes, Ana Pereira, Ana Rodrigues, Jorge Barroco
Initial training of teachers of Matematics/Statistics in school education ... 139
Cristina Dias, Carla Santos
Flow state experience to improve the motivation and success of the learning’s Mathematics education of young Portuguese students ... 140
Luís Manuel Durão, Ana Caballero Carrasco, Manuel Casas García
Graphs and tables in elementary school: An analysis based on activity theory of elements ... 141
Alissá Grymuza, Rogéria Rêgo
The ISLP Poster Competition: A visual approach of bringing statistical literacy worlwide ... 142
Reija Helenius, Pedro Campos
Statistical literacy in preschool education ... 143
Fernando Martins, Ana Coelho, Vera do Vale, Isabel Duque, Luana Pinho
Teaching Statistics in indigenous schools ... 144
Sérgia Oliveira, Liliane Carvalho, Carlos Monteiro
Reflection on practices as teacher educators in Statistics ... 145
Manuel Vara Pires, Cristina Martins, Paula Barros
Knowledge about arithmetic mean: A study with future teachers ... 146
Manuel Vara Pires, Paula Barros, Cristina Martins
Statistical thinking about variation in data: A study with youth and adult students ... 147
Valdir Ramos, Iranete Lima, Carlos Monteiro
Interpreting represented data: An early childhood study ... 148
Margarida Rodrigues, Sandra Cordeiro
Challenging intuition with the “Bertrand Box” problem ... 149
Carla Santos, Cristina Dias
PARTICIPANTS ... 151 REVIEWERS ... 157
2
WELCOME TO LISBON, WELCOME TO THE CONFERENCE
“Over seven hills, which are as many points of observation whence the most magnificent panoramas may be enjoyed, the vast irregular and many-coloured mass of houses that constitute Lisbon is scattered. For the traveler who comes in from the sea, Lisbon, even from afar, rises like a fair vision in a dream, clear-cut against a bright blue sky which the sun gladdens with its gold. And the domes, the monuments, the old castles jut up above the mass of houses, like far-off heralds of this delightful seat, of this blessed region. The tourist’s wonder begins when the ship approaches the bar, and, after passing the Bugio lighthouse – that little guardian-tower at the mouth of the river built three centuries ago on the plan of Friar João Turriano –, the castled Torre de Belém appears, a magnificent specimen of sixteenth century military architecture, in the Romantic-Gothic-Moorish style. As the ship moves forward the river grows narrower, soon to widen again, forming one of the largest natural harbours in the world with ample anchorage for the greatest of fleets. Then, on the left, the masses of houses cluster brightly over the hills. That is Lisbon.
Fernando Pessoa in “Lisbon, what the tourist should see” (1925) http://lisbon.pessoa.free.fr/InteractiveBook.php
Lisbon’s description by the famous Portuguese poet Fernando Pessoa introduces you to some of the many beautiful types of scenery in this city, with the almost constant presence of sunshine and the River Tagus. It is a city whose history spans back thousands of years, which you can discover walking through its seven hills. There are innumerous experiences that can be lived in Lisbon: walking through characteristic neighborhoods, visiting streets filled with heritage monuments and museums, relaxing in one of the many gardens, belvederes and esplanades, and enjoying the pleasure of its gastronomy.
We are delighted to welcome you to Lisbon and particularly to the International Conference Turning data into knowledge: New opportunities for statistics education, being held at the University of Lisbon. This public university has eighteen faculties and institutes throughout the city of Lisbon and surrounding municipalities. It was the first university created in Portugal, in 1288. The university was later transferred to the Portuguese city of Coimbra, in 1537. In the late eighteenth century, it was reestablished in Lisbon. Recently, in 2013, the University of Lisbon merged with the Technical University of Lisbon, forming the ULisboa that is now the largest university in Portugal with more than 48 000 students.
This conference has been an initiative of the Portuguese research project DSL –
Developing statistical literacy: Student learning and teacher education – involving
the Institute of Education of the University of Lisbon and the University of Évora,
3
and supported by a group of leading international researchers in statistics education who took part in the Scientific Committee to whom we are deeply grateful.
The Conference was sought to be an opportunity to gather researchers, teacher educators and teachers interested in statistics education, to exchange experiences, and to present and discuss recent research and current projects. Therefore we invite all participants to contribute actively to the debate throughout the conference sessions and to meet different people at the lunch and coffee breaks to share ideas and experiences.
The Scientific Programme
Currently, statistics education takes place in a new social and cultural context and faces a global challenge of meeting the calls for statistically literate and informed citizens who are able to turn data into knowledge. Such a challenge provides new opportunities to rethink both what statistics we teach and how we teach statistics. Doing so is imperative in order to develop students’ ability to reason about data and to use them effective and critically, in their daily life, for prediction and decision-making.
It is well known by both researchers and practitioners in school that statistical literacy and reasoning, which call for critical, investigative and communicative skills, prove to be difficult to students. Thus, current international curriculum recommendations suggest data-orientated approaches for teaching statistics, at all levels of schooling, using real data and taking advantage of available technology. Furthermore, to develop their statistical literacy and reasoning, students are expected to deal with data in significant and authentic contexts. This conference addresses these challenges and opportunities for statistics education, for all school levels.
Two strands have been defined for the conference – Statistical literacy and Statistical reasoning – and these are the broad themes of the two Plenary Talks, presented by Janet Ainley and Dani Ben-Zvi, respectively. These two strands encompass a diversity of topics of research and projects, such as technology-enhanced learning and teaching practice with technology, as well as research in teacher education and in professional development, namely teachers’ systematic research about their own practice. More broadly the programme also intends to add to the discussion about statistics education, namely in what concerns its aims and diverse curriculum issues through the Plenary Panel that will take place in the last part of the conference. This 2-day Conference includes also other types of sessions: Research Papers, Short Oral Communications, Posters presentations and Workshops. All the received contributions as Research Papers (RP), Short Oral Communications (SO) and Posters were submitted to a blind review process and the final contributions are now collected on these proceedings. We would like to thank the reviewers, whose names
you can find at the final section of these proceedings, for their valuable contribution to the scientific quality of the conference.
The organization received originally 12 RP, 19 SO and 14 Posters. Through the review process some of these have been suggested to be resubmitted as SO or Poster. Unfortunately, a few colleagues whose proposals had been accepted did not obtain the support they needed to attend the conference. Finally, we have a total of 8 RP, 19 SO and 14 Posters in these proceedings that will be presented in the conference. The scope and diversity of the proposals’ themes are a clear evidence of the richness of the field of statistics education, nowadays.
Additionally, two workshops in Portuguese also will take place during the conference, targeting teachers who teach in elementary and secondary levels. We are thankful to Cláudia Oliveira, Marisa Gregório (Workshop 1 – Promoting statistical
reasoning with the TinkerPlots), Rosa Tomás Ferreira and Sandra Quintas (Workshop
2 – Promoting statistical investigations in the classroom) who were responsible for organizing and conducting the workshops in connection with Ana Henriques and myself. More than 30 Portuguese teachers and teacher educators have registered to attend these two workshops.
The conference also provides the opportunity to share part of the work that has been developed by the project DSL, and that is presented in a Plenary Panel, as well as in different RP, SO and Posters by several of its members. We thank you for coming and hope you will enjoy Lisbon and the conference.
Hélia Oliveira, Conference co-chair
6
THE USES OF STATISTICAL LITERACY
Janet AinleyUniversity of Leicester, United Kingdom ABSTRACT
When young children learn to read and write in their mother tongue, which is the normal meaning of ‘literacy’, they already know what these skills are useful for. They experience adults using reading and writing for a range of purposes everyday, and as their skills develop they can immediately use reading and writing for many of the same purposes as adults. They can read text in books, magazines, birthday cards, on computer screens, and write lists, text messages and notes to friends. The uses and purposes of statistical literacy are much less visible to children, and indeed to many adults. Even when statistical concepts and skills, such as sampling, or measures of average, are taught, the power and usefulness of those ideas is not always clearly connected to the experiences of learners. As a result, students and adults may ‘understand’ different measures of average, but not know why and when such as measure might be useful or appropriate. In this talk I will argue for the need for pedagogic approaches which foreground the uses of statistical ideas in ways which are meaningful for learners, and thus contribute to the development of useable statistical literacy.
THE CHALLENGE OF DEVELOPING STUDENTS’ STATISTICAL
REASONING
Dani Ben-Zvi University of Haifa, Israel ABSTRACT
Statistical reasoning is the way people reason with statistical ideas and make sense of statistical information. This involves making interpretations based on sets of data, graphical representations, and statistical summaries. Statistical reasoning combines complex ideas about data and chance, which leads to making inferences and interpreting statistical results. Underlying statistical reasoning is a conceptual understanding of a web of important ideas, such as distribution, center, variability, association, uncertainty, randomness, and sampling. In this presentation, I reflect on research projects – conducted during the past 20 years with colleagues and graduate students – on students’ learning to reason statistically. I contemplate on what I have learnt and offer some lessons. The questions I discuss are: What is statistical reasoning? Why is it challenging for learners at all ages? What can research tell us about students’ statistical reasoning and its development? How can we support students’ statistical reasoning? What research challenges are of current interest to the statistics education community?
7
STATISTICS EDUCATION: ISSUES AND PERSPECTIVES
Janet Ainley1, Dani Ben-Zvi2, Andreas Eichler3, João Pedro da Ponte (Chair)41University of Leicester, United Kingdom 2University of Haifa, Israel 3
University of Kassel, Germany 4University of Lisbon, Portugal
This panel addresses the following issues:
a) Aims: What must be the aims of statistics education in primary, middle and secondary schools? What are the main obstacles to achieve them?
b) Curriculum issues: What is reasonable to strive for in primary education? A privileged relationship with mathematics or a privileged relationship with other topics?
c) Research and Practice: What may be possible contributions of researchers to improve the status of statistics education in primary, middle and secondary schools?
10
PROJECT DEVELOPING STATISTICAL LITERACY: STUDENT
LEARNING AND TEACHER EDUCATION
Hélia Oliveira1, Ana Paula Canavarro2, Ana Henriques1, Susana Colaço (Chair)3 1
Institute of Education, University of Lisbon, Portugal 2University of Évora, Portugal
3Polytechnic Institute of Santarém, Portugal
ABSTRACT
Recent international and national mathematics curriculum guidelines indicate the development of students’ statistical literacy, at different levels of schooling, as a major educational aim. In Portugal, the mathematics syllabus for basic education, which began to be implemented in 2009, gave a greater emphasis on statistics, presenting more demanding learning goals, since the elementary levels. This represented a challenging situation for practicing teachers, requiring them to develop new perspectives about the teaching and learning of statistics. In this context, the project Developing statistical literacy: Student learning and teacher education was planned aiming to study the development of statistical literacy from elementary to secondary education, with special attention to two main issues: i) the characterization of key aspects of students’ statistical literacy, particularly regarding the ability to formulate questions, collect data and represent them to answer those questions, and ii) the development of statistical and didactical knowledge for teaching in different schools levels. As the project unfolded, another research strand associated with students’ statistical reasoning and the necessary conditions for its development emerged.
Regarding the development of statistical literacy and reasoning, the project assumes the key role of students doing statistical investigations, as this activity tends to engage them in meaningful learning and promotes a holistic view of statistics, mobilizing knowledge in various areas, using complex reasoning processes in a flexible way and helping them to develop critical thinking. In particular, in what concerns statistical knowledge development, the project has been focusing, among others, on the theme of statistics informal inference through the design of learning environments with technological resources that support students’ reasoning processes.
The project has also focused on deepening the field of teachers’ statistical and didactic knowledge for teaching statistics and their development in the context of pre-service or in-pre-service teacher education. The knowledge gained by the project research team has supported the planning of courses in teacher education for prospective teachers of different grade levels, as well as of professional development courses for
11
teachers supported by collaborative contexts that consider the articulation between theory and practice.
The research methodologies adopted by the project team have been diversified. There is a strong incidence of qualitative and design research approaches, both for studying students’ statistical literacy and reasoning, and teacher education scenarios and teachers’ practice.
The project is developed under the responsibility of the Institute of Education of the University of Lisbon, in partnership with the University of Évora. The team comprises seven senior researchers from different national higher education institutions, with extensive experience in teacher education. The team also includes PhD and master’s students, who are teachers or teacher educators in various parts of the country. The results and products of the project have been disseminated in national and international contexts, through the publication of papers and communications in scientific and professional meetings, and in seminars opened to the national and international mathematics and statistics education communities. The project had the financial support of FCT - Fundação para a Ciência e Tecnologia, from 2012 to 2015 (contract PTDC/CPECED/117933/2010).
THE PROJECT TEAM Coordenation
Hélia Oliveira (coord.), Ana Henriques, Ana Paula Canavarro, Carolina Carvalho, João Pedro da Ponte, Rosa Tomás Ferreira, Susana Colaço.
Other members and collaborators
Ana Caseiro Rodrigues, Ana Isabel Mota, Cátia Freitas, Cláudia Fernandes, Cristina Roque, Isabel Velez, Marisa Gregório, Mónica Patrício, Nélida Filipe, Patrícia Antunes, Paula Gil, Raquel Santos, Sandra Cadima, Sandra Quintas.
14
UNDERSTANDING CONDITIONAL PROBABILITY THROUGH
VISUALISATION
Katharina Böcherer-Linder1, Andreas Eichler2, Markus Vogel3 1University of Education Freiburg, Germany
2
University Kassel, Germany
3University of Education of Heidelberg, Germany
This paper refers to a research project aiming to compare two different strategies to visualise conditional probabilities for which learning obstacles are often reported. We firstly explain the mentioned two strategies, i.e. the tree diagram with natural frequencies and the unit square. Afterwards we provide the development of our test instrument and discuss some results referring two samples of prospective teachers. These results show considerable differences between the two visualisations as well as a significant benefit of the unit square.
INTRODUCTION
“Representation and visualization are at the core of understanding in mathematics” (Duval, 2002, p. 312). In both mathematics education and statistics education, it is widely accepted that visualisation could have a considerable impact on students learning of mathematics or statistics. This is even the case, if we restrict the term visualisation to graphical representation (c.f. Presmeg, 2006). However, research in mathematics education, statistics education and cognitive psychology gave evidence that visualisation does not necessarily foster students’ understanding. Thus, the efficiency of visualisation is dependent on the quality of a specific visualisation as well as on the quality of the connection of a certain visualisation and a mathematical object and thus, the expectable outcome for enhancing students´ understanding (e.g., Ainsworth, 2006; Presmag, 2006). For this reason, a crucial question in research in mathematics education and statistics education is to identify the one of potentially different visualisations that is most efficient referring to students’ learning. A second question that is closely connected to the first question concerns the definition of that part of students’ knowledge that should be promoted by certain visualisation. The aim of this research, which is a part of the German research project VisDeM (visualisation in teaching German language and mathematics, http://www.kebu-freiburg.de/visdem/), is to gain results referring to the two questions outlined above. Regarding these two questions, we focus on the subject of conditional probability, and, particularly, on the subject of the Bayes’ rule. The rational for this focus is twofold. On the one side conditional probabilities are a subject in which the human intuition often seems to be misleading (e.g., Kahneman & Tversky, 1972). On the other side research gained strong evidence for the efficiency of two different forms of visualisation for the learning of conditional probabilities and also the Bayes’ rule, i.e. a tree with natural frequencies (e.g., Sedlmaier & Gigerenzer, 2001) and the unit square (Bea, 1995). However, the aforementioned research results do neither involve
Böcherer-Linder, Eichler, Vogel
15
a direct comparison referring to the impact of these both visualisations on students’ learning nor a direct comparison by only using natural frequencies.
In this paper, we firstly discuss the tree diagram, the unit square and research related to these two visualisation strategies. Afterwards we address the two research questions outlined above in two subsequent steps referring to two different samples of prospective teachers. To each step, we discuss the method, specific research questions and the results. We conclude this paper by giving a brief explanation of further steps of our research.
VISUALISATION REFERRING TO CONDITIONAL PROBABILITIES We show both visualisations (the tree diagram with natural frequencies and the unit square) in figure 1 referring to the following situation:
- 10 % of a certain population has a disease without knowing that.
- A diagnosis test gives a correct indication of the disease in 80 % of all cases (i.e. the persons that have actually the disease).
- The diagnosis test has further the characteristic that 10 % of cases will be wrongly identified as having the disease, although the disease is not present.
Figure 1: Tree diagram (left side) and unit square (right side) referring to the same situation of a diagnosis test.
The tree diagram with natural frequencies has a sequential and hierarchical structure. Thus, for example, the very right path in the tree diagram represents the persons with no disease who got a negative result in the diagnosis test. The unit square is a statistical graph where the persons with no disease, who got a negative result in the diagnosis test, are represented by a partial area of the square, in this case the bottom right one (c.f. Eichler & Vogel, 2010).
Sedlmeier and Gigerenzer (2001) investigated adults (students at university) concerning their ability to solve tasks using the Bayes’ rule. They found that the tree diagram with natural frequencies is more efficient than a common tree diagram with probabilities. Particularly, the learning results based on the intervention involving the tree diagram with natural frequencies seem to be stable on a high level over a long
Böcherer-Linder, Eichler, Vogel
period. In contrast the high immediate learning of students based on the intervention with the tree diagram with probabilities showed a strong decay after few weeks. Wassner (2004) replicated these results referring to students’ learning in schools using a qualitative design.
Sedlmeier and Gigerenzer (2001) gave two reasons explaining the efficiency of the tree diagram with natural frequencies. The first reason concerns the way of information‘s representation based on natural frequencies (c.f. Gigerenzer & Hoffrage, 1995). The second reason refers to the assumption that the tree represents a powerful tool to structure given information. In the research of Sedlmaier and Gigerenzer (2001), the efficiency of students’ learning was measured by the number of students’ correct solutions of tasks for which applying the Bayes’ rule is necessary. Thus, this study primarily addressed students’ procedural knowledge (Hiebert & Carpenter, 1992), i.e. the knowledge how to solve a specific class of tasks.
Further, Bea (1995) yielded evidence that using a unit square is more efficient than using the tree diagram with probabilities when students’ learning of conditional probability and the Bayes’ rule was regarded. In his research, Bea used the unit square with probabilities. According to the results of Gigerenzer and Hoffrage (1995) mentioned above we also give the information in the unit square as natural frequencies (fig. 1). As mentioned before, the unit square visualises conditional probabilities and Bayes’ rule geometrically based on proportions of line segments and proportions of partial areas of the square. Accordingly, Bea (1995) showed that the unit square particularly had promoted students’ conceptual knowledge (Hiebert & Carpenter, 1992). Conceptual knowledge in this field concerns, for example, the knowledge how resulting probabilities would change if probabilities that determine the shape of the unit square (e.g., the probability of having a disease) would be changed.
Based on the considerations above, our research does not only focus on a comparison of the general efficiency of the two strategies of visualisation, but also focuses on the efficiency of the strategies of visualisation to promote primarily procedural knowledge or primarily conceptual knowledge.
FIRST STEP OF RESEARCH Method
Although there is research about the efficiency of both strategies of visualising conditional probabilities, only the tree diagram with natural frequencies plays a substantial role in statistics education in Germany, where our research took place (Eichler & Vogel, 2010). For this reason, one specific aim of the first step of our research approach was to examine if there are differences in extracting the relevant information from the two visualisations. To describe different levels of extracting information from a visualisation we used the model of Curcio (1987; 1989), referring to the aspects read the data, read between the data, and read beyond the data. We explain these aspects below when exemplarily discussing the test items.
Böcherer-Linder, Eichler, Vogel
The sample consists of 78 prospective mathematics teachers at the University of Kassel that were enrolled in a course of mathematics education in 2014. This sample was randomly divided into two subsamples.
The participants got a brief description of a visualisation based on a simple example, the first subsample referring to the use of the tree diagram with natural frequencies, the second sample referring to the unit square with natural frequencies. Both descriptions were identical as regards stochastic content, they differ only as regards the kind of visualisation.
We integrated the three aspects of Curcio (ibid.) that we describe above in test items. The aspect read the data is described as lifting information to answer explicit questions for which the obvious answer is right there in the graph (Curcio, 1989). An example of the aspect read the data is shown in figure 2 referring the context of diseases.
Read the numbers from the diagram: a) ____ have the disease got a positive test. b) ____ have not the disease.
c) ____ of all persons got a negative test.
d) ____ are negatively tested persons that have not the disease.
e) ____ of all persons got a positive test.
Figure 2: Example of an item referring to read the data.
We used two items with other contexts for testing the prospective teachers’ ability to read the data. Both items consist of five tasks that are equivalent to the example shown in figure 1 and 2.
The aspect read between the data is described as interpolating and finding relationships in the data presented in a graph (Curcio, 1989). An example of the aspect of read between the data is shown in figure 3.
Again, we used two items with other contexts for testing the prospective teachers’ ability to read between the data (speaking dialect and doing physics). Both items consist of five tasks that are equivalent to the example shown in figure 1 and 3.
Mark whether the following assertions are true or false:
a)Most of the persons having the disease got a positive test (true/false). b)Most of the persons have not the disease (true/false).
c)Most of the persons, who got a positive test, have the disease (true/false). d)Most of the persons, who got a negative test, have not the disease (true/false). e)Most of the persons, who got the disease, got a negative test (true/false).
Böcherer-Linder, Eichler, Vogel
18
Finally, Curcio (1989) described the aspect of reading beyond the data as the ability of extrapolating, predicting and inferring from the visualisation to answer implicit questions. One example referring this aspect was the situation shown in figure 1 with the task shown in figure 4.
How is the change of the following proportions if the percentage of persons that have the disease would be bigger? Mark the correct solution.
a)The percentage of persons having the disease that get a positive test result will be bigger/smaller/constant.
b)The percentage of persons getting a positive test result that have the disease will be bigger/smaller/constant.
c)The percentage of persons that get a negative test will be bigger/smaller/constant.
d)The percentage of persons having the disease that get a negative test result will be bigger/smaller/constant.
e) The percentage of persons getting a negative test result, that have not the disease will be bigger/smaller/constant.
Figure 4: Example of an item referring to read beyond the data.
We used this and one further item with another context (concerning flower cultivation) for testing the prospective teachers’ ability to read beyond the data. Each sub-item was coded with 0 (false) or 1 (correct). We had two hypotheses for this first step of our research:
- Because the requested information is directly given within the tree diagram as well as within the unit square we expect no difference in students’ solutions with regard to Curcio’s (1989) levels of reading data and reading within the data. Thus, we hypothesize that there is no difference between the two strategies of visualise conditional probabilities referring to the ability to read the data and to read between the data.
- Because the proportions are (at least partially) displayed within in the unit square but not within the tree diagram (beyond the same numerical information given within both kinds of visualisation) we expect the unit square to be more helpful for concluding new information from the given on. This applies to the level of reading beyond the data. Thus, we hypothesize that the unit square is more appropriate for reading beyond the data.
Results
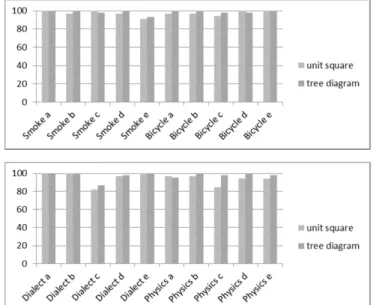
The item tasks referring to the aspect of reading the data seems mostly to measure the same construct (for ten items Cronbach’s alpha is 0.616). Actually, the results shown in figure 5 imply that there is no reason to reject our first hypothesis. The
Böcherer-Linder, Eichler, Vogel
19
items show at most a very high rate of correct answers. All existing differences are far away from being significant.
These results are important for our further research steps: Although the strategies of visualising conditional probabilities are different referring to their degree of familiarity in school, the ability of the students of extracting information from the diagrams do not differ. Thus, it is possible to directly compare the results of the other tasks.
Figure 5: Results referring to the items concerning read in the data (smoke and bicycle) and read between the data (dialect and physics).
The results referring to the third aspect of Curcio’s model, i.e. read beyond the data is shown in figure 6.
Böcherer-Linder, Eichler, Vogel
Actually, most of the single items and especially the sum of the item scores (for ten items Cronbach’s alpha is 0.616) do not show a significant difference between the two visualisations. Thus, our second hypothesis could not be rejected.
However, in a further exploratory investigation of the data, we found that the results differ in case that the years of study of the prospective teachers are regarded. It means, if our sample is restricted to those students that are not in the first year of their studies, the results of our test are different from those referring to all the prospective teachers. Referring to this restriction we have 39 cases of which 21 worked with the tree diagram and 18 cases which worked with the unit square. Here, the reliability of the aspect read beyond the data indicated by Cronbach’s alpha is 0.649 and, thus, slightly better than regarding all cases. Further, the difference between the performances of the prospective teachers compared by the two visualisations is in fact not significant, but the p-value implied that the difference between the two visualisation strategies could become significant if particularly experienced prospective teachers are regarded. Among other things, this informal and explorative result was the basis for the second step of our research.
SECOND STEP OF RESEARCH Method
The sample in this step of our research consists of 206 prospective teachers at the University of Education Heidelberg. 58 of these prospective teachers were in their first years of study the other 148 prospective teachers had more experience, but not with regard to systematic learning neither concerning conditional probabilities and Bayes’ rule nor concerning these two kinds of visualisations on which we focus. Again the sample was randomly divided into two subsamples. Each of the subsamples got three test items referring to the aspect of read beyond the data. Each of the items consists of five sub-items. The tests referring to the two subsamples differed in terms of the given visualisation of the addressed situation. Further, each subsample got the same brief introduction to the used visualisations that was the same as in the first step of our research.
One of our hypotheses for this step of research was that there is a difference between the ability to read beyond the data referring to the different strategies of visualise conditional probabilities. However in this case, we particularly expected a significant result referring to experienced prospective teachers, because we expected them to be able to use the graphical advantage of the unit square (cf. reasoning of hypothesis 2 in the first step of research) more effectively for reason of their further developed general mathematical abilities.
Böcherer-Linder, Eichler, Vogel
Results
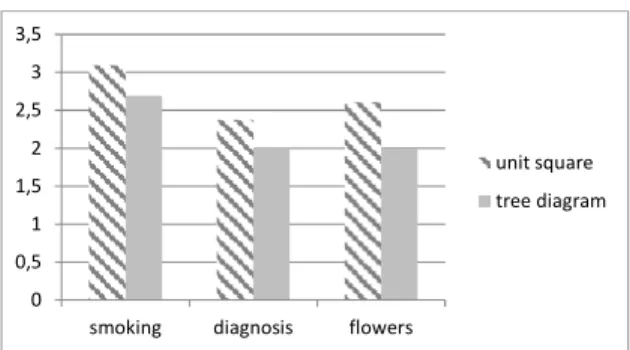
Figure 7: Results referring to the items concerning read beyond data.
Actually, if the whole group of the prospective teachers is regarded, there is no significant advantage of the unit square compared to the tree diagram (p = 0.126). However, if only the experienced prospective teachers are regarded (years of study is more than one year), there is statistical evidence that the unit square is more efficient than the tree diagram (p = 0.042).
In figure 7 we provide the results of the sum of the each five sub-items that generally show an appropriate reliability (Cronbach’s alpha is 0.75). These results refer to the average of correct answers to the five sub-items of the three items.
DISCUSSION AND CONCLUSION
In this paper we reported a study consisting of two steps aiming to compare two strategies of visualise conditional probabilities, i.e. the tree diagram with natural frequencies and the unit square.
We firstly investigated whether there is a difference between the two visualisations referring to extracting simple information from the diagrams that could be assigned to the aspects of reading the data and reading between the data proposed by Curcio (1989). As theoretically assumed we found no empirical evidence for such a difference between the two visualisations. This absence of a difference was an important result for further research. Actually the tree diagram with natural frequencies is often promoted as an outstanding way to visualise conditional probabilities (e.g., Gigerenzer & Hoffrage, 1995; Sedlmeier & Gigerenzer, 2001; Spiegelhalter & Gage, 2014). However, our research gives evidence that there is another visualisation that seems to be equally efficient to extract relevant information of a statistical situation.
Moreover, for experienced prospective teachers, our results further imply that the unit square is more efficient to solve tasks referring to the aspect of reading beyond the data or rather to solve tasks that focus on a conceptual understanding of conditional probabilities and the rule of Bayes. This was also an important result that led to the hypothesis that a higher mathematical education increases the benefit of the unit
0 0,5 1 1,5 2 2,5 3 3,5
smoking diagnosis flowers
unit square tree diagram
Böcherer-Linder, Eichler, Vogel
22
square compared to the tree diagram with natural frequencies. Following this paper, the mentioned hypothesis refers to the aspect of reading beyond the data. For this reason, we plan further steps of our research. For example, we want to investigate differences among samples of students of sciences, samples of students of mathematics and samples of students that have no relation to mathematics. Further we plan to include a clearer distinction between items that address procedural knowledge and conceptual knowledge for proving how different visualisations impact on different aspect of knowledge. One aim of these further steps of our research is to precisely identify situations of uncertainty for which the unit square is more efficient for students learning than the tree diagram or other strategies of visualising conditional probabilities.
REFERENCES
Ainsworth, S. E. (2006). DeFT: A conceptual framework for considering learning with multiple representations. Learning and Instruction, 16, 183–198.
Bea, W. (1995). Stochastisches Denken (Stochastical reasoning). Frankfurt a.M.: Lang.
Curcio, F. R. (1989). Developing graph comprehension. Reston, VA: N.C.T.M. Eichler, A., & Vogel, M. (2010). Die (Bild-)Formel von Bayes (The (picture) formula
of Bayes). PM - Praxis der Mathematik in der Schule, 52(32), S. 25-30.
Duval, R. (2002). Representation, vision, and visualization: Cognitive functions in mathematical Thinking. Basic Issues for Learning. In F. Hitt (Ed.),
Representations and mathematics visualization (pp. 311-336). Mexico:
PME-NA-Cinvestav-IPN.
Gigerenzer, G., & Hoffrage, U. (1995). How to improve Bayesian reasoning without instruction: Frequency Formats. Psychological Review, 102 (4), 684-704.
Hiebert, J., & Carpenter, T. P. (1992). Learning and teaching with understanding. In D. Grouws (Ed.), Handbook of Research on Mathematics Teaching and Learning (pp. 65-97). New York: Macmillan.
Kahnemann, D., & Tversky, A. (1972). Subjective Probability: A judgement of representativeness. Cognitive Psychology,3(3), 430-454.
Presmag, N. (2006). Research on visualization in learning and teaching mathematics. In A. Gutierrez, & P. Boero (Eds.), Handbook of research on the psychology of
mathematics education (pp. 117-146). Rotterdam: Sense Publishers.
Sedlmaier, P., & Gigerenzer, G. (2001). Teaching Bayesian Reasoning in Less Than Two Hours. Journal of Experimental Psychology: General, 130(3), 380-400. Spiegelhalter, D., & Gage, J. (2014). What can we learn from real-world
communication of risk and uncertainty? In K. Makar (Ed.), Proceedings of the
Ninth International Conference on Teaching Statistics. Flagstaff, USA:
International Statistical Institute and International Association for Statistical
Böcherer-Linder, Eichler, Vogel
23
Education. Retrieved from http://iase-web.org/icots/9/proceedings/pdfs/ICOTS9_ PL2_SPIEGEL HALTE R .pdf.
Wassner, C. (2004). Förderung Bayesianischen Denkens. Kognitionspsychologische
Grundlagen und didaktische Analysen (Promoting Bayesean thinking. Basics
referring to cognitive psychology and educational analysis). Hildesheim: Franzbecker.
PROBABILITY CONTENT IN THE ENTRANCE TO UNIVERSITY
TESTS IN ANDALUCIA
José-Miguel Contreras, M. del Mar López-Martín, Pedro Arteaga, Magdalena Carretero
Universidad de Granada, Spain
In this work we analyse the contents of the probability problems proposed for the university entrance tests in Andalucía (Spain). Specifically, we examine the problems proposed to the students who selected the specialty of Social Sciences. We solved all the probability problems for each of the 6 different tests proposed in 2003, 2008 and 2013, and using semiotic analysis we identified the probabilistic objects involved in their solution. An elementary statistical study of the distribution of the different objects in the three years served to obtain conclusions about the presence of the objects in the problem and about the difficulty of the problems.
INTRODUCTION
The need for probability education has been recognized in the Spanish curricular guidelines, since probability contents were included in Primary and Secondary Education (Batanero, Arteaga, & Gea, 2011; Batanero, Gea, Arteaga, & Contreras, 2014). Probability is also included in Mathematics into the specialties of Sciences and Technology, and Humanities and Social Sciences in High School (MEC, 2007), where we find the following contents:
• Assigning probabilities to events. Prior and posterior probability; joint, conditional and total probability, Bayes’ theorem.
• Binomial and Normal distributions. Practical implications of central limit theorem; approximation of binomial distribution by the normal distribution; law of large numbers.
Assessment is an important element that guides the teacher and the students towards achieving the learning goals. Assessment is given a main role in the transition from high school to university in Spain, since the score the students get in the compulsory university entrance tests, often determines the student’s possibility to follow their preferred university degree (and future career). Paradoxically, probability problems are only included in the tests aimed at Humanities and Social Sciences students, although this content is also taught to Science and Technology students.
In this paper we present preliminary results of a project directed to analyse the content of the university entrance tests in Andalucía. The pertinence of this project is clear, since these tests often influence (more than the curricular guidelines) what is taught to these students, and our results may help the teachers to prepare their students for these tests. These preliminary results consist in the analysis of all the problems posed in three different years (36 problems in total) and will help to try the method and determine the main variables to continue the analysis of all the test
Contreras, López-Martín, Arteaga, Carretero
proposed in the last 14 years. After summarizing the theoretical framework and related research we describe the method. Then, we include the detailed analysis of one of the problems included in these tests. Finally, we present a statistical summary of the results obtained in the tests analysed and conclude with some implications for teaching.
THEORETICAL FRAMEWORK
We base on the onto-semiotic approach to mathematics education (Godino, & Batanero, 1994; 1998: Godino, Batanero, & Font, 2007) where meaning is modelled in terms of systems of the practices carried out when solving a given problem. In these practices different type of objects intervene; “object‟ is understood in a broad sense and includes problem-situations; procedures; concepts and properties. The mathematical practices can be idiosyncratic of a person (personal meaning) or shared within an institution (institutional meaning). In mathematics education research we are interested in the meaning of specific objects in teaching institutions; in particular in this research we are interested in analysing the institutional meaning of probability in the entrance tests to University. This meaning can be described by the mathematical objects linked to the problems proposed in these tests and the practices that students should carry out in their solution. The method of semiotic analysis proposed in this framework is directed to identify these objects and the interpretive processes needed by the person who solves the problem. When this analysis is applied to the problems included in a textbook or in a test it serves to identify the correspondence between assessment and curricular guidelines and to show the complex work required from the student.
PREVIOUS RESEARCH
We also base on two previous research that has analysed probability problems in textbooks with the same framework, to identify the variables used in our study. Ortiz (1999) analysed a sample of high school textbooks and identified as main concepts implicit in the problems those of compound experiments, dependence and independence, joint probability, total probability and the Bayes theorem. In our analysis we will consider all these objects. According to him the textbooks problems were consistent with the curricular guidelines for high school in Spain and few problems were related to conditional probability.
Díaz (2004) studied the probabilistic problems in 17 university textbooks and classified the problems according to the following variables: a) type of experiment: sampling with or without replacement, or simple experiment; b) dependent or independent experiments; c) property or theorem used: product rule, computation of conditional probability using a formula; total probability or Bayes’ rule; d) type of situations: synchronic (when experiments are simultaneous) or diachronic (consecutive experiments). She did not informed of the frequency of the different problems.
Contreras, López-Martín, Arteaga, Carretero
26
Although these two authors identified variables and categories relevant in the analysis of probability problems, they limited themselves to identify the presence or absence of each category in the sample of textbooks they analysed. Their studies did not highlight the complexity of the problems, because they did not perform a semiotic analysis of the same. Moreover we found no previous analysis of the problems proposed in the entrance to university tests; consequently our paper is a first contribution to this research question and complements these previous studies. METHOD
The university entrance tests in Andalucía are currently regulated by the Royal Decree 1892/2008, of 14 November, where the conditions for access to official university studies and the admission procedures to Spanish public universities are described (MP, 2008). This document requires the students to pass a maturity test (university entrance test), in which the students’ knowledge and abilities are assessed. The mathematics test for Humanities and Social Sciences students consists of two options: A and B. The student can chose one of these options and should solve all the problems proposed in the selected option (mixing problems from both options is not allowed). The content of tests (4 problems) is similar for both options: the first problem is related to algebra, the second to analysis, the third to probability and the last to statistical inference. The correct solution to each problem is scored with 2.5 points from a total of 10 points in the full test. The content of the problems should be in agreement with the curricular guideline contents for high schools in Spain.
In our study, we focus only on the probability content of this curriculum. As we mentioned above, each test includes a specific problem related to this content. Moreover, as we will show in our analysis this problem is centre specifically in “Reinforcing ideas about prior and posterior probabilities, joint probability,
conditional probability; total probability and the Bayes’ rule”.
In this preliminary study we examine the probabilistic problems contained in the tests proposed in the years 2003, 2008 y 2013. Since we are interested in the period 2003 (when the current regulation for the entrance test were started) to 2014, we selected a year at the beginning, the middle and the end of the period, in order to see if there is an uniformity in the content of these tests in the different years or a tendency to change is visible. In each of these years, 6 different versions of the tests were used (depending on the semester and city); since each test has two options, we analysed a sample of 36 problems.
Given that the sample size is limited, our study is exploratory, which is usual in qualitative research. We therefore do not intend to extrapolate the results to other different tests. However, we believe that our findings can serve to formulate some preliminary hypotheses about the probability content of the tests in other years or in other regions that would be tested in the final study.
Contreras, López-Martín, Arteaga, Carretero
27
SEMIOTIC ANALYSIS OF PROBLEMS: AN EXAMPLE
Each of the items included in the sample was solved; and we performed a semiotic analysis of the correct solution to the problem, in order to identify the mathematical content required in the solution. In this section we present the analysis of item P5A included in the fifth version of the test (option A) in 2013 as an example.
Item 5A. From a total of 212 elderly people in a geriatric home, 44 of them have lung problems; 78 of them are regular smokers, and only 8 have lung disease and are non-smokers.
a.What is the probability that an elderly person in this home, chosen at random, does not smoke and does not have lung disease?
b.What percentage of elderly people with lung problems are smokers?
To correctly solve the problem, the student needs to identify the data of the problem. First, the student should consider the compound experiment selecting an elderly
person randomly where it is necessary to identify two characteristics (two simple
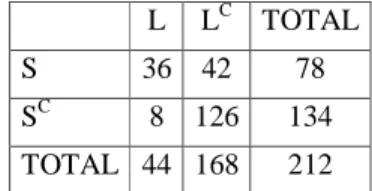
experiments): a) On one hand, the person may have lung disease or not (the sample space has two events: having lung disease, L, and not having lung disease LC; b) secondly, the person may be a smoker or not (the sample space in the second experiment has two events: smoking, S, and not smoking, SC). A two-way table (See Table 1) may help the student to identify the frequency of different categories of people in this home (see Table 1).
L LC TOTAL
S 36 42 78
SC 8 126 134 TOTAL 44 168 212
Table 1: Data needed to solve problem 5A.
Since simple events include a single element and compound events at least two elementary events, we conclude that the events considered in the problem are simple events in a compound experiment. The student must identify each simple experiment and the compound experiment, that is, form the Cartesian product of two simple experiments. Once the events and frequencies are identified, the student should interpret the questions posed in terms of probability.
Solution to question a.
Table 2 shows a summary of the steps that the student must follow to solve this question. In the first question, the student has to interpret that in this question we ask to compute a joint probability; specifically the probability of the intersection between being a non-smoker and having no lung disease ( ∩ ). To solve this first question, the student has to identify the joint frequency corresponding to the intersection of these events in Table 1 and divide this frequency by the total of elderly
Contreras, López-Martín, Arteaga, Carretero people in the sample, i.e.:
( ∩ ) = = 0.594. Solution to question b.
In the second part, the student should identify the conditional probabilityP(S|L), the
probability of being a smoker, with the condition that the person has lung problems. To compute this probability the student has to identify the condition and needs to use the first column of Table 1; therefore 0,81
44 36 ) |
(S L = =
P . As the result should be transformed to percentage, he must multiply the probability by 100 to obtain 81%. In Table 2, we analyse the mathematical practices that the student has to perform to solve the problem, according to the steps described previously. Consequently, the student needs to remember some concepts (simple and compound experiment; simple and compound events; dependence; simple probability; conditional and joint probability; complementary events; Laplace’s rule and percentage).
The student uses different mathematical language (words and symbols, to express the events, the probabilities and the formulas); he needs to perform procedures (arithmetic operations; computation of different probabilities). He also uses some properties (such as the relationship between the different types of frequencies in the 2x2 table and the idea of favourable and possible cases in the experiments). The student should identify the data of the statement; built and read a contingency table and apply Laplace’s rule. In addition, the student has to interpret the problem statement, and transform a probability into a percentage. The student must perform an analysis-synthesis argument to summarize the solution. As shown in Table 2 the simplicity of the problem is only apparent due to the number of mathematical objects and processes that the student should remember and use.
SUMMARY OF RESULTS
As shown, in the analysis of the solution for this problem (see Table 3) this process is complex, and the student should remember to apply and combine the different types of mathematical objects considered in our theoretical framework.
Some of these objects are complex, as shown in previous research. For example, Kelly and Zwiers (1986) described the confusion between independence and mutual exclusiveness: while two mutually exclusive events are essentially dependent, i.e. one cannot occur without the other, the contrary is not generally true.
The language used is always numerical, verbal and symbolic; sometimes graphs, tables or diagrams built by the student are added. As regards the arguments, every problem always requires to carry out an analysis (dividing the statement and the solution in parts) and a synthesis (composing the solution).
The same method of analysis was applied to the 36 problems proposed in the tests in the years 2003, 2008 and 2013. In Table 3 we show the mathematical objects
Contreras, López-Martín, Arteaga, Carretero
involved in solving the problems proposed in 2003, which include difficult concepts. For example, some students do not differentiate conditional and joint probabilities (Pollatsek, Well, Konold, & Hardiman, 1987). Other students make frequent errors when applying Bayes’ rule (Gras & Totohasina, 1995). These errors may appear when solving some of the problems proposed in the university entrance tests.
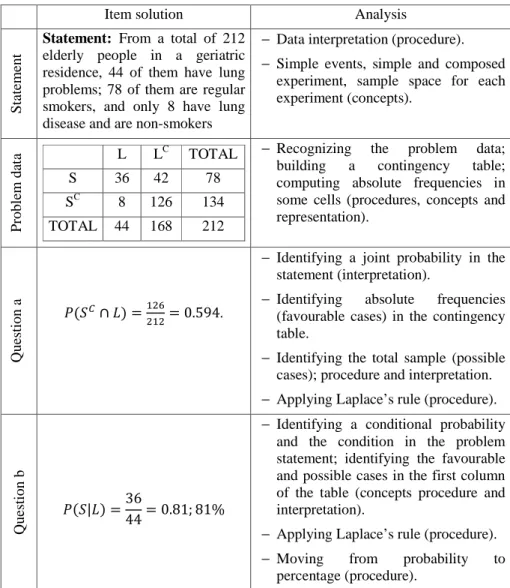
Item solution Analysis
Sta
te
m
en
t
Statement: From a total of 212 elderly people in a geriatric residence, 44 of them have lung problems; 78 of them are regular smokers, and only 8 have lung disease and are non-smokers
− Data interpretation (procedure). − Simple events, simple and composed
experiment, sample space for each experiment (concepts). Pr o b le m d at a L LC TOTAL S 36 42 78 SC 8 126 134 TOTAL 44 168 212
− Recognizing the problem data; building a contingency table; computing absolute frequencies in some cells (procedures, concepts and representation). Q u es tio n a ( ∩ ) = = 0.594.
− Identifying a joint probability in the statement (interpretation).
− Identifying absolute frequencies (favourable cases) in the contingency table.
− Identifying the total sample (possible cases); procedure and interpretation. − Applying Laplace’s rule (procedure).
Q u es tio n b ( | ) =36 44= 0.81; 81%
− Identifying a conditional probability and the condition in the problem statement; identifying the favourable and possible cases in the first column of the table (concepts procedure and interpretation).
− Applying Laplace’s rule (procedure). − Moving from probability to
percentage (procedure).
Table 2: Analysis of the correct solution of the item P1A.
We consider that the student should enumerate the sample space when it is explicitly requested; the computation of a probability may be simple, compound or conditioned
Contreras, López-Martín, Arteaga, Carretero
30
and may refer to a simple or compound event in a simple or compound experiment. Sometimes the problem solution requires the computation of the probability of the complementary of an event, the probability of the union of the compatible events or the formula of conditional probability. Other times it is also necessary to apply total probability or Morgan’s rules.
Problem Content 1A 1B 2A 2B 3A 3B 4A 4B 5A 5B 6A 6B Sample space x x x Simple event x x x x x x x x x x x x Compound event x x x x x x x Complementary x x x x x x Laws of Morgan x Events union x Simple probability x x x x x X x x x x x Laplace rule x x x x x x Compound experiment x x x x x x x x x x x Joint probability x x x x X x x x x x x Conditioned probability x x x x X x x x x x Conditional probability x x x x X x x x x Dependence x x x x x x x x Independence x X x x x x Total probability x x x x x x Bayes rule x x x x x x
Table 3: Concepts, properties and procedures in the items of 2003.
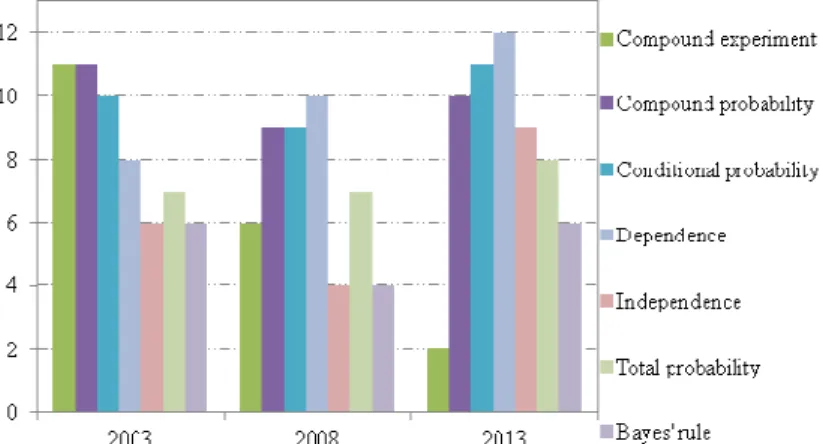
In order to compare the presence of mathematical objects in the tests in the years 2003, 2008 and 2013 we present Figures 1 and 2. In Figure 1 we analyse half the mathematical objects considered and the rest of them in Figure 2. The purpose of using two figures is to facilitate the analysis of our results.
The enumeration of the sample space is hardly requested explicitly, although in fact the student usually have to form the sample space to continue the solving process.
Contreras, López-Martín, Arteaga, Carretero
31
While in 2003 and 2008 every problem involved computing the probability of a simple event in 2013 no problem proposed this computation. On the contrary the number of problems that asked to compute the probability of compound events was larger in 2013.
Morgan's laws had to be used mostly in the problems proposed in 2008 and also in 8 problems (of 12) in 2013. Laplace’s rule should have been directly applied in all the 2008 and 2013 problems and only in half the problems proposed in 2003 (in the remaining problems the probability should be computed using a formula; for example, the product rule).
Figure 1: Mathematical objects on problems.
In Figure 2 we highlight the variation of problems related to compound experiments (decreasing with time), although there is no much change in the presence of joint and conditional probability, because sometimes these problems are set in simple experiments.