Equity Valuation:
Koninklijke Ahold NV
Bernardo Gaspar Ferreira
Tutor: Dr. José Carlos Tudela Martins
Dissertation submitted in partial fulfillment of requirements for the degree of MSc in Business Administration, at Católica Lisbon School of Business and Economics
Koninklijke Ahold NV
COMPANY REPORT
Company Description:
Ahold is an international retailing group based in the Netherlands with strong consumer brands in Europe and the United States. By 2012, the company had more than 3,000 stores, serving a trade area of around 80 million people and with a current number of circa 225,000 employees.
Ahold US offer is highly distinctive, preserving market share and margin:
For the past six years, the American food retail industry has been exposed to a more intense and competitive market. More brands and more stores are opening creating a more saturated market. Despite this seismic shift in the competitive environment, Ahold held its market share
This is related with the fact that Ahold US stores are targeted to a more specific target with a strong food focus and good price/quality relation. Ahold´s offers “quality food for the masses” and Wal-Mart and other discounters are not seen as competitors
Ahold Netherlands is still dominating market share while providing a barrier to new entrants:
The Dutch operations contribute with more than 30% of overall sales, having a 35% market share. Being the market leader enables the firm to have a better negotiating power reporting an outstanding margin of almost 6%
Unique cash generator:
While Ahold´s competitors have been reporting operating cash of 6%, the company has a historically 9,3% of operating cash due to soaring margins, decrease in working capital and higher depreciations.
Distinctive growth opportunities:
At the moment, the company is mostly determined in improving growth rates by increasing stores profitability (organic growth). But at a later stage, the US operations have all the necessary conditions to spread from the east to the west coast. The same situation happens in the Dutch market, where Belgium and surrounding countries are also viable options. Both of these expansions wouldn´t have currency, language or cultural barriers.
Ahold Food Retail Recomendation:BUY September 2014 Koninklijke Ahold NV Price Target € 18,85
Current Price (4th July) € 13,87
Potential 36%
Stock Ticker MAS: AH
52W Low/High (€) 12,39 - 15,50 Average Volume Trading 2,73 M Current Market Cap 11,49 B
# Shares 854,37 M
Source: Bloomberg, Google Finance
Ahold AEX Index Source: Google Finance
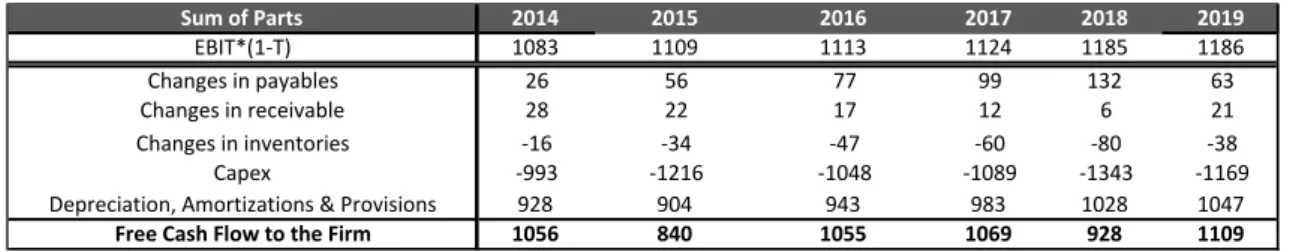
(€ millions) 2014e 2015e 2016e 2017e 2018e 2019e Revenues 33.109 33.878 34.935 36.297 38.108 38.972 EBITDA 2.372 2.382 2.427 2.481 2.609 2.629 EBITDA margin 7,16% 7,03% 6,95% 6,84% 6,85% 6,74% EBIT 1.444 1.478 1.484 1.498 1.581 1.582 Net Profit 944 1.017 1.035 1.058 1.132 1.144 Total Assets 14193 14773 15378 15700 16432 17020 Free Cash Flow 1.056 840 1.055 1.069 928 1.109
Abstract
The present dissertation aims to value the Dutch retailer group, Koninklijke Ahold NV (Ahold), implementing the theory of equity valuation. An efficient combination between theory and practice should be implemented throughout the valuation in order to obtain the most accurate result that can be complied with reality. This paper starts to introduce which different frameworks are available, explaining afterwards, which are the most relevant for the valuation of the referred company. Ahold was valued as the sum of parts of the different business geographies in which the company currently operates, using the Discounted Cash Flow approach and the Multiples valuation. Lastly, the results are compared with an investment bank research note where the divergences will be analyzed and explained.
i. Table of Contents
i. Table of Contents ... 1
1. Introduction ... 1
2. Literature Review ... 2
2.1 Valuation Methodologies ... 2
2.2 Discounted Cash Flow Approach ... 3
2.2.1 Residual Valuation- Excess Returns ... 3
2.2.2 Adjusted Present Value ... 4
2.2.3 Free Cash Flow ... 8
2.2.4 Cost of Equity ... 11
2.2.5 Cost of Debt ... 14
2.2.6 Terminal Growth Rate ... 15
2.3 Asset Based ... 16
2.3.1 Book Value Based Valuation- Accounting ... 16
2.3.2 Liquidation ... 16
2.4 Relative Valuation... 17
2.4.1 Equity vs Enterprise Multiples ... 18
2.4.2 Peer Group ... 19
2.5 Contingent Claim ... 19
2.6 Summary of Valuation Approaches ... 20
3. Ahold Valuation ... 22 3.1 Company Introduction ... 22 3.2 Brief History ... 22 3.3 Organizational Relations ... 23 3.4 Ahold Europe ... 24 3.5 Ahold USA... 25 3.6 Ahold´s Strategy ... 26
3.6.1 Ahold´s Future Strategy ... 26
4. Competitive Environment ... 27
4.1 United States of America ... 27
4.1.1 How Ahold does it ... 28
4.1.2 Comparison between Ahold in USA vs Wal-Mart (pictures) ... 30
4.1.3 USA- Possibilities of infill acquisitions and further expansion into other territories . 31 4.2 Europe- Netherlands ... 32
5. Macroeconomic Scenario ... 35
6. Risks ... 37
6.1 Systematic Risk ... 37
7. Valuation ... 39
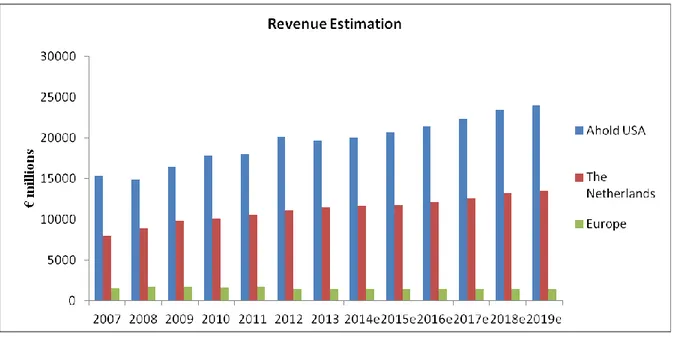
7.1 Revenues ... 39
7.2 Cost of Goods Sold ... 42
7.3 General Expenses ... 43
7.3.1 Labor Costs ... 45
7.4 Capex & Depreciation ... 46
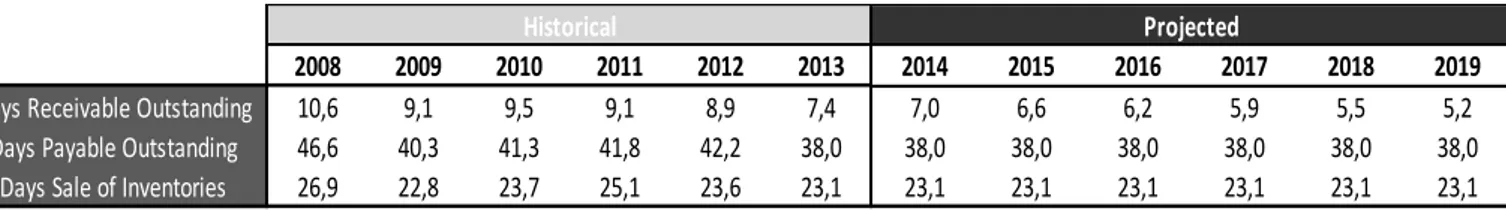
7.5 Working Capital ... 48
7.6 Debt and Interest Payment ... 49
7.7 Discontinued Operations ... 51
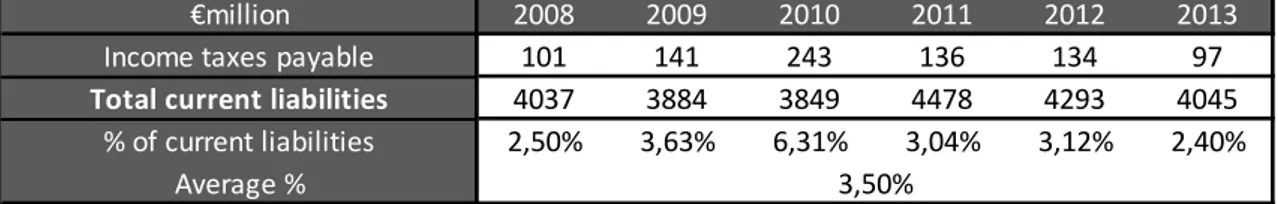
7.8 Corporate Tax & Deferred Taxes ... 51
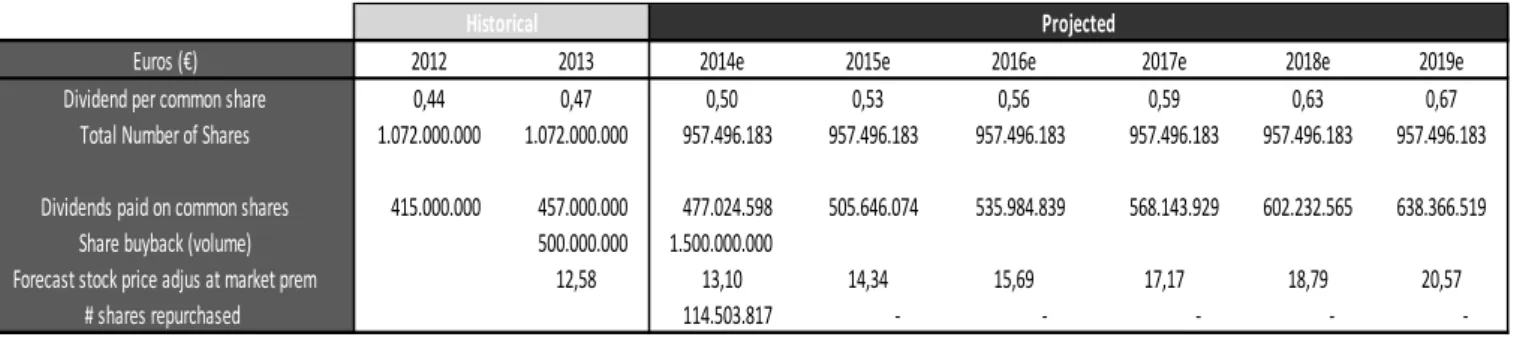
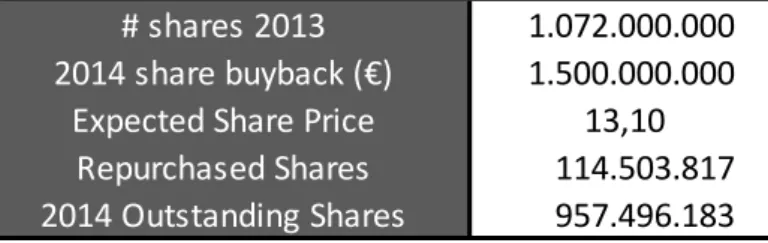
7.9 Dividends & Share Buyback ... 53
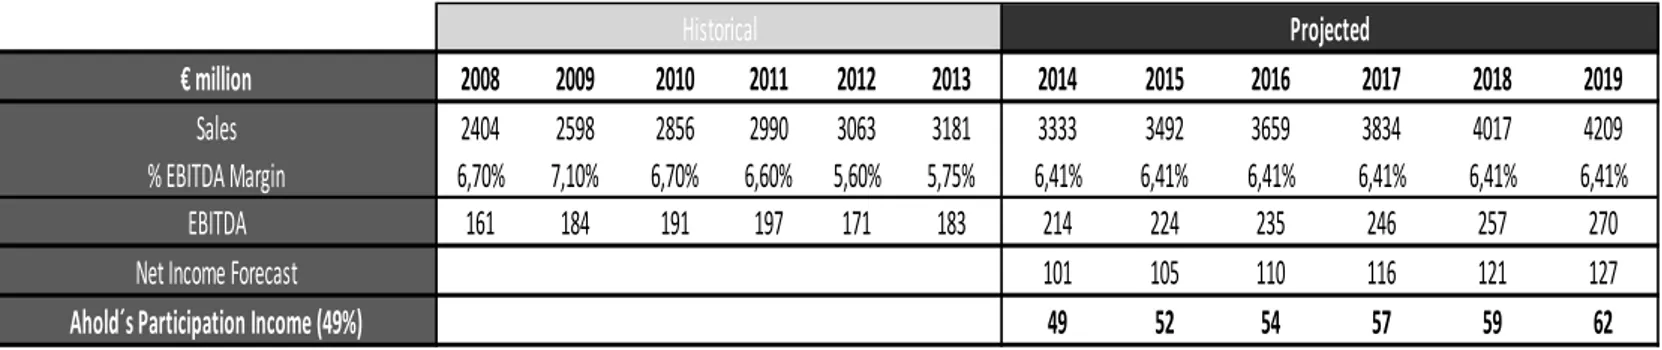
7.10 Joint Venture ... 54
8. DCF Assumptions & Valuation ... 56
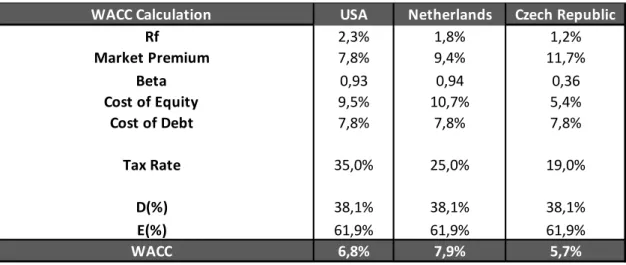
8.1 Cost of Capital- WACC ... 56
8.2 Cost of Equity ... 56
8.3 Cost of Debt ... 57
8.4 Valuation ... 58
8.5 Sensitivity Analysis ... 59
9. Multiples Valuation ... 61
9.1 Peer Group Presentation ... 61
10. Comparison with Research Note ... 65
10.1 Bank of America Merrill Lynch Forecast ... 66
10.2 BofA Valuation Considerations ... 68
11. Conclusion ... 70
Appendix ... 72
Bibliography: ... 82
I. Academic Literature ... 82
II. Research ... 84
III. Company, Industry and General Market Sources ... 84
1. Introduction
“A postulate of sounds investing is that an investor does not pay more for an asset than it is worth”
(Damodaran, 2010)
What is value?
Today, valuation is a financial analytical skill critical tool to determine the launch of a new product, enter a strategic partnership or acquire another company since it will determine how the company´s resources are allocated. The allocation of these resources will be a major driver of a company´s overall performance. Thus, the ability of performing a correct, efficient and credible valuation has been a skill not only designed for finance specialists, but also for general managers since it will be a vital factor in the company´s resource-allocation decisions. (Luehrman, 1997)
What is it used for?
As mentioned previously, value is unquestionably a useful process to determine the true value of a company; nonetheless, there are several purposes of doing so:
Value public companies: Compare the value of the stock obtained from the valuation with the current market value and therefore recommend the purchase, holding or selling of the stocks.
Initial Public Offering: Determine the fair value of a private company, which is willing to go public.
Mergers & Acquisitions: Advisory to clients (Buy and Sell side)
Resource-Allocation Decisions: How is the company creating value (drivers) and how should it allocate its resources.
The topic of this dissertation will focus mainly on the first topic mentioned previously where a final recommendation will be made based on a comparison between the fair value of the shares with their current market value. To perform such valuation, a deep
comprehension of how the company is creating value and which are their drivers will have to be understood.
2. Literature Review
2.1 Valuation Methodologies
Valuation can be treated as the heart of finance. While, in corporate finance, it is analyzed how to increase firm value through investments, financing and dividend decisions, in asset management, analysts try to identify firms that are trading for less than their true value in order to obtain a profitable investment. Comprehending what determines and how to estimate the value of a firm seems to be a prerequisite for executing sensible decisions (Damodaran, 2006).
Given the importance of valuation, it would have been thought that countless different studies and researches have been made identifying the most efficient method when determining the true value of a firm. However, there are several different methods to value a firm using very different assumptions about the fundamentals that determine value. Even though all models have their specific characteristics, it is possible to segment them in four different approaches (Damodaran, 2006):
2.2 Discounted Cash Flow Approach
In a cash flow valuation, the value of an asset is the present value of its expected future cash flows, discounted back at a rate that reflects the riskiness of these cash flows (Damodaran, A., 2006). According to the same author, this approach is the most recognized one and gets the most play in academia, coming with the best theoretical credentials. “Additionally, the value of an asset is not what someone perceives it to be worth but it is a function of the expected cash flows on that asset”.
2.2.1 Residual Valuation- Excess Returns
There are three residual income models for equity valuation that always yield the same value as the discounted cash flow valuation models: Economic Profit, Economic Value Added and Cash Value Added (Fernández, 2003). Although it is stated in the previous paper that Economic Profit and EVA are different, only the latter will be analyzed as (Copeland et al., 2000) contradict the previous statement, arguing that both measures are equal.
Many companies consider that EVA, Economic Profit or CVA are better indicators of a manager´s performance than earnings because they “refine” earnings with the quantity and risk of the capital required to obtain them (Fernández, 2003).
2.2.1.1 Economic Value Added
The economic value added (EVA) is a measure of the surplus value created by an investment or a portfolio of investments. It is computed as the product of the "excess return" made on an investment or investments and the capital invested in that investment or investments (Damodaran, 2006).
The basic objective of EVA is to create an operating measure of periodic performance that is consistent with discounted cash flow (DCF) valuation and highly correlated with current market value (O´Byrne, 1999).
EVA = (Return on Capital Invested – Cost of Capital) * (Capital Invested) = After-tax operating income – (Cost of Capital) * (Capital Invested)
The EVA is a development of the NPV formula, where the NPV of a project is the present value of the economic value added by that project over its life:
NPV=
Where:
2.2.1.2 Cash Value Added
(Fernández, 2003)
As an alternative to the EVA, the Boston Consulting Group has proposed other residual income valuation method: the cash value added method, which can be defined as the following:
Where:
ED = Annuity that, when capitalized at the WACC, the assets´value will accrue at the end of their service life
2.2.2 Adjusted Present Value
operating assets are added. Consequently, the equity value is retrieved from deducting the value of debt from the enterprise value. The major difference between these models is that the APV separates the value of operations into two components: the value of operations as if the company was entirely equity-financed and the value of the tax benefit arising from debt financing (Copeland et al., 2005). While in the conventional approach, where the effects of debt financing are captured in the discount rate, the APV approach attempts to estimate the expected dollar value of debt benefits and costs separately from the value of the operating assets (Damodaran, 2006). Therefore, the value of the business according to the APV approach will be the following:
Value of Business = Value of business with 100% equity financing + Present value of Expected Tax Benefits of Debt – Expected Bankruptcy Costs
The traditional DCF approach has been the most common approach used and taught by business schools and textbooks but only due to its standardization, not because it´s the best performer (Luehrman, 1997). According to the same author, there is a simple reason why APV should be chosen over WACC which is related with the fact that APV always works when WACC does, and sometimes when WACC doesn´t, because it requires fewer restrictive assumptions. General managers will understand that APV´s strengths lies in the added managerially relevant information it can provide. This approach will support managers interpret not only how much an asset is worth but also where the value is coming from.
2.2.2.1 Tax Shields
The debt tax shields has stimulated decades of debate regarding firm valuation and the cost of capital. While Modigliani and Miller argued in 1963 that the tax benefits of debt increases firm value and decreases the cost of using capital debt, DeAngelo and Masulis proposed in 1980 that the financial distress costs of debt offset at least some of the tax benefits (Kemsley and Nissim, 2002).
But the debate has not been only related to its benefits but also on how the tax shields should be calculated. Fernandez (2006) on his paper entitled “The Correct Value of Tax Shields: An Analysis of 23 Theories” states that there exists 23 different ways to correctly evaluate tax shields, being the most common:
Modigliani & Miller, 1963: “the value of tax shields for perpetuities in a world without costs of leverage is equal to the tax rate times the value of debt (DT). The value of tax shields, according to their third proposition, is obtained by discounting the present value of the tax savings due to interest payments of a risk-free debt at the risk-free rate”.
Myers, 1974 & Luerhman, 1997: these authors stated that the value of tax shields is equal to the present value of tax savings discounted at the cost of debt.
Harris and Pringle, 1985 & Kaplan and Ruback, 1995: these authors propose discounting these tax savings at the cost of capital for the unlevered firm.
Fernández (2004) on his paper “The Value of Tax Shields is Not Equal to the Present Value of Tax Shields”, states that “there is no consensus in the existing literature regarding the correct way to compute the value of tax shields”, yet he shows a consistent way to estimate the value of the tax savings is not by “thinking of them as the present value of a set of cash flows, but as the difference between the present values of two different sets of cash flows: flows to the unlevered firm and flows to the levered firm”.
On the other hand, Cooper and Nyborg (2005) “The value of tax shields is equal to the present value of tax shields” contradict Booth (2002) and Fernández (2004a and b) – both defend PVTS is computed from subtracting the value of unlevered firm from the value of levered firm and that the present value effect of the tax saving on debt cannot be calculated as simply the present value of the tax shields associated with interest- affirming “how inconsistent application can lead to errors that are subtle but large and that the use of incorrect formulas can result in an estimate of PVTS that is double its correct value”. These authors show that the value of the debt tax savings is the present
In summary, there isn´t still a consensus in the existing literature regarding the optimal way to calculate the value of tax shields, therefore, each company should evaluate its tax shields according to the specific characteristics of the company.
2.2.2.2 Bankruptcy Costs
As it has been seen before, there isn´t a consensus way to calculate the value of tax shields, and neither there is with bankruptcy costs.
According to Damodaran (2006), the calculation of bankruptcy costs is the third and last step of the adjusted present value approach. This step is crucial to evaluate the effect of the given level of debt on the default risk of the firm and on expected bankruptcy costs.
PV of Expected Bankruptcy Costs = (Probability of Bankruptcy) (PV of Bankruptcy Costs)
The issue is related with the fact that neither the probability of bankruptcy nor the bankruptcy cost can be estimated directly. According to the same author, there are two basic ways in which the probability of bankruptcy can be estimated indirectly. The first one is to use bond rating as a reference since the companies with better ratings will consequently have a less probability of bankruptcy. The other way is through statistical approach to estimate the probability of default, based upon the firm´s observable characteristics, at each level of debt.
Yet, costs of distress span far beyond the conventional costs of bankruptcy and liquidation since research that has been looking at this subject has concluded that direct costs of bankruptcy are very small, relative to the firm value. The awareness that the company is in distress can cause serious damage to its operations, as its major stakeholders (customers, suppliers, employees, etc.) can react negatively and consequently make the perception of distress into a reality. In the same paper, it is stated that the magnitude of these costs can range from 10-25% of firm value.
Even though, nowadays the average and generally accepted number to estimate bankruptcy costs is around 20% of the value of the firm, this assumption was highly
opposed by Miller, Merton H. in 1977 on his paper “Debt and Taxes”, defending that this figure makes no sense since was derived from a study given to small businesses, mostly proprietorships and typically undergoing liquidation rather than reorganization. Additionally, Miller states that the only study he has knowledge about where costs of bankruptcy were being evaluated for large, publicly-held corporations is that of Jerold Warner (1977) “Bankruptcy Costs: Some Evidence”, where a sample of eleven railroads that filed in bankruptcy between 1930 and 1955 were averaging 5.3 percent of the market value as bankruptcy costs.
2.2.3 Free Cash Flow
2.2.3.1 Free Cash Flow for the Firm
Also known as FCFF, it´s an indicator of the firm´s profitability after all expenses and reinvestments have been subtracted. This firm valuation approach, unlike the following models that will be discussed, values the firm rather than equity.
FCFF = EBIT (1 – t) + Depreciation – CAPEX – Changes in Net Working Capital
Where:
The advantage of using firm valuation approach instead of valuing the equity solely is that cash flows relating to debt do not have to be considered explicitly since the FCFF is a pre-debt cash flow while they have to be taken into account in estimating FCFE. In situations, where the leverage is expected to shift significantly over time, this is a significant saving, since estimating new debt issues and debt repayments when leverage is changing can become increasingly difficult as time goes through (Damodaran, 2006).
Despite the mentioned advantage, the value of equity obtained from the firm valuation and equity valuation methods should be the same if assumptions about financial leverage are made consistently.
In order to obtain the value of the firm, it is necessary to discount the expected FCFF at the weighted average cost of capital, also known as WACC, which is a calculation of a firm´s cost of capital derived from different sources (equity, debt and hybrid). Finally, to reach the equity value of the firm its is required to deduct from the value of the firm non-equity claims:
Equity Value =
2.2.3.2 FCFE
As stated by Damodaran (1994), FCFE is a measure of free cash flow to equity that captures the cash flow left over all reinvestment needs and debt payments:
FCFE = Net Income + Depreciation – CAPEX – Change in non-cash Working Capital – (New Debt Issued – Debt repayments)
According to Buffett, investors should focus more on this approach, as he calls “owner´s earnings”, which can be defined to be cash flows left over after capital expenditures and working capital needs, a measure of free cash flow to equity that ignores cash flows from debt.
Regarding this approach, it is necessary to discount the FCFE at the required rate of return expected by shareholders (cost of equity) in order to reach the value of the firm´s equity:
2.2.3.3 Capital Cash Flow
Ruback (2000), presents an alternative method for valuing risky cash flows: the capital cash flow method since the cash flows include all of the cash available to capital providers, including the interest tax shields. The discount rate is the same expected return on assets that is used in the before-tax valuation. Because the benefit of tax deductible is included in the cash flows, the discount rate does not change when leverage changes.
Although this method treats interest tax shields differently when compared with Free Cash Flow, the two methods are algebraically equivalent. The main advantage of Capital Cash Flow is its simplicity since the interest tax shields are included in the cash flows, which will consequently be less prone to error.
2.2.3.4 Dividend Discount Model
DDM is an approach used to value the price of a certain stock by using predicted dividends and discounting them back to present value. The logical of this procedure is that if the value obtained from DDM is lower than what the shares are currently trading in secondary markets, then the stock is overvalued.
Damodaran (2006) states that when investors buy stocks in publicly traded companies, they generally expect to get two types of cash flows- dividends during the holding period and the expected price at the end of the holding period. Since this expected price is itself determined by future dividends, the value of a stock is the present value of dividends through infinity:
Value per share of stock = Where:
The main attractions are its simplicity and its intuitive logic since dividends represent the only cash flow from the firm that is tangible to investors. Also that the use of this model requires fewer assumptions to forecast dividends than when compared to forecasted free cash flows, which requires assumptions about capex, depreciation and working capital. On the other side, this model has also some negative points as many firms choose to hold back cash instead of paying it to stockholders or simply not distribute dividends at all.
2.2.4 Cost of Equity
The notion that riskier investments should return higher expected returns when compared to safer investments, in order to be considered good investments, is quite intuitive. Therefore, the expected return on any investment should be the sum of the risk-free rate with an extra return reflecting the risk exposure. According to Damodaran (1999), there are four models available to measure risk: (1): The CAPM, (2): Arbitrage pricing model, (3): Multi-factor model and (4): Proxy model. I will give major focus on the CAPM model throughout this dissertation since it´s the most common used model in the academic community and investment banking.
Even though Fama and Frech (2004) defend on their paper “The Capital Asset Pricing Model: Theory and Evidence” that there are some empirical problems involved in the CAPM model that will consequently invalidate its use in applications- mostly related with variables like size, various price ratios and momentum- the CAPM model is still one of the most used approaches to measure risk.
The general idea behind CAPM is that investors have to be compensated in two ways: time value of money and risk. Time value of money will be correlated with the risk-free rate while the risk will be measured by the other half of the CAPM formula. In order to obtain the expected return, CAPM is composed by three different variables: risk-free rate, beta of the security and an expected market return:
2.2.4.1 Risk-Free Rate
Damodaran (2008)
It is usually assumed as an easy task, in corporate finance and valuation, to calculate the risk-free rate in order to give more focus and attention into the risk variables of the CAPM formula. But is the risk-free rate that simple to obtain?
Firstly, it´s important to clarify the meaning of a risk-free asset. Risk in finance is viewed in terms of the variance in actual returns around the expected return. Thus, for an investment to be risk-free, then the actual returns should always be equal to the expected return. There are two major requirements for an investment to be considered risk-free:
(1): There can be no default risk: This constraint automatically excluded “any security issued by a private firm, since even the largest and safest firms have some probability of default risk”. Thus, only governments can meet this condition due to their ability of printing money and consequently meet their debt obligations, at least in nominal values.
(2): No reinvestment risk: A 5-year treasury bond is not risk-free since the coupons on that bond will be reinvested at rates that cannot be predicted today. Therefore, only zero coupon bonds can be considered risk-free as there is no possibility of reinvestment since there are no coupon payments.
In summary, only zero coupon government bonds can be considered risk-free rate securities.
2.2.4.2 Levered Beta
(Aswath Damodaran “Estimating Risk Parameters”)
(1): They measure risk added on to a diversified portfolio, rather than total risk. Therefore, it is feasible for an investment to be high risk, in terms of individual risk, but to be low risk, when compared to the market risk.
(2): They measure the relative risk of an asset and therefore are standardized around one.
The beta for an asset can be calculated by “regressing the returns on any asset against returns on an index representing the market portfolio, over a reasonable period”:
Where:
b = Levered beta
Although, the estimation of the beta seems fairly simple and linear, there are some issues that should be mentioned:
Choice of Market Index: There aren´t any indices that have the ability to measure or even come close to the market portfolio. Thus, there are equity markets and fixed income market indices that measure the returns on subsets of securities in each market. In order to choose which indices will give the best beta estimate, it is suggested to pass through a “market portfolio” test: indices with a higher number of securities should provide better estimates than indices with fewer and indices that are market-weighted should yield better estimates than indices that are not. A good example of an indice with such characteristics is the S&P 500, which includes the market weighted of the 500 largest firms.
Choice of Time Period: The main idea behind the choice of time period is related with the fact that the goal is to estimate the best beta for the future with available past data. With this said, the more we go back further in time, we get the advantage of
having more observations in the regression but on the other side, the company may have changed its fundamental characteristics.
Choice of Return Interval: Shorter return intervals raise the number of observations in the regression for any given time period but securities that do not trade on a continuous basis, the beta estimated can be affected. The lack of trading problem can be solved through the use of longer return intervals or using short return interval returns and then adjusting these betas for the extent of the non-trading.
2.2.4.3 Equity Risk Premium
The risk premium is the last variable to measure the cost of equity in the CAPM model. It can be defined as the excess return that a security or the overall stock market provides over a risk-free rate. According to Damodaran (2013), there are three basic approaches to estimate equity risk premiums:
(1): Survey approach: Investors and managers are asked to assess the risk-premium and the implied approach, where a forward-looking estimate of the premium is estimated using either current equity prices or risk premiums in non-equity markets. (2): Historical return approach: The premium is based upon how well equities have performed in the past
(3): Implied approach: Future cash flows or observed bond default spreads are used to estimate the current equity risk-premium.
2.2.5 Cost of Debt
The last key input necessary to measure the weighted average cost of capital (WACC) of a company is the cost of debt. According to Cooper & Davydenko (2007), existing methods often overlook the possibility of default, which will possibly cause significant errors in WACC estimated. It is also mentioned that little research attention has been made on this subject.
The authors suggest the following formula to calculate the cost of debt:
Cost of Debt = Promise yield – Yield equivalent of expected default loss
Copeland et al. (2005) recommends that during the calculation of the cost of debt, one should separate non-investment-grade companies from investment-grade companies (debt rate at BBB or better). For the latter, yield to maturity is a suitable proxy while for the companies with below investment-grade debt it is suggested to use APV on the unlevered cost of equity rather than the WACC to value the company. Since Ahold has its debt rated with BBB or better (investment-grade), the yield to maturity will be used to measure the cost of debt of this company, according to the following formula.
Price =
2.2.6 Terminal Growth Rate
The value of a company is determined by the sum of the present value of cash flow during explicit forecast period with the present value of cash flow after explicit forecast period. The second term, also known, as continuing value, it´s the value of the company´s expected cash flow after the explicit period has been calculated. This will eliminate the need of forecasting in detail the company´s cash flows over an extended period, considering that that company is on a steady state and therefore the growth rate is constant. Since this continuing value will be a very determinant factor for the company´s final value, the estimation of the growth rate is crucial for a correct valuation.
Copeland et al., (2005), suggests the following formula when using the enterprise DCF model:
Continuing value = Where:
g = The expected growth rate in NOPLAT in perpetuity
ROIC = The expected growth rate of return on new investment
2.3 Asset Based
When valuing a business, it can be argued that the value of a business is the sum of the values of the individual assets owned by the business. In a going concern valuation, there has to be precise judgments on existing investments and expected future investments in order to obtain a precise valuation. Contrarily, in an asset-based valuation, there is a major focus on the assets in place and its separate evaluation. For companies with lucrative growth opportunities, asset-based valuations will yield lower values than going concern valuations.
2.3.1 Book Value Based Valuation- Accounting
As stated by Daniels (1934), income statements would provide a measure of the true earnings potential of a firm while the balance sheet would yield a reliable estimate of the value of the assets and equity in the firm.
The previous thought was challenged by Damodaran (2006) as it affirms that a possible book value to be a reasonable proxy for the true value of a business will depend in the current stage of life cycle that the company is facing. According to the second author, companies facing significant growth opportunities where they can generate excess returns, book values will be much lower from its true value as growth opportunities are not being considered into the valuation. Oppositely, mature firms that are facing low growth opportunities with predominantly fixed assets, the book value of the assets may yield a reasonable measure of the true value of these firms.
2.3.2 Liquidation
The second type of asset-based valuation is the liquidation valuation, where the valuation is based with the assumption that “the assets have to be sold now. In theory,
individual assets but the urgency to liquidate those assets quickly may result in a discount on the value” (Damodaran, A., 2006).
It is possible to make a straightforward comparison between liquidation valuation with book value of assets and discounted cash flow value. “While it is not unusual to see analysts assume that liquidation value will be a precise percentage of book value and that the latter operates as a proxy for abandonment value in many firms” (Berger, Ofek and Swary, 1996), the relationship between liquidation and discounted cash flow value is more difficult to discern.
It is logical to believe that liquidation value should reflect a lower value than discounted cash flow as the first approach will not reflect the value of expected growth potential, contrarily to the second one. Furthermore and already stated previously, the urgency associated with the liquidation of the assets will possibly have a negative impact on the proceeds since there will be a potentially discount given to the buyer (Damodaran, A., 2006).
2.4 Relative Valuation
In relative valuation, also known as multiples approach, an asset is valued based upon how similar assets are prices in the market. Per example, a house buyer will decide how much he is willing to offer for a certain house, after analyzing at what prices similar houses were negotiated in the same neighborhood (Damodaran, A., 2006). Additionally, while in discounted cash flow the intrinsic value of an asset is estimated based upon its capacity to generate cash flows in the future, in relative valuation, a judgment will be made according to how much an asset is worth by looking at what the market is paying for similar assets.
According to the same paper, there are three crucial steps in relative valuation: (1) finding comparable assets that are priced by the market, (2) scaling the market prices to a common variable (3) and adjusting for differences across assets.
Although, agreeing that the multiples approach can be a very useful and simple valuation tool, Goedhart et al,. (2005), believe that multiples are often misunderstood
and, even more often, misapplied, suggesting that the utilization of industry average is somehow biased as companies even though belonging to the same industry and peer group, can have drastically different expected growth rates, returns on invested capital and capital structures. Additionally, different multiples can suggest conflicting conclusions: on this situation, the Best Buy vs Circuit City ‘example is given, explaining that when both companies are measured using its respective enterprise value multiples Best Buy trades at a premium (6.3 versus 4.4) but at a discount according to their P/E ratios (13.8 versus 22.3). The last issue regarding this method of valuation is related with the fact that different multiples are meaningful in different contexts. Despite the previous limitations mentioned by Goedhart et al (2005), Schreiner and Spremann (2007), have made an empirical study where they affirm that there is a direct proportionality between market values and multiples. On their study, a dataset of 600 European firms was used with a comprehensive list of multiples for the ten-year period from 1996 to 2005 with the cross-sectional analysis assuming correlation between market values and its multiples.
Therefore, being conscious about some of the limitations of this valuation approach but also with the awareness of its advantages, this valuation tool will be used on this dissertation to obtain the value of Ahold.
2.4.1 Equity vs Enterprise Multiples
As it was mentioned previously, relative valuation it´s a very simple and practical valuation tool used to value companies but there are several multiples than can be used. These multiples, according to Suozzo et al. (2001) should be divided into two different groups:
Enterprise multiples: reflect the value of the entire enterprise, relative to a statistic that relates to the entire enterprise, such as sales or EBIT. The most relevant enterprise multiples are: EV/Sales, EV/EBITDA, EV/EBIT, EV/NOPLAT, EV/FCFF and EV/Invested Capital.
Equity multiples: expresses the value of shareholders ´claims on the assets and cash flow of the business. The most relevant equity multiples are: Price/Earnings, Price/Cash Earnings, Price/Book Value, Price/Earnings Growth and Dividend Yield.
2.4.2 Peer Group
In order to evaluate a company using multiples, a peer group should be strictly chosen to avoid significant discrepancies between its multiples value and its fair value. Often, companies disclose its major competitors on its annual report but many of them opt to not do so, which will impose the following question: How to choose a peer group? The main scheme behind choosing the right peer group is selecting companies whose underlying characteristics are similar to the company you are evaluating, such as, production methodology, distribution channels, research & development, growth prospects and ROIC (Koller at al., 2010).
2.5 Contingent Claim
“Over the past decades, theoretical and computational advances have allowed finance practitioners to adapt financial option pricing techniques to the valuation of investment decisions, so-called real options. Option pricing methods are superior to traditional DCF approaches because they explicitly capture the value of flexibility” (Copeland et al., 2005)
Because it handles simple contingencies better than standard DCF models, option-pricing theory has been regarded as a promising approach to valuing business opportunities since the mid-1970s. However, real businesses are much more complicated than simple puts and calls. Just setting up the valuation problem, never mind solving it, can be daunting. As a result option pricing has not yet been widely used as a tool for valuation opportunities (Luerhman, T., 1997).
The discounted cash flow model operates as a basic framework for most analysis. In investment analysis, for instance, the conventional view is that the net present value of the project is the measure of the value that it will add to the firm taking it. In recent
years, this framework has come under some fire for failing to consider the options that are embedded in each of these actions. For instance, the net present value of the project does not capture the values of the options to delay, expand or abandon a project (Damodaran, A., 2005).
However, despite the obvious advantages of the real options valuation approach, this method will not be used to evaluate Ahold, since contingent claim valuation is very useful for valuing specific situations where a company has a future option (Damodaran, A., 2006), which is not the case. Additionally, option valuation is considered one of the most complex valuation frameworks (Richardson, Mark., 2009) There are several different models utilized throughout the contingent valuation approach, such as: Black-Scholes, Binomial model, Monte Carlo or The Greeks but since any of these methods will be used on this dissertation due to the reasons explained previously, I will not explain them individually.
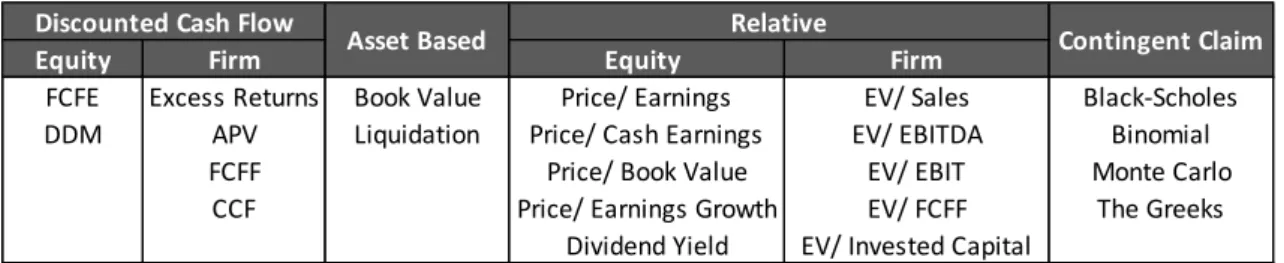
2.6 Summary of Valuation Approaches
Table 2 reflects what was argued previously by several different authors regarding the existing valuation approaches and each of its models. There are other countless methods to evaluate companies but according with what I have read, I believe that the ones mentioned in table 2 reflect the most used in academia and investment banks.
Table 2: Valuation Approaches and its Methods
Equity Firm Equity Firm
FCFE Excess Returns Book Value Price/ Earnings EV/ Sales Black-Scholes DDM APV Liquidation Price/ Cash Earnings EV/ EBITDA Binomial
FCFF Price/ Book Value EV/ EBIT Monte Carlo
CCF Price/ Earnings Growth EV/ FCFF The Greeks Dividend Yield EV/ Invested Capital
Relative Discounted Cash Flow
Contingent Claim Asset Based
2.7 Emerging Markets
There are some characteristics that are common between emerging markets and consequently affect the valuation of its firms, such as: currency volatility, country risk, unreliable market measures, information gaps and accounting differences, corporate governance and discontinuous risk. These specific characteristics will impose more challenges to analysts that will have to value emerging markets than those who have to value developed market companies (Damodaran, 2009).
Thus, some adjustments have to be made when valuing a company on emerging markets but according to Ahold´s 2013 annual report there are only three major markets in which the company is operating: USA, The Netherlands and Czech Republic. According to FTSE Group1, developed countries have to meet a certain criteria under the following categories: 1) High income economies, 2) Market and Regulatory EMG, 3) Custody and Settlement, 4) Dealing Landscape, 5) Derivatives and 6) Size of Market. Not only FTSE Group but MSCI, S&P, DOW and Russell, recognize the USA and the Netherlands as developed markets in 2012 and since Czech Republic´s net sales only represent circa 5% of total net sales of 2013, the valuation of Ahold will be performed as the company only operates in developed countries.
1
FTSE Group is a British provider of stock market indices and associated data services, wholly owned by the London Stock Exchange.
3. Ahold Valuation
3.1 Company Introduction
Ahold is an international retailing group based in the Netherlands with strong consumer brands in Europe and the United States. By 2012, the company had 3,074 stores, serving a trade area of around 80 million people and with a current number of circa 225,000 employees.
3.2 Brief History
In 1887, Albert Heijn opened a small grocery store in Oostzaan, The Netherlands. The grocery grew through the first half of the 20th century and in 1948 went public on the Amsterdam Stock Exchange. By 1970, the company was already the largest grocery store in the Netherlands and started expanding its business into different segments: liquor, health and beauty care. In 1973, the holding company replaced its name to “Ahold,” an abbreviation of “Alber Heijn holding”.
In the mid-1970s, Ahold started its international expansion by acquiring companies in Spain and the United States. At that time and until 2000, the growth was accelerated through acquisitions in Latin America, Central Europe and Asia. A few years later, the company decided to divest all its operations that were not achieving a sustainable position in the market which lead to the exit of the Latin American and Asian market; Europe and the United States were now the core markets.
During 2011, Dick Boer who was announced as CEO of the Ahold, reported a new phase of its growth strategy which were based on six different pillars: increasing customer loyalty, broadening offering, expanding geographic reach, simplicity, responsible retailing and the people performance.
3.3 Organizational Relations
Chart 1: Ahold´s Organizational Chart, Ahold Annual Report
The company operates its business from two continental platforms: Ahold Europe and Ahold USA, each of them led by a COO, which reports to Ahold´s CEO.
Ahold Europe includes Albert Heijn in the Netherlands and Belgium; Etos, Gall & Gall, and albert.nl in the Netherlands and Albert in Czech Republic.
Ahold USA is settled into four different divisions: Giant Carlisle, Giant Landover, Stop & Shop New England and Stop & Shop New York Metro.
Finally, Ahold has 60 percent interest in ICA AB (ICA) and a 49 percent in Jerónimo Martins in Portugal. In March of 2013, Ahold successfully divested its stake in ICA for €2 5 billion to focus on its core business, maintaining the joint venture with Jerónimo Martins.
Today, Ahold is mainly concentrating its operations in two main regions: Europe and United States.
3.4 Ahold Europe
Albert Heijn: Established in 1887 by Albert Heijn, it’s the leading food retailer in the
Netherlands with its mission being “to make the ordinary affordable and the extraordinary attainable” for customers. Albert Heijn has more than 930 stores throughout the Netherlands and Belgium operating in three different formats: the neighborhood grocery store, the larger version as a hypermarket and also as a “to go” convenience store.
Etos: Established in 1918 but only joining Ahold in 1973, Etos solely operates in the
Netherlands and it´s considered one of the largest drugstore chains in the country, offering a wide selection of health and beauty, body care and baby care products at affordable prices.
Gail & Gali: Operating in the Netherlands, this brand is the leading wine and liquor
retailer with an extensive range of quality products, a high-quality service and expert advice.
bol.com: Having a customer data base of more than three million people, this is the
number one online retailer in the Netherlands and has a growing presence in Belgium. It offers non-food products delivered direct to people´s homes. Currently, employs 400 people and it has opened 700 pick-up points to give customers an alternative way to obtain their orders. Established in 1999, joined Ahold in 2012.
Albert: One of the best-known brands in food retail in the Czech Republic and Slovakia2
with a focus on fresh products, friendly staff and good value.
Pingo Doce: Ahold currently holds a joint venture with one of the largest supermarket
chain operating in Portugal that started back in 1992. Pingo Doce has a very similar business strategy when compared to Ahold due to its public target and its product offering. Pingo Doce guarantees low prices and good service, with a focus on healthy fresh meals.
3.5 Ahold USA
Giant-Carlisle: Operating in Connecticut, Massachusetts, New Jersey and New York,
this brand operates in the supermarkets and superstores format.
Martin´s: Belongs to the Giant Carlisle division, which was settled in 1923. It
distinguished itself with an extensive selection level and value for the money. At the end of 2012, Giant Carlisle operated 200 supermarkets under the name Giant Food Stores and Martin´s Food Markets and 100 fuel stations, while employing more than 32,000 people.
Stop & Shop: Organized into two different divisions: Stop & Shop New England and
Stop & Shop New York Metro, this brand operates with superstores, full-service pharmacies and conventional supermarkets with a total number of employees around 64,000 and approximately 400 stores and 100 gas stations. It is also known for being technology driven, giving the opportunity to its customers to shop through smart phones and Internet.
Giant-Landover: Currently with 170 supermarkets and 14 fuel stations, the brand is
focusing on strengthening its own-brand offerings and placing a strong focus on its fresh variety and thriving customer loyalty programs. 21,000 people are employed by Giant-Landover.
Peapod: Last brand to join Ahold in 2000, its business is mainly focused in online
grocery ordering and delivery. The brand is currently serving customers from twelve different states and sales have been growing.
3.6 Ahold´s Strategy
Vision: “To offer better choice value, and a better life to all of our stakeholders- our customers, associates, suppliers, shareholders, and the communities we serve- every day”
3.6.1 Ahold´s Future Strategy
In November 2011, Dick Boer, Ahold´s CEO appointed in the same year, declared that the company would go through a new phase of growth strategy, “Reshaping Retail”, which was based on six essential pillars.
According to the company´s 2011 annual report, the first three pillars are focused to create growth while the latter three on how growth will be enabled.
Increasing customer loyalty: customer loyalty initiatives will generate between one and two percent to identical sales growth and the ability to retain most of the customers and gaining new ones is essential for the success of this business.
Broadening our offering: Ahold´s business is growing by their ability to correspond to customer´s changing needs. Online sales are expected to grow to €1,5 billion by 2016, different formats of stores are being developed to serve customers‘ needs with the opening of at least 150 convenience stores in Europe by 2016 and finally, a better selection of products available is being analyzed in order to maximize client needs, with new innovative and own-brand products.
Expanding our geographic reach: besides the opening of 60 new stores in Belgium, the firm is looking for new geographic opportunities where it is possible to achieve sustainable profitable growth.
Simplicity: this pillar is defined by the ability of lowering costs, decreasing risks and working more efficiently. The company has launched a €350 million cost savings program (2012-2014) in order to create more value for clients.
Responsible retailing: the source of the products being sold to customers, the impact on the environment, communities served and people employed are critical factors to achieve a clear and ambitious corporate responsibility.
People performance: the last pillar is based on the attraction and development of the best talent in the industry to help the company achieve its growth ambitions.
With this new strategy implemented, the company would be able to benefit from changing customer behavior and retail trends and remain its competitiveness and sustainability.
4. Competitive Environment
4.1 United States of America
As mentioned previously, the US operations are critical for Ahold´s results as they represent more than 60% of total revenues for the company. Thus, in order to understand what is driving the firm´s sales, a careful analysis about its competitors and how Ahold´s positions itself in the market should be done.
For the past years, Ahold has been faced with a very competitive environment where the company is up against the rise of Target, Trader Joe´s, Whole Foods, the discounters, clubs and mainly, Wal-Mart. Yet, they have been able to defend and raise their local market shares due to its distinctive retail offering.
There have been some seismic shifts throughout the 286 US metropolitan stores where Ahold currently operates from 2008 to 2013, mainly:
The number of competitor chains has risen, in average, from 15 per market to 17. (Appendix 1)
For the same period, the average number of stores has increased from 151 to 164 in each local market. (Appendix 2)
New entrants have managed to gather 7,7% of market share in the local markets that Ahold operates. Consequently, among the incumbents there have been some variations between winners and losers. (Appendix 3)
With this said, it would be expected for Ahold to considerably drop its market share throughout this five years period due to this large shift in the competitive environment. Surprisingly, and analyzing both Appendixes 4 and 5, it is possible to observe that Ahold did not lose any market share to its competitors between 2008 and 2013, even gaining an irrelevant percentage. 3
4.1.1 How Ahold does it
The ability to maintain market share while the overall market is being raided by new competitors is not by offering the cheapest price and compete with big retailers, such as Wal-Mart, but to have the right price to match retail offer. Ahold´s goal is not to compete with the discounters on price but to offer something distinct to attract new customers. In this case, the company´s distinctive offer is “quality food for the masses”. For instance, while Ahold´s message is “we love food”, Wal-Mart´s message is related with their cheap prices “we sell products cheaply”. These different messages will automatically separate the target consumer of each company.
The way Ahold tries to differentiate from its main competitors in the discount segment is easily seen by the way that stores are settled:
The stores feel very food focused: In Ahold stores, the customer is faced with a large range of fresh and quality food, while its competitors (e.g. Wal-Mart, Tesco) offer bigger stores with less food focus.
While most products are pre-packed with less appealing range, Ahold enables customers to feel and smell the products giving a more fresh feeling.
The bakery, deli and other counters have more appealing offerings when compared to Wal-Mart and discounters.
Ahold offers a mix between branded and own label products, which enables the differentiation between target customers. Its loyalty card program is essential for customer engagement.
At Ahold stores, customers have the feeling they are shopping at a local mini market with a personalized service with employees available to help at any time while at Wal-Mart it feels like shopping at a big warehouse without any type of assistance.
4.1.2 Comparison between Ahold in USA vs Wal-Mart (pictures)
Pictures of different stores of Ahold in the American market
4.1.3 USA- Possibilities of infill acquisitions and further expansion into
other territories
Forecasting the company´s expansion and acquisition strategy could be seen as a challenging task, taking into consideration that the provided information on the company´s annual reports barely refers its future strategy. Still, Ahold is very well positioned to improve the growth rates registered in the past few years, since Ahold´s US operations are mainly concentrated on the east seaboard of the country which enables the firm to expand through the opening of new stores in neighbor areas that rely on the same supply chain and central management. These expansion possibilities would be:
Low risk: currency and sovereign risk would maintain the same, which would enable the company to use the same business formats that have been successful in other locations.
Low cost: With the existence of a settled supply chain, there is no need to create a new one, which consequently reduces costs with the opening of new stores.
Limitless: As seen before, Ahold and Wal-Mart can co-exist since they target different customers, meaning that there is no limit restriction regarding locations where Ahold can expand.
Unlike the European market, the American market facilitates expansion through acquisitions, with the market being very fragmented with lots of smaller and regional players as it is shown in graph 1. These smaller local players provide Ahold more opportunities to make strategic acquisitions, gain market share, without enlarging the industry.
Graph 1: Average market share in food retailing (2nd to 5th), PlanetRetail
4.2 Europe- Netherlands
Even though, the United States has almost twenty times the population of the Netherlands, one can identify some similarities between the American and the Dutch food retailer market:
Both contain specialist-localized players (e.i. Redner´s Markets and Jumbo Supermarkten).
Bigger international players are present in both markets, stealing significant market share from local players.
Ahold has been a dominant player in both markets with growing market shares for the past years. In the Netherlands, Albert Heijn has increased its market share from 21% to 31% from 2006 to 2012
Both have experienced a consolidation of their markets over the last few years, as it can be seen on graph 2.
Graph 2: Ahold´s market share in the Netherlands vs. its competitors, PlanetRetail
Notwithstanding, Ahold, more specifically Albert Heijn, has been achieving an outstanding performance when it comes to increasing market share. However, the discounters should be taken into account: discounters have been improving their market share (especially Lidl, which increased its market share from 3% in 2006 to 8% in 2012) and have been extracting significant market share from the industry.
Therefore, the major question that should be asked is the following: Can Ahold cope with the discounters continuing to improve their market share and their offering? My point of view relies on the fact that Ahold has all the necessary conditions to continue its successful path for the next years, for the following reasons:
This situation is not unfamiliar for Ahold. In the United States, the industry has been through the same pattern that is being registered at the moment in the Netherlands and Ahold has managed not only to survive but also to gain some market share with increasing revenues. Ahold has been able to co-exist with Wal-Mart, creating a kind of duopolies in many regions. With this said, there is no reason to believe why Ahold can´t use the same strategy in the Netherlands where they co-exist and complement with the discounters.
The Netherlands is a relatively small market, reducing its competitiveness. Contrarily to the United Kingdom, there aren´t big players established (e.g. equivalent to Sainsbury´s) that can discontinue its growing pattern.
Ahold has been implementing the same strategies as it did in the United States:
Differentiate: Distinguish from the discounters by creating sections in their stores for better quality fresh food.
Price hygiene: Decrease own label prices and promote them heavily. Even if customers don´t buy those products, they will have the idea that Ahold is practicing low and fair pricing.
In summary, Ahold has the potential to follow the previous trend seen in the east coast of the United States, assembling an increased segmented market, majorly controlled by duopolies between value and better quality retailers. With all the points mentioned before, Ahold will extract some market share from the more middle ground retailers and impose its dominant position in the market.
Before proceeding to Ahold´s valuation there is a crucial step understanding in which market conditions is the company operating to comprehend the prospects for the future. According to Ahold´s 2013 annual report, the firm operates in three different areas: The Netherlands (Belgium and Germany are also included), United States of America and Czech Republic; the latter only representing 2% of total underlying operating margin, with The Netherlands representing 42.7% and USA with 55.3%. Therefore, a macroeconomic look will not be made for Czech Republic as it would be irrelevant if a significant change would happen in this country since its contribution for the company´s overall results is very low.
5. Macroeconomic Scenario
As Ahold operates in the Retail/ Fast Moving Consumer Goods, it is important to identify which macroeconomic indicators can directly affect the firm´s operations and its growth prospects. Related to this specific industry in both countries (the Netherlands and USA) a few economic indicators were identified that will impact the company´s processes which will consequently influence financial results:
Consumer Confidence: Measures consumer´s attitudes towards current and future economic conditions. It´s a relevant indicator to the economy as consumer spending drives circa 70% of economic growth; low consumer confidence will impact negatively consumption and the economy will slow further.
Consumer Price Index Economic Indicator: The CPI can be defined as a measurement of prices of mostly everything available to acquire, from 80,000 different consumer items. Therefore, deflation occurs when this index decreases in value and inflation occurs when the value is increased. The CPI indicator is extremely important and used by Federal government to adjust or implement new economic regulations in order to control inflation.
Unemployment Rate: As the name suggests, reflects the amount of people currently jobless. There are some specific rules to determine if someone is considered or not unemployed, as in order to be considered unemployed you have to be without a job but also be actively looking for one in the past four weeks. Besides being a lagging indicator- measure the effect of economic events- it´s a powerful confirmation indicator of what other indicators have previously showed. Once again, this will be a very useful tool for the Federal Reserve to evaluate the economy´s health before determining which monetary policies will be applied.
Gross Domestic Product: GDP measures the country´s growth, which describes how quick the economy is growing. Emergent economies will have a positive impact in consumer spending.
The Interest Rate Economic Indicator: Reflects the percent charged for the lending of money. This percent charged will influence how consumers are willing to take bank
loans that will consequently affect consumer spending. Other things being equal, low-interest rates will incentive consumers to ask for more bank loans.
Crude Oil Prices Economic Indicator: This is the least obvious indicator on how it can have impact on the retail industry as we have seen how the previous ones influence mainly consumer spending. Crude oil prices measure the spot price of various barrels of oil. This indicator does not have the same impact as the previous ones have on the consumer´s perspective but it mostly impacts the firm´s operations, such as, cost of manufacturing, transportation and utilities that rise along with the cost of crude oil, which will consequently affect the company to increase prices to absorb those higher costs.
United States Economic Forecasts Last Q3 Q4 2015 2020 2030
Unemployment Rate 6,10% 6% 5,90% 6% 5,60% 5,70%
GDP Annual Growth Rate 2,50% 1,80% 2,31% 2,32% 2,72% 2,72%
Consumer Confidence 84,6 83,14 83,19 83,13 89,36 93,61
Retail Sales YoY 5% 4,11% 4,33% 4,26% 4,15% 4,15%
Consumer Price Index CPI 237,9 241 243 255 355 500
Food Inflation 2,43% 1,92% 2,00% 1,68% 2,02% 1,52%
Government Bond 10Y 2,61% 2,80% 2,90% 3,50% 4,20% 4,00%
Interest Rate 0,25% 0,25% 0,25% 0,75% 3% 5%
Table 3: United States Economic Forecast, Trading Economics
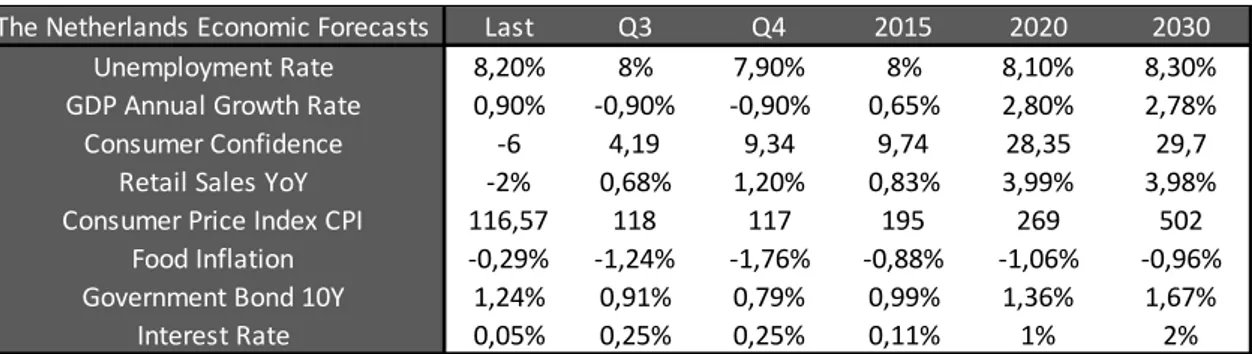
Table 4: The Netherlands Economic Forecast, Trading Economics
The Netherlands Economic Forecasts Last Q3 Q4 2015 2020 2030 Unemployment Rate 8,20% 8% 7,90% 8% 8,10% 8,30%
GDP Annual Growth Rate 0,90% -0,90% -0,90% 0,65% 2,80% 2,78%
Consumer Confidence -6 4,19 9,34 9,74 28,35 29,7
Retail Sales YoY -2% 0,68% 1,20% 0,83% 3,99% 3,98%
Consumer Price Index CPI 116,57 118 117 195 269 502
Food Inflation -0,29% -1,24% -1,76% -0,88% -1,06% -0,96%
Government Bond 10Y 1,24% 0,91% 0,79% 0,99% 1,36% 1,67%
Graph 3: USA FMCG (Fast Moving Consumer Goods) Market Forecast 2014-2015, The Economist
Intelligence Unit
6. Risks
There are some potential risks that can potentially affect Ahold´s valuation. These risks can be grouped in two different segments, namely, Systematic risk and Unsystematic risk.
6.1 Systematic Risk
Describes the risk that is implicit or exposed to the entire market or an integrated market segment. Also known as undiversifiable risk, affects the entire market and not such a specific stock or industry. This type of risk is quite inconceivable to predict and to not be exposed to it; hedging and an efficient asset allocation strategy are viable solutions to overcome this issue. Thus, the food retail industry can be exposed to the following risks:
Prevailing economic conditions: In each of the countries that Ahold operates, food retail spending is entirely correlated with current economic conditions. Therefore, any unpredictable degradation or enhancement of the prevailing macroeconomic
conditions in each of the countries will have a direct impact in the growth assumptions tested on those operations.
New entrants: All different business units belonging to Ahold are exposed to new entrants either at a local/regional level (i.e. a new supermarket opening locally to an incumbent) or national level (a new entrant penetrating a whole market).
6.2 Unsystematic Risk
Also known as specific risk reflects the risk that is unique to an individual company and does not affect the market as a whole. With this said, Ahold has reported on its annual report some of its specific risks:
Risk that price will not increase as expected: The potential risk of deflation or low levels of inflation can mitigate the rise of prices that will consequently reduce future net sales.
Pension plan funding: Ahold has a number of defined benefits pension plans covering a large number of employees in Europe and the United States. As it is stated in the company´s 2013 Annual Report “a decrease in equity returns or interest rates may negatively affect the funding ratios of Ahold´s pension funds, which can lead to a higher pension charges and contributions payables”. There are several key risk drivers related to this pension plan funding, such as: Insolvency or bankruptcy of Multi-employer plan participants, decreasing interest rates, poor stock performance, changing pension laws and increasing US healthcare costs.
Excess Cash: Ahold can be motivated to make a large value destructive acquisition due to large amounts of cash on its balance sheet
Currency: More than half of the profits are derived from the United States. Even though the company has some currency hedging derivatives, a dollar appreciation can be a noteworthy upside risk.