Is more always better? An exploration of the differential effects of functional
integration on performance in new product development
Jorge F. Gomes*1
Petra C. de Weerd-Nederhof**
Alan W. Pearson* Miguel Pina e Cunha ***
(*) Manchester Business School, University of Manchester Booth Street West
Manchester M15 6PB England
Email: [email protected]
(**) Faculty of Technology & Management, University of Twente P.O. Box 217
7500 AE Enschede The Netherlands
Email: [email protected]
(***) Faculdade de Economia, Universidade Nova de Lisboa Rua Marquês de Fronteira, 20
1099-038 Lisboa Portugal
Email: [email protected]
1
Correspondence: Jorge F.S. Gomes – Manchester Business School, Booth Street West, M15 6PB Manchester, England – Tel.: +44 161 275 6510 – Fax: +44 161 275 6489 –Email: [email protected]
Acknowledgements: The authors wish to thank all the managers that provided data for the study. Furthermore, Coen van Gassen is gratefully acknowledged for assisting in the data gathering, and Olaf Fisscher and the Faculty of Technology and Management of the Univ. of Twente for facilitating the joint research.
Introduction
Numerous studies have shown that functional integration is a critical aspect of today’s new product development’s (hereinafter NPD) activities (Gupta et al., 1985, 1986; Song et al., 1997; Souder and Moenaert, 1992). As far back as 1970, Allen observes that the frequency, the structure of communication networks, and the nature of communicational mechanisms differ sharply between low and high performers in R&D organisations More recently, Calantone et al. (1995) review 500 articles and books on NPD, innovation, and general management, and suggest that the quality of the marketing-R&D interface is one of the current concerns in NPD research. Also in Europe interface management is regarded as a very important issue for current research (Brockoff and Pearson, 2000). Similarly, Griffin and Hauser (1996) elucidate that communication between marketing and R&D is related to success, regardless of the focus on services or products, and on consumer or industrial markets. This relationship is especially paramount when the degree of uncertainty in the environment is high.
The central question raised by research on integration is that NPD is a process that requires the capability to obtain, process and interpret large amounts of market, technical, financial and other information, in order to develop product ideas and evaluate their technical soundness, manufacturability and economic (market) feasibility. This requires organisations and individuals to be able to overcome internal differences and barriers built during the process of differentiation (Dougherty, 1992; Griffin and Hauser, 1996; Lawrence and Lorsch, 1967), and implement an NPD process based on collaboration of structurally separated, yet interdependent, functional units.
Conceiving of the innovation process this way means that along with diversity of information and tasks to be performed, there is also diversity of behaviours and attitudes, as projects usually require the contribution of many people with different roles in the process. The problem of integrating tasks and activities
becomes as well one of integrating attitudes and behaviours.
The objective of the present paper is to explore the relationship between performance in NPD and integration of tasks and activities, on one hand, and of behaviours, on the other. Furthermore, it aims to explore the nature of this relationship under different conditions of project uncertainty.
Previous research has examined the bi-dimensional nature of functional integration (e.g. Kahn, 1996), but this has been done at a departmental level. This paper complements existing literature by focusing on the marketing-R&D integration at the project level of analysis. It starts by reviewing definitions of integration and the effect of integration practices on performance. It then presents the method and results of the empirical study and it concludes with discussion and implications for managers and researchers.
Literature Review
The concept of integration has been coloured with different and various meanings. Authors have tried to organise this diversity by describing types or levels of integration. For instance, Mintzberg et al. (1996) distinguish between inter-organisational and intra-organisational collaboration. The first one is concerned with collaboration among people and across units, whereas the second includes upstream (e.g. suppliers), downstream (e.g. franchises), Governmental, and lateral (as in a shared research project) collaboration. The current work recognises the recent trend in the study of external collaboration, but focuses only on internal integration of functional units or departments in the context of NPD.
Functional integration has also been labelled: interface (e.g. Gupta et al., 1986), cooperation (e.g. Pinto and Pinto, 1990), co-ordination (e.g. Scott, 1998), collaboration (e.g. Jassawalla and Sashittal, 1998), and cross- or multifunctional teams (e.g. Denison et al., 1996). In the project management literature it is common to find terms such as concurrent or simultaneous engineering, integrated design and engineering, or design for manufacturing (e.g. Hauptman
and Hirji, 1999). One common aspect between these terms is that they all stress the crucial interplay between human and organisational systems in NPD activities.
However, they also emphasise distinct aspects of integration. Kahn (1996) suggests that definitions of integration have focused on two attributes: interaction and collaboration. The first term emphasises the use and exchange of communication between functional units; it represents the structural nature of cross-departmental activities. Collaboration focuses on the collective work between departments; it represents the unstructured, affective nature of interdepartmental relationships. Based on questionnaires to 514 marketing, R&D, and manufacturing managers, Kahn (1996) found that collaboration has a stronger effect on product development and process development performance than interaction.
Hauptman and Hirji (1999) argue that collaboration is needed to overcome the negative attitudes and behaviours that result from differentiation and specialisation and to support co-operation and productive conflict resolution. Co-ordination is also needed to ensure timely sequencing, scheduling and synchronisation of interdependent activities. The operational definitions used by these authors are different from those used by Kahn (1996): integration mechanisms are a measure of status parity, job rotation, and group based rewards; co-ordination mechanisms are a measure of project leader’s power and use of communication technologies and tools. Based on questionnaires to 50 cross-national project teams, the authors found that both types of mechanisms support an effective team process and help to overcome the negative effects due to geographic distance and time differences. Developing grounded theory from a study of ten high-tech firms, Jassawalla and Sashittal (1998) built on Kahn’s work to propose that cross-functional collaboration goes beyond integration. While cross-functional teams and concurrent engineering teams are some of the key structural mechanisms by which to achieve integration, collaboration reflects specific attributes of team members and their organisational context. Collaborative firms
score high in attributes such as transparency (a condition of high awareness achieved as a result of intense communication and exchange of hard-data) and mindfulness (a condition where new product decisions and participants’ actions reflect an integrated understanding of the motivations, agendas, and constraints of all participants). Collaboration is attained only after integration has been achieved. The authors did not include performance measures in their study.
Finally, in a case study of implementation of a structured NPD process at Texas Instruments, Bernasco et al. (1999) observed that meetings, committees and telephone calls improve interaction, but not necessarily collaboration. Collaboration is improved by sharing goals, mutual understanding and informal activity. The authors further suggest that managers use interaction for establishing contact and familiarity between departments; collaboration will slowly emerge from this process.
Not all these studies address the relationship between performance and integration; some (e.g. Jassawalla and Sashittal, 1998) explore the integration mechanisms only and do not look at performance; similarly, Hauptman and Hirji (1999) explore the integration mechanisms, but not functional integration per
se. Kahn (1996) and Bernasco et al. (1999)
concentrate on interdepartmental integration, and not on integration at the level of the NPD project. Other contributions to the study of the relationship between functional integration and performance tend to focus on one of its dimensions only; for example, Gupta and colleagues (Gupta et al., 1985; 1986) and Song and colleagues (Song and Parry, 1992; Song et al. 1998) have mainly examined the interaction side of integration, which is defined as joint involvement between functional departments in a number of activities intimately related to NPD. Conversely, most of the works by Souder, Moenaert, and associates (Moenaert et al., 1994; Souder, 1988), Dougherty (1992), and Pinto and Pinto (1990; Pinto et al., 1993), have extensively looked at the collaboration part of the concept, but have not considered interaction of activities. Both groups of authors tend to adopt a quantitative position by using
well-established measures (e.g. questionnaire application to R&D and marketing managers). On the other hand, recent research suggests that high levels of integration is not always desirable or achievable, and that its relationship with other variables might depend on factors such as product complexity or product innovativeness (Kamoche and Cunha, forthcoming; Souder and Moenaert, 1992; Weerd-Nederhof, 1998). These ideas remain largely unexplored.
Furthermore, most of the abovementioned research has been conducted in the American and Japanese contexts. Some exceptions are the works of Moenaert et al. (1994; Belgian companies) and Haptman and Hirji (1999; various European countries).
In sum, despite the knowledge accumulated on the topic, there is a need to further explore the relationship between performance and the marketing-R&D integration in its components of collaboration and interaction, as well as to assess the effect of contingency factors on that relationship; moreover, this needs to be done in an European setting, where differences in organisation culture may introduce new elements yet to analyse and understand. The current paper follows the quantitative tradition of Gupta et al. (1985; 1986), Song and Parry (1992), and Kahn (1996).
Method
Sample
The data for this study comes from questionnaires to 92 managers directly involved in NPD activities in more than 40 British and Dutch companies from various industrial sectors: chemicals, pharmaceutical, homecare and personal care, electronics and telecommunications, building materials, and white goods. The questionnaires were collected in two different ways. A first group of questionnaires was mailed to 325 R&D/NPD managers; this resulted in 47 returned questionnaires (14.4% return rate), of which 39 had good quality data. A second group of 68 questionnaires was handed over directly to NPD managers, as part of a bigger project in which it was also collected a variety of
qualitative data. As expected, the return rate in the second group was considerable higher: 61 -89%- questionnaires were returned, although only 53 had good quality data (e.g. completed scales). T-tests for independent samples did not reveal statistical differences between the two groups in the majority of the variables. There were no differences between the British and the Dutch groups either.
Measures
All the variables, with the exception of product innovativeness, were measured on a 5-point Likert scale. The measures were adapted from those developed by a number of authors, as described below.
a) Functional integration: interaction. It was used an adaptation of Song and Parry’s (1992), and Gupta et al.’s (1985) scales. The items of this scale measure interaction in 18 activities that require involvement between marketing and R&D during an NPD project. These activities can further be grouped into five areas of integration between R&D and marketing: budgeting; planning and scheduling; concept generation and screening; product development, testing and commercialisation; and post-commercialisation monitoring and service. Respondents were asked to rate on a scale from 1 “very low” to 5 “very high” the level of interaction in the activity concerned. Scores for the overall level of interaction are obtained by averaging the responses given to the 18 items.
b) Functional integration: collaboration. It was used an adaptation of Pinto and Pinto’s (1990) scale. The 15 items on this scale measure three dimensions of cooperation: interpersonal relations, communication and task orientation. Respondents were asked to rate on a scale from 1 “strongly disagree” to 5 “strongly agree” the extent to which each of the sentences best described what happened during the particular project. Scores for each sub-scale and for the overall measure of cooperation are obtained by averaging the responses given to the correspondent items.
c) Degree of product innovativeness. Following Dougherty (1992), products can be classified according to their degree of
innovativeness in five areas: applications, market segments, distribution, technology, and manufacturing. Based on these variables, a dichotomous scale was created: low and high innovative products (where the “high group” reflects innovation in at least two of the areas). d) Outcome measures. Six items were adapted from works by Pinto and Pinto (1990), Song and Parry (1992), and Song et al. (1998), to measure the degree to which the goals of time to market, costs, and product quality were attained in the particular project. Factor analysis to the six items showed three distinct factors, hence the items were grouped into the three measures of time, costs, and quality. A value of 1 in the time scale indicates that the product was launched before time; 5 indicates that the project took longer to go to market. A value of 1 in the costs scale indicates that the product cost less than budgeted; 5 indicates that the project cost more than predicted. A result of 1 in the quality scale indicates that the final product was of lower quality than expected; 5 indicates that the product was of higher quality than expected.
Results
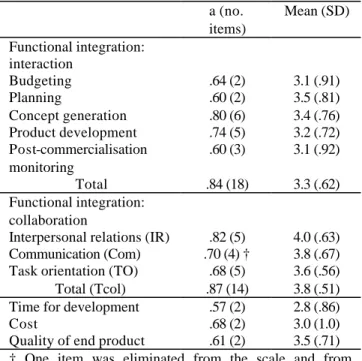
A first set of descriptive analysis was conducted on the data. Table 1 below presents means and standard deviations for the variables of interest in the two groups of questionnaires and the overall group. In addition, it also shows reliability estimates for the scales.
Generally speaking, internal consistency coefficients are acceptable (Nunnally and Bernstein, 1996), although care should be taken in reading the remaining statistical results whenever a scale scored below .60 (as in one of the performance scales: time for development).
On average, respondents score higher on the collaboration sub-scales than on the interaction ones. Interpersonal relations scores higher amongst all sub-scales, with budgeting and post-commercialisation monitoring achieving the lowest mean values of all scales. In general, respondents also report that projects are on time, on costs, and hit expectations in terms of product quality.
Table 1- Assessment of instruments’ quality and descriptive statistics a (no. items) Mean (SD) Functional integration: interaction Budgeting .64 (2) 3.1 (.91) Planning .60 (2) 3.5 (.81) Concept generation .80 (6) 3.4 (.76) Product development .74 (5) 3.2 (.72) Post-commercialisation monitoring .60 (3) 3.1 (.92) Total .84 (18) 3.3 (.62) Functional integration: collaboration
Interpersonal relations (IR) .82 (5) 4.0 (.63) Communication (Com) .70 (4) † 3.8 (.67) Task orientation (TO) .68 (5) 3.6 (.56) Total (Tcol) .87 (14) 3.8 (.51) Time for development .57 (2) 2.8 (.86)
Cost .68 (2) 3.0 (1.0)
Quality of end product .61 (2) 3.5 (.71) † One item was eliminated from the scale and from subsequent analysis due to its bad performance both in reliability and factor analysis.
Table 2 displays correlation coefficients between the two dimensions of functional integration: interaction and collaboration.
Table 2- Correlation matrix of interaction versus collaboration IR Com TO Tcol Budgeting .17 .25* .23* .24* Planning .20 .26* .14 .23* Concept .11 .08 .21 .15 Product .09 .06 .08 .09 Post-com. .10 .01 .21 .15 Total Int. .17 .11 .25* .21 * p<0.05
Results show that collaboration correlates higher with interaction in the initial stages of the NPD process than with later stages. The higher the degree of interaction between R&D and marketing in the budgeting and in the planning and scheduling stages, the more collaborative are the behaviours and attitudes
of those involved in NPD projects and the higher the degree of communication between them.
The stage in which product development, testing and commercialisation are carried out is not correlated at all with the collaboration scales, which means that respondents do not feel that collaboration between R&D and marketing people is important during product development.
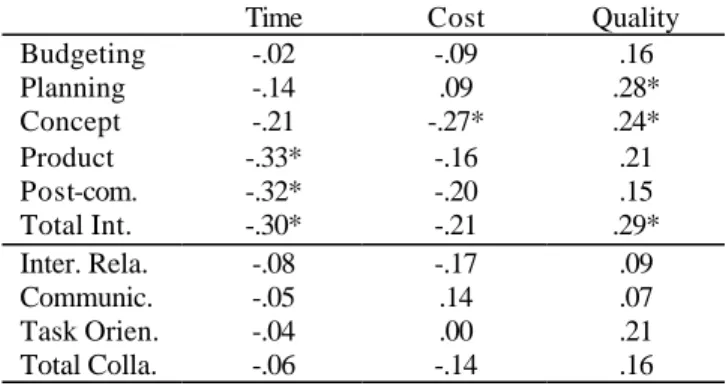
Table 3 represents the pattern of correlations between the interaction and collaboration scales, and the performance variables.
Table 3- Correlation matrix of integration versus performance- overall group
Time Cost Quality Budgeting -.02 -.09 .16 Planning -.14 .09 .28* Concept -.21 -.27* .24* Product -.33* -.16 .21 Post-com. -.32* -.20 .15 Total Int. -.30* -.21 .29* Inter. Rela. -.08 -.17 .09 Communic. -.05 .14 .07 Task Orien. -.04 .00 .21 Total Colla. -.06 -.14 .16 * p<0.05
In general, correlation coefficients are weak to medium, with the interaction scales scoring the highest values amongst all. The collaboration scales show very weak or even inexistent association with the performance measures. Quality is significantly correlated with interaction in the initial stages of the NPD process, whereas time seems to be more important for interaction in the later stages (negative correlations in the present case means that the higher the interaction the less time it takes to launch a new product).
The pattern of correlations changes if the analysis is broken down by degree of product innovativeness. Table 4 contrasts the correlation patterns between high and low innovative products.
As it can be observed from the table, the inclusion of degree of innovativeness propels up correlation values and changes dramatically the relationship between the collaboration
scales and the performance measure of cost. Time to market and quality of end product seem to be associated with interaction when products have a low degree of innovativeness, but not for more innovative products. However, for more innovative products, collaboration amongst team members seems to be important especially for reducing costs of development.
Table 4- Correlation matrix of integration versus performance- I1- Low degree of innovativeness; I2 - High degree of innovativeness
Time I1 I2 Cost I1 I2 Quality I1 I2 Budgeting .03 -.11 -.12 -.11 .30 .00 Planning -.27 -.03 .07 .12 .31* .23 Concept -.32 -.14 -.23 -.37* .41* .05 Product -.38* -.31 -.16 -.15 .15 .29 Post-com. -.46* -.25 -.36* -.04 .35* -.03 Total Int. -.39* -.26 -.24 -.19 .38* .15 Inter. Rela. -.04 -.17 -.04 -.41* .09 .07 Communic. -.01 -.14 .06 -.44* .08 .02 Task Orien. .09 -.22 .16 -.30 .33* .01 Total Colla. .00 -.21 .06 -.47* .23 .04 * p<0.05
Likewise, when regression analysis is performed, indices improve if the degree of innovativeness is taken into account. Table 5 shows regression results for the three performance measures for the overall group and by degree of innovativeness.
Table 5.1- Regression Analysis- Time
R² Standardised Beta coefficients and (t-values) Overall group
0.09 Tot. Interaction= -0.31 (-2.67*) Tot. Collaboration= 0.01 (0.08, ns) Low degree of innovativeness
0.19 Tot. Interaction= -0.47 (-2.78*) Tot. Collaboration= 0.21 (1.24, ns) High degree of innovativeness
0.11 Tot. Interaction= -0.27 (-1.67, ns) Tot. Collaboration= -0.22 (-1.38, ns) * p<0.05
Table 5.2- Regression Analysis- Cost
R² Standardised Beta coefficients and (t-values) Overall group
0.05 Tot. Interaction= -0.19 (-1.68, ns) Tot. Collaboration= -0.10 (-0.88, ns) Low degree of innovativeness
0.09 Tot. Interaction= -0.31 (-1.90, ns) Tot. Collaboration= 0.18 (1.11, ns) High degree of innovativeness
0.26 Tot. Interaction= -0.21 (-1.43, ns) Tot. Collaboration= -0.47 (-3.22 *) * p<0.05
Table 5.3- Regression Analysis- Quality
R² Standardised Beta coefficients and (t-values) Overall group
0.10 Tot. Interaction= 0.26 (2.30 *) Tot. Collaboration= 0.13 (1.15, ns) Low degree of innovativeness
0.17 Tot. Interaction= 0.33 (2.05 *) Tot. Collaboration= 0.15 (0.94, ns) High degree of innovativeness
0.02 Tot. Interaction= 0.15 (0.87, ns) Tot. Collaboration= 0.05 (0.29, ns) * p<0.05
Regression results are generally very low but they tend to improve when analysis is performed according to the degree of product innovativeness. As in the correlation analysis, interaction tends to contribute more than collaboration for explaining time and quality, whereas collaboration appears to have an effect on cost for high innovative products.
Discussion and conclusions
Despite the low values found for both correlation and regression analysis, these are comparable to those reported by other authors. For example, the standardised path coefficient estimates between cooperation and performance in Song et al.’s (1997) study vary between 0.22 and 0.38. Pinto and Pinto (1990) report an adjusted R² of 0.29 between cooperation and task outcomes. And the
regression coefficients described by Kahn (1996) vary between 0.01 and 0.14. If on one hand these low values -yet statistically significant- indicate that other variables not included in this study help to explain the variance of performance measures -as indeed suggested by Brown and Eisenhardt (1995)-, they also show that functional integration is associated with time, cost, and quality.
Overall, the results of this investigation confirm those of several authors that have looked at the relationship between functional integration and process and product performance (e.g. Dougherty, 1992; Griffin and Hauser, 1996; Moenaert et al., 1994; Pinto et al., 1993). However, the findings also suggest that integration is a multidimensional construct which relates differently to outcomes in NPD. Firstly, interaction between marketing and R&D in the initial stages of the NPD process seems to assume a prominent role in the quality of the end product, whereas interaction in later stages appears to be more associated with time to market than with costs and quality of the end product. These results give partial support to Verganti (1997) and Song et al. (1998): in both studies it was found that integration in the concept generation stage contributes to better product effectiveness and product efficiency. Secondly, although collaboration has been advocated as having a more important impact of performance than interaction (Kahn, 1996), the current research has shown opposite results. A possible reason for this disparity might be related to the different operational definitions utilised in this study and in Kahn’s work. For example, Kahn (1996) uses mechanisms of communication for measuring interaction, whereas the current study used NPD activities that are likely to require integration between functional units.
Finally, this research provides evidence that the degree of product innovativeness plays an important role in understanding the benefits of intra-organizational collaboration during NPD. As shown, collaboration may be more relevant under circumstances of high new product innovativeness than when minor variations are introduced in a new product. As such, these findings suggest that a universal approach to
the management of NPD may not be possible. As argued by Kamoche and Cunha (forthcoming) and Weerd-Nederhof (1998), more than insisting on the benefits of a one best way, researchers should analyze how different contingencies recommend the adoption of different NPD configurations. Moreover, it is anticipated that the traditional sequential models (e.g. Cooper, 1988; 1990) may be useful for “routine innovations”, but not for the development of new products with a higher degree of innovativeness.
The data further shows that interaction may be beneficial for less innovative new products, while collaboration may be necessary while developing highly new products. This can be explained by the type of activities involved in both kinds of projects: more structure can be used in the first case; less structure and a need for sensemaking require collaboration in the latter. Therefore, this research suggests that the challenges posed by different types of products may be fundamental not only for understanding the paths for NPD, but also for designing NPD activities which adapt to the type of product. With regard to this, existing product typologies (e.g. Clark and Wheelwright, 1993; Coombs et al. 1998) could be used to increase knowledge on the field.
Recent research (e.g. Brown and Eisenhardt, 1995, 1997) proposes that unconventional development practices such as extensive communication, loose structuring, and fluid job descriptions, are fundamental ingredients in NPD projects, which confirms that more collaboration may be necessary when a new path must be discovered, while more interaction may be recommended for developing minor innovations. These results fundamentally reflect the divergence between exploration and exploitation, and confirm that more is better if such a divergence is considered.
References
Allen, T.J. (1970). Communication networks in research and development laboratories. R&D
Management, 1, 14-21.
Bernasco, W.; Weerd-Nederhof, P.C.; Tillema, H. and Boer, H. (1999). Balanced matrix structure and new product development process at Texas Instruments Materials and Controls Division. R&D Management, 29(2), 121-131.
Brockoff, K.K. and Pearson, A.W. (2000). Technology management- where do we stand. In K.K. Brockoff; A.W. Pearson; P.C. de Weerd-Nederhof; and I.C. Kerssens-van Drongelen (eds.)(2000), Technology Readings in Management, Enschede: Twente
University Press (pp.9-21).
Brown, S.L. and Eisenhardt, K.M. (1995). Product development: past research, present findings, and future directions. Academy of
Management Review, 20(2), 343-378.
Brown, S.L. and Eisenhardt, K.M. (1997). The art of continuous change: Linking complexity theory and time-paced evolution in relentlessly shifting organizations.
Administrative Science Quarterly, 42, 1-34.
Calantone, R.J.; Di Benedetto, C.A. and Haggblom, T. (1995). Principles of new product management: Exploring the beliefs of product practitioners. Journal of Product
Innovation Management, 12, 235-247.
Clark, K.B. and Wheelwright, S.C. (1993).
Managing New Product and Process Development: Text and Cases. New York:
The Free Press.
Coombs, R.; McMeekin, A. and Pybus, R. (1998). Toward the development of benchmarking tools for R&D project management. R&D Management, 28(3), 175-186).
Cooper, R.G. (1988). The new product process: a decision guide for management. Journal of
Marketing Management, 3(3), 238-258.
Cooper, R.G. (1990). Stage-gate systems: a new tool for managing new products.
Business Horizons, 33(3), 44-54.
Denison, D.R.; Hart, S.L. and Kahn, J.A. (1996). From chimneys to cross-functional teams: developing and validating a diagnostic model. Academy of Management Journal, 39(4), 1005-1019.
Dougherty, D. (1992). Interpretative Barriers to Successful Product Innovation in Large Firms. Organization Science, 3(2), 179-202.
Griffin, A. and Hauser, J.R. (1996). Integrating R&D and Marketing: A review and analysis of the literature. Journal of Product Innovation Management, 13, 191-215.
Gupta, A.K.; Raj, S.P. and Wilemon, D. (1985). The R&D-marketing interface in high-technology firms. Journal of Product
Innovation Management, 2, 12-24.
Gupta, A.K.; Raj, S.P. and Wilemon, D. (1986). A model for studying R&D-Marketing interface in the product innovation process. Journal of Marketing, 50(2), 7-17. Hauptman, O. and Hirji, K.K. (1999).
Managing integration and coordination in cross-functional teams: an international study of Concurrent Engineering product development. R&D Management, 29(2), 179-191.
Jassawalla, A.R. and Sashittal, H.C. (1998). An examination of collaboration in high-technology new product development processes, Journal of Product Innovation
Management, 15(3), 237-254.
Kahn, K.B. (1996). Interdepartmental integration: a definition with implications for product development performance. Journal of
Product Innovation Management, 13(2),
137-151.
Kamoche, K. and Cunha, M.P. (forthcoming). Minimal structures: From jazz improvisation to product innovation. Organization Studies Lawrence, P.R. and Lorsch, J.W. (1967).
Organization and Environment, Boston:
Harvard Business Review Press.
Mintzberg, H.; Dougherty, D.; Jorgensen, J. and Westley, F. (1996). Some surprising things about collaboration –knowing how people connect makes it work better.
Organizational Dynamics, 25(1), 60-71.
Moenaert, R.K.; Souder, W.E.; De Meyer, A.; and Deschoolmeester, D. (1994). R&D-Marketing integration mechanisms, communication flows, and innovation success. Journal of Product Innovation
Management, 11, 31-45.
Nunnally, J.C. and Bernstein, I.H. (1996).
Psychometric Theory (3rd ed.). McGraw-Hill. Pinto, M.B. and Pinto, J.K. (1990). Project
team communication and cross-functional cooperation in new product development.
Journal of Product Innovation Management,
7(3), 200-212.
Pinto, M.B.; Pinto, J.K. and Prescott, J.E. (1993). Antecedents and consequences of project team cross-functional cooperation.
Management Science, 39(10), 1281-1297.
Scott, G.M. (1998). The new age of new product development: are we there yet? R&D
Management, 28(4), 225-236.
Song, X.M. and Parry, M.E. (1992). The R&D-Marketing interface in Japanese High-Technology Firms. Journal of Product
Innovation Management, 9, 91-112.
Song, X.M.; Montoya-Weiss, M.M. and Schmidt, J.B. (1997). Antecedents and consequences of cross-functional cooperation: a comparison of R&D, manufacturing, and marketing perspectives.
Journal of Product Innovation Management,
14(1), 35-47.
Song, X.M.; Thieme, R.J. and Xie, J. (1998). The impact of cross-functional joint involvement across product development stages: an exploratory study. Journal of
Product Innovation Management, 15,
289-303.
Souder, W.E. (1988). Managing relations between R&D and marketing in new product development projects. Journal of Product
Innovation Management, 5(1), 6-19.
Souder, W.E. and Moenaert, R.K. (1992). Integrating marketing and R&D project personnel within innovation projects: an information uncertainty model. Journal of
Management Studies, 29(4), 485-512.
Verganti, R. (1997). Leveraging on systemic learning to manage the early phases of product innovation projects. R&D Management, 27(4), 377-392.
Weerd-Nederhof, P.C. de (1998). New Product
Development Systems: Operational Effectiveness and Strategic Flexibility. Thesis
University of Twente, Enschede, the Netherlands.