Sara Cristiana Lopes
Peixoto
Alteração das comunidades microbianas como
medida de avaliação do impacto da contaminação
do solo por nanopartículas.
Changes of the microbial communities as a mean to
evaluate the impact of soil contamination by
nanoparticles.
DECLARAÇÃO
Declaro que esta dissertação é integralmente da minha autoria, estando devidamente referenciadas as fontes e obras consultadas, bem como identificadas de modo claro as citações dessas obras. Não contém, por isso, qualquer tipo de plágio quer de textos publicados, qualquer que seja o meio dessa publicação, incluindo meios eletrónicos, quer de trabalhos académicos.
2015
Sara Cristiana Lopes
Peixoto
Alteração das comunidades microbianas como
medida de avaliação do impacto da contaminação do
solo por nanopartículas.
Dissertação apresentada à Universidade de Aveiro para cumprimento dos requisitos necessários à obtenção do grau de Mestre em Microbiologia, realizada sob a orientação científica da Doutora Jacinta Oliveira (Investigadora em Pós-Doutoramento no Departamento de Biologia e CESAM da Universidade de Aveiro) e co-orientação da Doutora Susana Loureiro (Investigadora Auxiliar no Departamento de Biologia e CESAM da Universidade de Aveiro).
o júri
Presidente Prof. Doutora Sónia Alexandra Leite Velho Mendo
Professora Auxiliar com agregação do Departamento de Biologia da Universidade de Aveiro.
Doutora Isabel da Silva Henriques
Investigadora Auxiliar do Departamento de Biologia da Universidade de Aveiro.
Doutora Jacinta Maria Marques Oliveira (Orientadora)
Investigadora Pós-Doutoramento do Departamento de Biologia e CESAM da Universidade de Aveiro.
agradecimentos Em primeiro lugar, não poderia deixar de agradecer à minha orientadora Doutora Jacinta Oliveira, pela motivação e enorme paciência, pela ajuda prática e teórica e pelas correções/sugestões nesta tese. Além disso, por sempre me tentar impulsionar, tanto a nível profissional como a nível pessoal, sem nunca desistires de mim, um muito obrigado por TUDO.
À minha co-orientadora Doutora Susana Loureiro, por me ter dado a oportunidade de realizar este trabalho, no qual aprendi imenso. Obrigada pela sua amabilidade e pelas valiosas sugestões no trabalho.
Seguidamente agradeço ao applEE, o grupo do qual pertenço, por sempre me ajudarem quando mais precisava, nomeadamente ao Rui, Paulinha e Patrícia: obrigada pelos ensinamentos com os isópodes.
Agradeço também a todas as investigadoras e colegas da microbiologia, pela disponibilidade e simpatia, nomeadamente à Susana, Laura, Cátia e Patrícia e, em particular, à Doutora Isabel.
Não poderia faltar um agradecimento enorme a todas as minhas amigas, principalmente à Helena Lopes que sempre esteve presente em todos os momentos, e à Maria pelos cafés e momentos de descontração pós-almoços. Agradeço também pela boa companhia, disposição e alegria contagiante da Sara Costa e Bárbara. Agradeço também à Joana Moreira por estar sempre presente e me ajudar em tudo. À Carla Tavares, Mónica Rodrigues, Sílvia Dias, Inês e Rita pelo incentivo e pela amizade. Sem dúvida tornaram tudo mais fácil, obrigada.
E por último mas sem dúvida nenhuma o maior agradecimento aos meus pais e irmãs que sempre me apoiaram em todas as etapas.
palavras-chave Nanopartículas de prata, nitrato de prata, comunidades bacterianas do solo.
resumo As nanopartículas de prata (AgNPs) são muito utilizadas na indústria devido às suas propriedades antibacterianas. A libertação de forma não controlada das AgNPs para o ambiente e a sua persistência no mesmo, aumentam a preocupação em relação à contaminação dos solos por AgNPs. Assim, o objetivo desta tese foi analisar os efeitos das AgNPs nas comunidades bacterianas do solo recorrendo a duas abordagens complementares: uma independente do cultivo [Polymerase Chain Reaction- Denaturing Gradient Gel Electrophoresis (PCR-DGGE)] e outra dependente do cultivo (método de difusão por discos para analisar a suscetibilidade bacteriana).
Para dar cumprimento a este objectivo, as comunidades bacterianas do solo LUFA 2.2 foram expostas a 5 µg/kg de AgNPs ou de catião prata (Ag+, disponibilizado como AgNO3) durante 56 dias.
A análise das comunidades bacterianas do solo por PCR-DGGE foi feita para 42 e 56 dias e na presença e ausência do Porcellionides pruinosus. Para os testes de suscetibilidade, apenas as comunidades bacterianas do solo para 56 dias foram analisadas.
O primeiro método possibilitou investigar os efeitos das AgNPs ou Ag+ nas comunidades bacterianas do solo e compreender se estes efeitos alteravam com a presença do P. pruinosus ou ao longo do tempo de exposição. O segundo método permitiu avaliar a resposta de suscetibilidade das comunidades bacterianas do solo atendendo à forma (AgNPs ou Ag+) e quantidade (10 µg, 1 µg ou 0.1 µg) da prata, à exposição conjunta e após reincidência da contaminação por prata.
Com o PCR-DGGE demostrou-se que a forma da prata (AgNPs ou Ag+), o período de exposição (42 ou 56 dias) e a presença do P. pruinosus foram relevantes para a alteração da comunidade bacteriana do solo. O P. pruinosus poderá ser, provavelmente, útil para a bioremediação de catião prata para exposições perto dos 2 meses; ainda assim, mesmo na presença deste isópode, as AgNPs poderão constituir um risco para as comunidades bacterianas do solo. Através do método de difusão por discos foi possível disponibilizar uma análise da fracção viável das comunidades bacterianas do solo demonstrando que a forma, quantidade e combinação de ambas as formas de prata afectaram a suscetibilidade das comunidades bacterianas do solo. As bactérias mostraram ser mais suscetíveis Ag+ do que às AgNPs sendo também possível observar uma resposta dependente da quantidade além do efeito aditivo para a exposição combinada.
Apesar dos efeitos das nanopartículas de prata nas comunidades bacterianas terem sido analisadas por dois métodos, foram identificados alguns padrões: as bactérias foram afetadas por ambas as formas de prata, mostrando que quer a estrutura da comunidade quer a suscetibilidade eram alteradas. É imperativa a análise de baixas quantidades em investigações futuras, além das testadas nesta tese, já que a resposta de suscetibilidade alterou-se para exposição prévia a contaminações com quantidades baixas (1 e 0.1 µg).
Comparativamente com o catião de prata, as AgNPs parecem afetar menos as comunidades bacterianas do solo. Assim, esta tese reforça o quão valioso é usar estas comunidades para avaliar os efeitos da contaminação no solo, já que provaram ser sensíveis à contaminação de prata pelas duas metodologias.
keywords Silver nanoparticles, silver nitrate, soil bacterial communities.
abstract Silver nanoparticles (AgNPs) are broadly used in the industry due to AgNPs’
antibacterial proprieties. Uncontrolled released of AgNPs and persistence in the environment might enhance the concern of soil contamination by AgNPs. Thus, the aim of this thesis was to evaluate the effects of AgNPs on the bacterial communities using two complementary approaches: a culture-independent method [Polymerase Chain Reaction-Denaturing Gradient Gel Electrophoresis (PCR-DGGE)] and a culture-dependent method (disc diffusion to analyze the bacterial susceptibility).
To explore this aim, the bacterial communities of the LUFA 2.2 soil was exposed to 5 µg/kg of AgNPs or silver cation (Ag+, provided as AgNO3) during 56 days.
The analysis of the soil bacterial communities by PCR-DGGE included those retrieved from soil at 42 and 56 days as well as those developed in the presence and absence of Porcellionides pruinosus. For the susceptibility tests, only the soil bacterial communities retrieved from soil at 56 days were analyzed.
The first method enabled to investigate the effects of AgNPs or Ag+ on the bacterial community of soil and to understand if these effects changed with the presence of P. pruinosus or along the exposure period.
The second methodology provided an analysis of the viable soil bacterial community and allowed to assess the susceptibility responses of the soil bacterial communities according to the silver form (AgNPs or Ag+), silver amounts (10 µg, 1 µg or 0.1 µg), joint exposure to AgNPs and Ag+ and after previous exposure to silver.
By using PCR-DGGE, we demonstrated that the silver forms (AgNPs and Ag+), exposure period (42 or 56 days) and the presence of P. pruinosus were relevant to alter the structure of soil bacterial community. P. pruinosus showed to be probably useful to minimize the effects of silver cation for exposures close to 2 months; yet, even in the presence of this isopod, the AgNPs might still be a risk for the soil bacterial communities. By using disc diffusion method we provided an analysis of the viable soil bacterial community demonstrating that the silver form, the amount and the combination of both silver forms affected the susceptibility of the soil bacterial communities. Bacteria were more susceptible to Ag+ than to AgNPs and amount-dependent as well as addition effects were demonstrated.
Although the bacterial communities being analyzed by the two methods were different, overall patterns were identified: bacteria are affected by both silver forms, particularly by showing altered community structure and showing susceptibility through growth inhibition. Yet, lower concentrations than those herein tested are imperative to be considered in future investigations as we obtained most of the susceptibility changes for exposures with lower amounts (1 and 0.1 µg).
Compared to silver cation, the AgNPs appears to affect less the soil bacterial communities. Thus, this thesis strengthens how valuable is to use these communities to evaluate the effects of the soil contamination as they proved to be sensible to silver contamination by both methodologies.
I
INDEX
SCOPE, AIM AND STRUCTURE OF THE THESIS
1. Scope ... 1
2. Aim ... 2
3. Structure ... 3
CHAPTER I – GENERAL INTRODUCTION 1. Nanotechnology ... 7
1.1. Nanoparticles versus nanomaterial: definition and distinction... 7
1.2. Regulation ... 8
1.3. Source of nanoparticles ... 8
1.3.1. NPs from natural sources ... 9
1.3.1.1. Green nanoparticles (gNPs) ... 9
1.3.2. Anthropogenic sources ... 12
1.3.2.1. Engineered nanoparticles (ENPs)... 12
2. ENPs: Silver nanoparticles (AgNPs) ... 14
2.1. AgNPs versus bulk form (Ag cation: Ag+) ... 16
2.2. Emission and exposure scenarios of AgNPs into the environment ... 16
2.3. AgNPs interactions in soil compartment ... 19
2.4. AgNPs interaction with bacteria ... 22
2.5. Possible effects of the interaction between AgNPs and the microbiota from soil ... 25
3. Ecotoxicology studies ... 26
3.1. Terrestrial ecotoxicological assays: standard soil. ... 27
3.2. Evaluation of the toxicity of AgNPs to soil bacteria ... 28
3.3. Evaluation of the toxicity of AgNPs using terrestrial organisms ... 29
3.3.1. Model organism: Porcellionides pruinosus ... 32
3.3.1.1. Characterization of the model organism ... 33
4. Methods for analysis of the effects of AgNPs ... 35
4.1. Culture-independent methods ... 35
4.1.1. Polymerase Chain reaction (PCR) ... 36
4.1.2. Denaturing Gradient Gel Electrophoresis (DGGE) ... 38
4.1.3. PCR-DGGE studies ... 40
4.2. Culture-dependent methods ... 41
4.2.1. Susceptibility tests ... 41
5. Comparison between culture-dependent and culture-independent methods ... 44
6. References ... 45
CHAPTER II - EFFECTS OF SILVER-NANOPARTICLES: PCR-DGGE PROFILES SHOW CHANGES ON SOIL BACTERIAL COMMUNITY Abstract ... 57
Graphical abstract ... 58
1. Introduction ... 59
2. Material and methods ... 61
II
2.2. Analysis of the soil bacterial community ... 62
2.2.1. Total DNA extraction ... 62
2.2.2. PCR-DGGE ... 62 2.3. Statistical analysis ... 63 3. Results ... 64 4. Discussion ... 71 5. Conclusions ... 75 6. Acknowledgements ... 75 7. References ... 75
CHAPTER III - SUSCEPTIBILITY OF SOIL BACTERIAL COMMUNITY TO SILVER (NANOPARTICLE AND CATION) Abstract ... 81
Graphical abstract ... 82
1. Introduction ... 83
2. Material and methods ... 84
2.1. Experimental design and sample preparation ... 84
In the table: AgNPs – Silver nanoparticles; Ag+– Silver cations supplied as AgNO3. ... 85
2.2. Disc diffusion method ... 85
The disc diffusion method was used to analyze the susceptibility of the cultivable soil bacterial community to silver. The protocol was adapted from (Matuschek et al., 2013; Saeb et al., 2014) and will be briefly described. ... 85
2.3. Statistical analysis ... 87
3. Results ... 87
3.1. Non-exposed soil microbial communities ... 87
3.2. Soil microbial communities previously exposed to silver ... 90
3.3. Bacterial groups representative of soil bacterial community ... 92
4. Discussion ... 93
5. Conclusions ... 98
6. Acknowledgements ... 98
7. References ... 98
8. Supplementary data ... 102
CHAPTER IV – FINAL DISCUSSION AND CONCLUSION 1. Final discussion and conclusions ... 105
2. References ... 109
ANNEXES ANNEX 1. Properties of LUFA 2.2 soil ... 115
ANNEX 2. Electrophoresis of the PCR products obtained prior to DGGE. ... 116
ANNEX 3. Culture media used in the susceptibility tests: preparation ... 118
ANNEX 4. Susceptibility of bacterial strains to antibiotics ... 119
ANNEX 5. Images of the resulting plates from the susceptibility test at 25ºC. ... 120
ANNEX 6. Susceptibility tests at 37ºC ... 123
III
LIST OF FIGURES
SCOPE, AIM AND STRUTURE OF THE THESIS Figure 1. Experimental design: bacterial community from LUFA 2.2 soil was analyzed
by two methods, disc diffusion dependent method) and PCR-DGGE (culture-independent method). ... 3
CHAPTER I – GENERAL INTRODUCTION Figure 2. Silver nano-based products in different commercial products (Adapted from:
Muller & Nowack, 2008) ... 15
Figure 3. Life cycle stages of nanomaterials (NMs) and their environmental fate
(Adapted from: Som et al., 2010). ... 17
Figure 4. Predicted concentrations (PEC) of AgNPs (ng/kg dry weight soil) in Europe
(expecting 57% of agricultural land used, minimum NPs transfer to sludge and a 25 cm ploughing depth) (Faust & Backhaus, 2011). In the figure: highest PEC was determined for England (> 10 ng, represented in red); the most abundant PEC rounds 5-10 ng/kg dry weight of soil in central and south of Europe (represented in orange) while the lowest PEC (0-5 ng/kg dry weight of soil) is represented in yellow (Faust & Backhaus, NanoFATE) ... 19
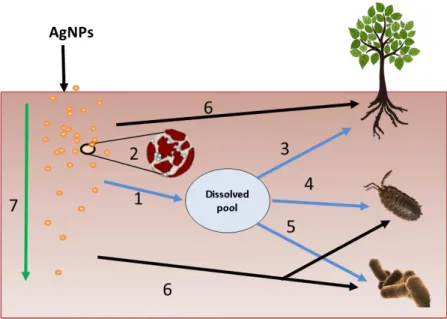
Figure 5. Key processes in soil related to the transformation and potential risk driven by
manufactured nanoparticles. In the figure: (1) dissolution; (2) sorption/aggregation; (3) plant accumulation; (4) invertebrate accumulation and toxicity; (5) microbial toxicity; (6) direct particle uptake/toxicity; (7) particle migration (Klaine et al., 2008) ... 20
Figure 6. Interactions between silver nanoparticles and environment. The figure shows
the major characteristics of AgNPs (green) and the environmental conditions [pH, DO (dissolved oxygen), organic matter and salt concentration] (red) affecting the AgNPs toxicity (grey) to the biota (microorganisms and organisms) (Adapted from: Dinesh et al., 2012) ... 21 Figure 7. Some mechanisms of action of NPs against microorganisms (Choi et al.,
2012) ... 23
Figure 8. Schematic representation of possible responses of microbial communities to a
disturbance (Adapted from Sharma, 2010) ... 25
Figure 9. Ecotoxicological studies focused on different ENPs (B) and group of
organisms (A) (Adapted from Kahru & Dubourguier, 2010) ... 26
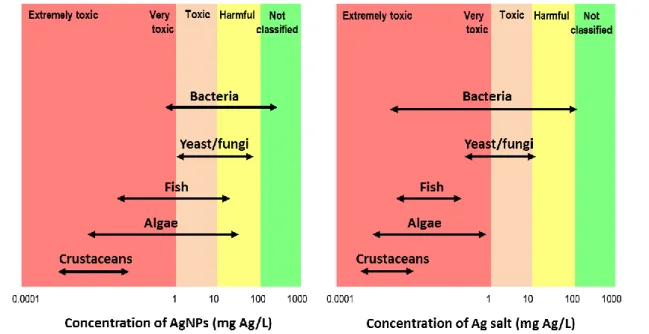
Figure 10. Hazard of AgNPs (a) and bulk form (AgNO3) for different organisms.
Ranging was obtained using the median of LC50 (concentration causing mortality for
IV
values for all organisms except for bacteria for which the MIC (minimum inhibitory concentration). (Adapted from Bondarenko et al., 2013)... 27
Figure 11. Internal morphology of the digestive system of an adult isopod (I); in the
figure: head (ST), midgut glands-hepatopancreas (MG), anterior region of the hindgut (ANT), typhlosole (TI), papillate region of the hindgut (PAP), sphincter (SP), rectum (RE), anus (AN) (Adapted from: Kostanjsek et al., 2002). Porcellionides pruinosus - external morphology (II). Hepatopancreas attached to isopod head (III)... 34
Figure 12. Molecular methods used to detect and quantify environmental microbial communities (EMC) (Adapted from: Gao & Tao, 2012). In the figure: denaturing gradient gel electrophoresis (DGGE); terminal restriction fragment length polymorphism (T-RFLP); fluorescence in situ hybridization (FISH); phospholipid fatty acid (PLFA); restriction fragment length polymorphism (RFLP); microarray analysis (Geochip); stable isotope probing (SIP) and automated rRNA intergenic spacer analysis (ARISA) ... 36
Figure 13. PCR-DGGE approach for bacterial community analysis (Adapted from:
Nakatsu, 2007) ... 39
CHAPTER II - EFFECTS OF SILVER-NANOPARTICLES: PCR-DGGE PROFILES
SHOW CHANGES ON SOIL BACTERIAL COMMUNITY
Figure 1. PCR-DGGE profile obtained for the soil bacterial community exposed to
AgNPs or Ag+,during 42 days (A) and 56 days (B). Please see Table 1 for sample identification details. Triplicates of each sample are ordered and grouped. Lane M refers to DGGE marker: I - RAI 70; II - RAN 60; III - RAI 3; IV - RAI 43; V - RAN 18; VI - RAN 12; VII - RAN 140; VIII - RAI 76 (Henriques et al., 2004) ... 66
Figure 2. Cluster (A) and PCoA analysis (B) of DGGE profiles obtained from the soil
bacterial community exposed to AgNPs or Ag+ during 42 days. Please see Table 1 for sample identification. For Figure 2A: the cluster mentioned in the text as cluster 1 is delimited by solid line and represents the controls, cluster 2 is delimited by dashed line and represents silver contaminated samples in the absence of P. pruinosus; the remaining samples are grouped in cluster 3 which represents silver contaminated samples in the presence of P. pruinosus; clusters and PCoA groups were defined at 4% similarity ... 67
Figure 3. Cluster (A) and PCoA analysis (B) of DGGE profiles obtained from the soil
bacterial community exposed to AgNPs or Ag+ during 56 days. Please see Table 1 for sample identification. For Figure 3A: the cluster mentioned in the text as cluster 4 is delimited by solid line, the cluster 5 is delimited by dashed line and the remaining samples are grouped in cluster 6;clusters were qualitatively defined for better description in the text; groups in PCoA were defined at 15% similarity ... 70
V
CHAPTER III - SUSCEPTIBILITY OF SOIL BACTERIAL COMMUNITY TO
SILVER (NANOPARTICLE AND CATION)
Figure 1. Susceptibility of soil bacterial communities (CT0 and CT56) not exposed to
silver: (A) dBC (directly plated bacterial communities) and (B) pBC (pre-enriched bacterial communities). Please see Table 1 and 2 for sample identification. Data represent diameters mean ± standard deviation (n=4). (*) Statistical differences between soil treatments (CT0 vs. CT56), for the same silver amount, according to one-way ANOVA (Dunnett's test) for p<0.05. Different letters (e.g. a and a’) corresponds to significant differences, for the same silver amount, within soil treatments (e.g. within CT0 or within CT56) and between silver forms (AgNPs vs. Ag+) p<0.05 (two-way ANOVA) ... 89
Figure 2. Susceptibility of soil bacterial communities previously exposed to silver
forms (NP56 or Ag56): (A) dBC (directly plated bacterial communities) and (B) pBC (pre-enriched bacterial communities). Data relative to non-exposed soil bacterial communities from the end of the experiment (CT56 for dBC and CT56 for pBC) was maintained for comparison purposes. Please see Table 1 and 2 for sample identification. Data represent diameters mean ± standard deviation (n=4). (*) Statistical differences between soil treatments (CT56 vs. NP56 or CT56 vs. Ag56), for the same silver amount, according to one-way ANOVA (Dunnett's test) for p<0.05. Different letters (e.g. a and a’) corresponds to significant differences, for the same silver amount, within soil treatments (e.g. within NP56 or within Ag56) and between silver forms (AgNPs vs. Ag+) p<0.05 (two-way ANOVA) ... 91
Figure 3. Susceptibility of bacterial strains to silver exposure. In the figure: Escherichia coli ATCC 25922 was only used as control and is separate from the tested bacterial strains using a dashed line; Antibiotic imipenem (IMI) was only used for Pseudomonas putida. Please see Table 2 for sample identification. Data represent diameters mean ± standard deviation (n=4). (*) Statistical differences among bacterial strains (Bacillus sphaericus ATCC 29726 vs. Arthrobacter arilaitensis GCNP1_I vs. Pseudomonas putida NCIMB 10432), for the same silver amount, according to one-way ANOVA (Dunnett's test) for p<0.05. Different letters (e.g. a and a’) corresponds to significant differences, for the same silver amount, within each bacterial strain (e.g. within Bacillus sphaericus ATCC 29726 or within Arthrobacter arilaitensis GCNP1_I or within Pseudomonas putida NCIMB 10432) and between silver forms (AgNPs vs. Ag+), p<0.05 (two-way ANOVA) ... 93
Figure S1. Plates of cultured bacterial communities not exposed to silver (CT56) after
testing response to silver forms and amounts: (A) dBC (directly plated bacterial communities) and (B) pBC (pre-enriched bacterial communities). Please see Table 1 and 2 for sample identification. See also ANNEX 5 ... 102
ANNEXES Figure A2.1. Electrophoresis in agarose gels (1.5% in TAE 1x; 120V; 40 min) of the
PCR products obtained from controls samples (not exposed soil) at 0 (CT0) and 56 days (CT56). Triplicates are grouped. In the figure: Cp - Positive control (consists of all reagents used during sample processing but contains a DNA that you know it will
VI
amplify instead of sample); Cn - Negative control (consists of all reagents used during sample processing but contains water instead of sample; it can also be a DNA that you know it will not amplify); B - Reagent blank (consists of all reagents used during sample processing but contains no sample) control; Pv - Empty well; MK - Thermo ScientificTM FastRuler Middle Range DNA Ladder (#SM1113) [composed of the following DNA fragments (in base pairs): 5000, 2000, 850, 400 and 100] ... 116
Figure A2.2. Electrophoresis in agarose gels (1.5% in TAE 1x; 120V; 40 min) of the
PCR products obtained from soil samples after exposure to AgNPs during 56 days in the absence (NP56) and presence (NP56Pp) of P. pruinosus. Triplicates are grouped. In the figure: Cp - Positive control; Cn - Negative control; B - Reagent blank control; Pv - Empty well; MK - Thermo ScientificTM FastRuler Middle Range DNA Ladder (#SM1113) [composed of the following DNA fragments (in base pairs): 5000, 2000, 850, 400 and 100] ... 116
Figure A2.3. Electrophoresis in agarose gels (1.5% in TAE 1x; 120V; 40 min) of the
PCR products obtained from soil samples after exposure to Ag+ during 56 days in the absence (Ag56) and presence (Ag56Pp) of P. pruinosus. Triplicates are grouped. In the figure: Cp - Positive control; Cn - Negative control; B - Reagent blank control; Pv - Empty well; MK - Thermo ScientificTM FastRuler Middle Range DNA Ladder (#SM1113) [composed of the following DNA fragments (in base pairs): 5000, 2000, 850, 400 and 100]. ... 117
Figure A2.4. Electrophoresis in agarose gels (1.5% in TAE 1x; 120V; 40 min) of the
PCR products obtained from non-contaminated soil samples at the beginning (CT0) and at 42 days in the absence (CT42) and presence (CT42Pp) of P. pruinosus as well as contaminated soil samples (with AgNPs in the absence (NP56) and presence (NP56Pp) of P. pruinosus or to Ag+ in the absence (Ag56) and presence (Ag56Pp) of the isopod). Triplicates are grouped. In the figure: Cp - Positive control; Cn - Negative control; B - Reagent blank control; Pv - Empty well; MK - Thermo ScientificTM FastRuler Middle Range DNA Ladder (#SM1113) [composed of the following DNA fragments (in base pairs): 5000, 2000, 850, 400 and 100]. ... 117
Figure A5.1. Susceptibility assays of the soil bacterial communities [directly plated soil
bacterial communities: dBC; non-exposed (at 0 and 56 days) and exposed to AgNPs or Ag+] by disc diffusion method at 25ºC. Please see Table 2 (Chapter III) for disc identification details. Quadruplicate assay (R1, R2, R3 and R4) ... 121
Figure A5.2. Susceptibility assays of the soil bacterial community (after recover to
TSB) to AgNPs or Ag+ exposures, by disc diffusion method at 25ºC. Please see Table 2 (Chapter III) for sample identification details. Quadruplicate assay (R1, R2, R3 and R4) ... 121
Figure A5.3. Susceptibility assays of the bacterial strains (P. putida; A. arilaitensis; B. sphaericus and E. coli) to AgNPs or Ag+ exposures, by disc diffusion method at 25ºC. Please see Table 2 (Chapter III) for sample identification details. Quadruplicate assay (R1, R2, R3 and R4) ... 122
Figure A6.1. Susceptibility of soil bacterial communities previously not exposed to
silver forms (CT0 and CT56) at 37ºC: (A) dBC (directly plated bacterial communities) and (B) pBC (pre-enriched bacterial communities). Please see Table 1 and 2 (Chapter
VII
III) for sample identification. Data represent diameters mean ± standard deviation
(n=4). (*) Statistical differences between soil treatments (CT0 vs. CT56), for the same silver amount, according to one-way ANOVA (Dunnett's test) for p<0.05. Different letters (e.g. a and a’) corresponds to significant differences, for the same silver amount, within soil treatments (e.g. within CT0 or within CT56) and between silver forms (AgNPs vs. Ag+), p<0.05 (two-way ANOVA) ... 124
Figure A6.2 Susceptibility of soil bacterial communities previously exposed to silver
forms (NP56 or Ag56) at 37ºC: (A) dBC (directly plated bacterial communities) and (B) pBC (pre-enriched bacterial communities). Data relative to non-exposed soil bacterial communities from the end of the experiment (CT56 for dBC and CT56 for pBC) was maintained for comparison purposes. Please see Table 1 and 2 (Chapter III) for sample identification. Data represent diameters mean ± standard deviation (n=4). (*) Statistical differences between soil treatments (CT56 vs. NP56 or CT56 vs. Ag56), for the same silver amount, according to one-way ANOVA (Dunnett's test) for p<0.05. Different letters (e.g. a and a’) corresponds to significant differences, for the same silver amount, within soil treatments (e.g. within NP56 or within Ag56) and between silver forms (AgNPs vs. Ag+), p<0.05 (two-way ANOVA) ... 126
Figure A6.3. Susceptibility of bacterial strains to silver exposure at 37ºC. In the figure: Escherichia coli ATCC 25922 was only used as control and is separate from the tested bacterial strains using a dashed line; Antibiotic imipenem (IMI) was only used for Pseudomonas putida. Please see Table 2 (Chapter III) for sample identification. Data represent diameters mean ± standard deviation (n=4). (*) Statistical differences among bacterial strains (Bacillus sphaericus ATCC 29726 vs. Arthrobacter arilaitensis GCNP1_I vs. Pseudomonas putida NCIMB 10432), for the same silver amount, according to one-way ANOVA (Dunnett's test) for p<0.05. Different letters (e.g. a and a’) corresponds to significant differences, for the same silver amount, within each bacterial strain (e.g. within Bacillus sphaericus ATCC 29726 or within Arthrobacter arilaitensis GCNP1_I or within Pseudomonas putida NCIMB 10432) and between silver forms (AgNPs vs. Ag+), p<0.05 (two-way ANOVA) ... 128
Figure A7.1. Susceptibility assays of the soil microbiota to AgNPs or Ag+ exposures, by disc diffusion method at 37ºC. Please see Table 2 (Chapter III) for sample identification details. Quadruplicate assay (R1, R2, R3 and R4) ... 129
Figure A7.2.Susceptibility assays of the soil microbiota (after recover to TSB) to
AgNPs or Ag+ exposures, by disc diffusion method at 37ºC. Please see Table 2 (Chapter III) for sample identification details. Quadruplicate assay (R1, R2, R3 and R4) ... 130
Figure A7.3. Susceptibility assays of the bacterial collections (P. putida; A. arilaitensis; B. sphaericus and E. coli) to AgNPs or Ag+ exposures, by disc diffusion method at 37ºC. Please see Table 2 (Chapter III) for sample identification details. Quadruplicate assay (R1, R2, R3 and R4) ... 131
VIII
LIST OF TABLES
CHAPTER I – GENERAL INTRODUCTIONTable 1. Silver nanoparticles (AgNPs) synthetized using the green method ... 12 Table 2. ENPs mentioned in the literature as causing environmental concern ... 14 Table 3. OECD and ISO regulations to evaluate the soil quality using the
microorgan-isms (Adapted from: Kuperman et al., 2014). ... 29
Table 4. Ecotoxicological tests to analyse the effect of silver nanoparticles in terrestrial
organisms ... 31
Table 5. Scientific classification of Porcellionides pruinosus (Adapted from: Geoffrey,
Fauna Europaea) ... 32
Table 6. Bacterial susceptibility tests applied to AgNPs ... 43
CHAPTER II - EFFECTS OF SILVER-NANOPARTICLES: PCR-DGGE PROFILES
SHOW CHANGES ON SOIL BACTERIAL COMMUNITY
Table 1. Sample identification of soil experimental setup. ... 62 Table 2. ANOSIM statistical analysis (R value; P=0.1%) generated from the patterns of
bands obtained by DGGE of the soil bacterial community (42 days). ... 68
Table 3. Richness (S) and shannon diversity (H’) and evenness (J’) indexes of the soil
bacterial community (42 days) ... 68
Table 4. ANOSIM statistical analysis (R value; P=0.1%) generated from the patterns of
bands obtained by DGGE of the soil bacterial community (56 days) ... 71
Table 5. Richness (S) and shannon diversity (H’) and evenness (J’) indexes of the soil
bacterial community (56 days) ... 71
CHAPTER III - SUSCEPTIBILITY OF SOIL BACTERIAL COMMUNITY TO
SILVER (NANOPARTICLE AND CATION)
IX
Table 2. Identification of the discs used in the susceptibility testing. ... 86
ANNEXES
Table A1.1 Main properties of LUFA 2.2 soil ... 115 Table A3.1. Composition on the medium TSB and MHA (MERK, Germany) ... 118 Table A4.1. Susceptibility patterns to the two antibiotics Imipenem and Ticarcillin -
Clavulanic Acid [Adapted from: CLSI document M100-S23 (M02-A11): “Disc diffusion supplemental tables”] ... 119
SCOPE, AIM AND STRUTURE OF THE THESIS
1
1.
Scope
Nowadays, one of the environmental challenges in global society is to maintain and improve the quality of soil, water and air. “Pollutants of emerging concern” are chemicals or materials that have the potential to threat or that represent a real threat to human/biota health or to the environment and to which legislation is lacking (Stuart & Compton, 2015). Concentrations of these recent pollutants in the environment are uncertain. This increases the difficulty in monitoring the quality of the environment (Ditta et al., 2015). Silver nanoparticles (AgNPs) fall into this category.
These nanoscale particles (1-100 nm) have been produced for years but large-scale production began only in past two decades with high impact in the industry and economy (Yu et al., 2013; Bour et al., 2015).
Due to large production (near 500 tons of AgNPs per year worldwide) and widespread use (Yu et al., 2013), the inevitable release of AgNPs from industry sources into the environment increased in the last years. Yet, the impact of AgNPs discharge is not fully known and there is a lack of legislation concerning their use in the industrial processes (Tourinho et al., 2012). Therefore, it is necessary to conduct studies to assess the potential effects of AgNPs on systems, particularly in the terrestrial compartment which is highly affected by AgNPs contamination (Tourinho et al., 2013).
AgNPs have highly appreciated antibacterial properties in a commercial point of view; yet these properties raise concern about AgNPs’ potential risk to the environment, in particular to the natural soil microbiota (Mirzajani et al., 2013). As AgNPs can interact with organisms and microorganisms (bacteria included) (Engelke et al., 2014) and because of bacterial communities’ ubiquity and their essential role in soil quality and function (Holden et al., 2014), the possible effects in the microbiota as a consequence of exposure/interactions with AgNPs must be investigated.
2
2.
Aim
Changes in the bacterial communities of the soil due to AgNPs’ presence might induce bacterial imbalance and pose a risk to the terrestrial ecosystem. In order to verify this hypothesis, this thesis aimed to evaluate the possible effects of the AgNPs in the bacterial communities of the soil using the standard LUFA 2.2 soil.
In line with this goal, both molecular approaches and culture-dependent methods were used in a complementary perspective. Thus, to achieve the main aim, the experimental design (Figure 1) was divided into two integrated tasks which detailed description follows:
1. Evaluation of the changes in soil bacterial community using Polymerase Chain Reaction-Denaturing Gradient Gel Electrophoresis (PCR-DGGE):
The effects of AgNPs and Ag+ (in the form of AgNO3) on structure, richness,
diversity and evenness of the soil bacterial community were evaluated. In this case, the bacterial community tested was the bacterial community from LUFA 2.2 soil after exposure to AgNPs or Ag+ to 5 µg/kg during 42 or 56 days and when the isopod Porcellionides pruinosus was included as a biota element.
2. Evaluation of the soil bacteria susceptibility using the disc diffusion method: The effects of AgNPs and Ag+ (in the form of AgNO3) on the susceptibility of the
soil bacterial communities were evaluated by measuring the growth inhibition zones around the discs loaded with each of the mentioned contaminants, in different amounts or when combined. In this case, the viable fraction of the bacterial community of LUFA 2.2 soil was tested (1) without previous exposure to silver and (2) after exposure to 5 µg/kg of AgNPs or Ag+ during 56 days.
3
SOIL EXPOSURE DURATION EXPOSURE
METHOD PCR-DGGE Disc diffusion
Structure Richness Diversity Eveness
TARGET SOIL BACTERIAL
COMMUNITIY Bacterial DNA from both viable
and non-viable soil bacterial cells
Viable soil bacterial cells
1. Time of exposure (56 days) 2. Silver form (AgNPs or Ag+) 1. Time of exposure (42 or 56
days)
3. Silver amount (0.1 µg; 1 µg and 10 µg)
2. Silver form (AgNPs or Ag+) 4. Combined exposure (5 µg AgNPs + 5 µg Ag+) 3. Porcellionides pruinosus
presence 5. Recurrence of exposure 6. Soil community vs. soil
bacterial groups 7. Plating method 8. Temperature (25ºC or 37ºC) AgNPs or Ag+ at 5 µg/Kg soil
OUTPUT Zones of growth inhibition
TESTED VARIABLES
56 days
Figure 1. Experimental design: bacterial community from LUFA 2.2 soil was analyzed by two methods, disc diffusion (culture-dependent method) and PCR-DGGE (culture-independent method).
3.
Structure
This thesis is organized in four chapters with annexes.
The first chapter (CHAPTER I) pretends to introduce the problematic of soil pollution by silver nanoparticles (AgNPs) and the potential influence of this nanoparticles to bacterial communities including a literature review.
The second chapter (CHAPTER II) is structured as a scientific paper describing the effects of AgNPs on the soil bacterial community using PCR-DGGE.
The third chapter (CHAPTER III) is also structured as a scientific paper, describing the susceptibility of soil bacterial community to AgNPs using the disc diffusion method.
The last chapter (CHAPTER IV) is a global discussion providing also the main conclusions about the work along with the perspective for future work.
The ANNEXES include relevant additional information (e.g. data from other pratical studies done along with the work presented in this thesis).
CHAPTER I
GENERAL INTRODUCTION
7
1.
Nanotechnology
Since the nineties, and particularly in the last few years, nanotechnology became a fast-growing sector (Fajardo et al., 2014), particularly in the USA, Europe and East Asia (Nel et al., 2006). This science has occupied the center stage in scientific research, in terms of number of research investigations and the quantum of research funding (Pratap, 2015). It has grown into a billion dollar research enterprise with a rapid commercial deployment. Global market for products based on nanotechnology is predicted to grow from $147 billion in 2007 to $3.1 trillion in 2015, according to the research firm Lux Research (Schmidt, 2009).
Nanotechnology is defined as: “the application of scientific knowledge to control and utilize matter in the nanoscale, where properties and phenomena related to size or structure can emerge” - this definition was published by the International Organization for Standardization (ISO) in the ISO/TS 80004-1 from 2010 which lists terms and definitions related to core terms in the field of nanotechnologies. Overall, nanotechnology includes the production, manipulation and use of nanoscale materials which include nano-size particles: the nanoparticles (NPs) (Suresh et al., 2013). The major aim of this science is to use bulk materials to obtain nanoscale (1-100 nm; 1 meter = 1 000 000 000 nanometers) materials with new and different properties. This process includes structural and atomic arrangements to lower the size to the nanoscale (Dinesh et al., 2012).
1.1. Nanoparticles versus nanomaterial: definition and distinction
In general, NPs are singular small objects that behave as a whole unit with respect to its transport and properties. Nanomaterial is simply a physical object with at least one dimension in the nanoscale (Cornelis et al., 2014). However, these definitions have been changed in the last years, to reach consensus in the scientific community. In 2008 nanoparticles were defined by ISO/TS 27687 as “nano object with all three external dimensions at the nano scale”. Recently, the ISO modified the list and definitions related to NPs and particles in the field of nanotechnologies (ISO/TS 80004-2:2015). In this case, the nanoparticles were redefined as “nano-object with all external dimensions in the nanoscale where the lengths of the longest and the shortest axes of the nano-object do not differ significantly”. On the other hand, the nanomaterial definition was
8
established in 2011, by the EC (European Commission): “Nanomaterial means a natural, incidental or manufactured material containing particles, in an unbound stage or as an aggregate or as an agglomerate and where for 50% or more external dimensions is in the size range 1 nm-100nm”.
1.2. Regulation
Since 2004, the regulation and overview of environmental, health and safety (EHS) risks associated with nanotechnology have been undergoing significant developments in the European Union; many were linked with adaptations or recast of existing regulatory frameworks (Justo-Hanani & Dayan, 2015).
Currently, three European regulations incorporate the definition of nanomaterial to enable their use in cosmetics (EC/1223/ 2009), food labelling (EU/1169/ 2011) and the biocidal products (EU/528/ 2012) (Justo-Hanani & Dayan, 2015). After that, in 2012, the EC published the Second Regulatory Review on Nanomaterials. This year, some definitions present in the ISO/TS 27687:2008 was reviewed (ISO/TS 80004-2:2015) to facilitate the communications between industry and external organizations.
Despite all the improvements, the current regulations still needs further information and general rules are required, especially regarding ENPs production, use and disposal. Another gap in regulation consists of the inexistence of a CAS (Chemical Abstracts Service) register number for ENPs. Today, this number is the same for the bulk form and for the respective ENPs. Though they both might seem identical, differences in chemical properties and consequently in the potential environmental toxicity are evident. There is still the necessity to recognize ENPs as a new class of chemicals (Bondarenko et al., 2013).
1.3. Source of nanoparticles
NPs exist in the environment since the beginning of Earth’s history and have distributed in earth’s atmosphere, ocean surface, soil and even living organisms (Smita et al., 2012), thus NPs can be classified as having natural source. However, other sources of NPs exist, namely due to unintentional and/or intentional anthropogenic activities (Smita et al., 2012; Rana & Kalaichelvan, 2013).
9
1.3.1. NPs from natural sources
Natural silver nanoparticles (AgNPs) were discovered in the San Miguel Tenango mining area from Texas (Gomez-Caballero et al., 2010).
Several million tons per year of natural NPs are estimated to be released into the environment. Natural NPs can have different sizes and can be released into the atmosphere as a result of forest fire, weathering and volcanic activity, among others. They can be transported over thousands of kilometers and remain suspended in the air for several days (Rana & Kalaichelvan, 2013). On the other hand, plants might absorb these natural NPs or the respective released metal ions (Gardea-Torresdey et al., 2003).
The natural occurrence of NPs drive attention into a new field of research: the green synthesis of NPs involving environmental friendly reducing agents and nontoxic stabilizing agents (Yu et al., 2013).
1.3.1.1.
Green nanoparticles (gNPs)
Biosynthetic processes of obtaining NPs, called the green synthesis method, and where plant extract or microorganisms (bacteria or fungi) are used for the synthesis of NPs, is receiving much attention as an alternative for the production of metal NPs (Bindhu & Umadevi, 2015).
Green synthesis method is simple, fast and inexpensive. This method is based in reducing salts (e.g. silver nitrate) but dependent on several factors: the type of plant extract, the organic content, the concentration of the salt used, the temperature, among others (Mohanpuria et al., 2008; Abdel-Aziz et al., 2013).
Furthermore, this method can potentially eliminate the adverse effects of chemical agents in products’ application because no chemical ingredients are added therefore making nanoparticles more biocompatible. Thus, this technique enables the production of ecofriendly NPs, possible nontoxic to the environment (Park, 2014; Bindhu & Umadevi, 2015).
Table 1 summarizes some research works with green synthesis of AgNPs
showing a good antibacterial activity against several bacteria (Savithramma et al., 2011; Park, 2014).
10
Considering the above mentioned advantages, this method show promise in the application of gNPs in the food industry (Makarov et al., 2014). Nevertheless, this methodology did not yet attract the interest of industries because the obtained NPs are still highly diverse in their shape and size (Makarov et al., 2014). This is comprehensible as size is one of the most critical criteria: the range in size should be as narrow as possible to target specific applications (Dipankar & Murugan, 2012). Consequently, studies for the implementation of this methodology in industries are still necessary.
Overall, the “green synthesis” of NPs is not yet incorporated in daily products and engineer NPs still leads nanotechnology processes.
11
Table 1. Silver nanoparticles (AgNPs) synthetized using the green method.
Synthetized AgNPs Antibacterial susceptibility
Main achievements: antibacterial potential# References
Bulk material Preparation Characterization† Size/shape Concentration/Amount Method§ Tested bacteria Bacteria
Bacillus megaterium
(NCIM 2326)
Cell filtrates were mixed with AgNO3
(1 mM). UV-vis FTIR Size: 10-12 nm. 5, 10, 15, 20 µl/disc DD Streptococcus pneumoniae Salmonella typhi The synthesized Ag-BNPs have high antibacterial activity against S. pneumoniae and moderate activity against Salmonella typhi. Saravanan et al., 2011
TLC
AFM
Leaf aqueous extracts
Iresine herbstii Leaf (10 mL) was added to aqueous solution of AgNO3 (90 mL, 1 mM).
UV-vis Size: 1.2 nm. 50, 100, 150, 200, 250 µg/mL WD Staphylococcus aureus AgNPs exhibited strong antibacterial activity against all bacteria but maximum effect was agaisnt E. coli: ZoIE. coli=15.7±0.6 mm. K. pneumoniae only showed growth
inhibition at 100 g/mL.
Dipankar & Murugan, 2012
XRD Enterococcus faecalis
SEM Escherichia coli
EDX Klebsiella pneumoniae
FTIR Pseudomonas aeruginosa
Leaf extract
Chenopodium murale Leaf extract (1 mL, 0.2 g/mL) was mixed with aqueous solution of AgNO3 (50 mL, 5x10⁻³ M).
UV-vis Size: 30-50 nm. 0.1 mL/well WD Staphylococcus aureus AgNPs showed higher antimicrobial activity against S. aureus than AgNO3 (5 mM). Abdel-Aziz et al., 2013
TEM
Pine mushroom extract
Tricholoma matsutake Mushroom extract was treated with an aqueous solution AgNO3 (1 mM).
UV-vis Size: 10-5 nm. 5 µg/disc DD Escherichia coli Excellent antimicrobial activity: ZoIE.coli=21.00 mm; ZoIB. subtilis=18.0 mm. Anthony et
al., 2014
XRD Shape: spherical,
homogeneous. Bacillus subtilis
FTIR
Fungus
Curvularia tuberculata The fungal freecell (10 g mycelia mixed with 100 mL deionized water) was added to AgNO3 (1 mM).
UV-vis Size: 20-70 nm. 50, 100 µL/mL WD Escherichia coli (ATCC 25922) The bacterial growth inhibition at 50 µL/mL of AgNPs was slightly lower (ZoI=13-24 mm) than at 100 µL/mL (ZoI=15–26 mm). For both concentrations of AgNPs, P.
aeruginosa showed the highest ZoI while P. mirabilis showed the lowest ZoI.
Muhsin & Hachim, 2014 TEM Shape: spherical,
disperse or aggregate. Staphylococcus aureus (NCTC 6571)
FTIR Proteus mirabilis
Salmonella typhi
Flower extract
Chrysanthemum indicum
Flower extract (5 mL) mixed with AgNO3 (500 mL, 1 mmol).
UV-vis Size: 37.71-71.99 nm; 25 μg/disc DD Bacillus subtilis (MTCC 121) Highest activity: ZoIE. coli=13.00±0.90 mm; ZoIK. pneumoniae=19.10±0.50 mm Arokiyaraj et
al., 2014
XRD In average: 52.9±4.6 nm. Staphylococcus aureus (MTCC 96) Moderate activity: ZoIP. aeruginosa=9.60±0.51 mm; ZoIS. aureus=8.33±0.57 mm
TEM Shape: spherical, smooth surface, poly-dispersed. Staphylococcus epidermidis (MTCC 435) Nule activity: B. subtilis and S. epidermidis
EDX Escherichia coli (MTCC 433) Antibacterial activity of AgNO3 only occured for: ZoIK. pneumoniae=7.00±0.50 mm Klebsiella pneumoniae (MTCC 109)
Pseudomonas aeruginosa (MTCC
1934) Lemon
Citrus limon
Lemon extract was mixed with AgNO3 (10-2 M to 10-4 M).
UV-vis Size: 58.7 nm. 15 µL/disc (5 mg of AgNPs) DD Aeromonas hydrophila Highest zone of inhibition against E. tarda and S.aureus. AgNO3
exhibited highest inhibitory zone against all bacteria compared to the synthetized nanoparticle.
Swain et al., 2014
SEM Edwardsiella tarda
Pseudomonas aeruginosa Flavobacterium branchiophilum Staphylococcus aureus Bacillus cereus
Vibrio and Citrobacter species
Vasaka leaf extract
Justicia adhatoda L.
Vasaka leaf extract (0.2 mL) was
mixed with AgNO3 (20 mL, 1 mM). UV-vis Size: 5-50 nm;
DD=50 µL/disc; WD=50
µL/well; DD
Pseudomonas aeruginosa (MTCC
741)
DD: AgNPs caused ZoIP. aeruginosa=7–9 mm being as efective as AgNO3 (ZoIP. aeruginosa=8–10 mm).
Bose & Chatterjee, 2015 TEM In average: 20 nm. SD=50 µL bacteria in 1mL of
AgNPs WD
WD: strong efficiency to inhibit P. aeruginosa (average ZoI=1.36–1.4 cm).
Shape: spherical,
agglomerated. SD
SD: inhibit the growth of P. aeruginosa at the concentration of 10-5 M. Beetroot extract Beetroot extract (1 mL) mixed with
aqueous solution of AgNO3 (50 mL, 3
mM).
UV-vis Size: 15 nm. 50 µg/mL DD Escherichia coli (ATCC 25922) Moderate antibacterial activity: ZoIE. coli=7mm Bindhu &
Umadevi, 2015
XRD Shape: spherical,
monodispersed. Pseudomonas aeroginosa (ATCC 27853) Good antibacterial activity:
TEM Streptococcus aureus (ATCC 12384) ZoIP. aeruginosa=11 mm; ZoIS. aureus (ATCC 12384)=16 mm; ZoIS. aureus (ATCC 25923)=19 mm.
EDX Staphylococcus aureus (ATCC 25923)
† Methods used for characterization of AgNPs: UV-visible spectroscopy (UV-vis); Fourier transform infrared spectroscopy (FTIR); Thin Layer Chromatography (TLC); Atomic Force Microscopy (AFM); X-ray diffraction (XRD); Scanning electron microscope (SEM); Energy-dispersive X-ray spectroscopy (EDX); Transmission
12
1.3.2. Anthropogenic sources
NPs might appear accidentally in the environment due to anthropogenic activities for instance when NPs are originated from vehicles exhaustion or derivate from different industrial processes (Smita et al., 2012). Additionally manufactured or engineered NPs (ENPs) might also be released into the environment (air, water and soil) after use of the industrial products containing ENPs (Fajardo et al., 2014).
The industrial production of ENPs has increased their concentrations in the environmental compartments (Rana & Kalaichelvan, 2013). The major difference and the one that raises concern, between naturally-occurring and anthropogenic resulting nanoparticles, is that the latest are not biodegradable meaning that they can persist in the environment and interact with organisms and microorganisms with unknown consequences (Fajardo et al., 2014). Probably, the ENPs might cause more adverse effects in the biota than those naturally-occurring NPs because the organisms never contacted before with these ENPs.
1.3.2.1.
Engineered nanoparticles (ENPs)
Large numbers of ENPs have been produced for different industrial and biochemical applications (Fajardo et al., 2014). Due to reduced dimension and high superficial area ratio, ENPs acquired novel and unexpected properties relative to their bulk material, such as physic-chemical, opto-electronic, magnetic and biological properties (Suresh et al., 2013).
These properties become economically attractive due to their advantage after incorporated into daily products or industrial processes. Nowadays, ENPs are present in several daily products of various sectors: energy (catalysis), materials (paints, sportswear), electronics (chips and screen), optics, remediation (disinfection, water filters), food (additives), cosmetics (skin lotions), medicine (catheters, diagnostics, drug delivery), agriculture products, among others (Pulit-Prociak et al., 2015).
ENPs can be characterized according to their structure (Suresh et al., 2012; Sharma et al., 2014): shell can be classified as inorganic (e.g. silver sulfide, silver chloride) or organic (e.g. citrate, polyvinyl-pyrrolidone) while the core includes various classifications, such as quasi-spherical, nanotubes, rods, triangular nanoplates, among others (Sharma et al., 2014).
13
The composition of the surface of NPs is very important to maintain their stability. Many NPs lose their properties when they aggregate or precipitate in a suspension which is solved by adding a surface coating that facilitates dispersion. All these characteristics will influence the behaviour and transformations that NPs undergo in the environment (Levard et al., 2012).
The biological reactivity, the toxicity and the antimicrobial activity, is dependent on NPs’ characteristics (Suresh et al., 2012; Sharma et al., 2014).
The toxicity of ENPs as well as AgNPs, is highly dependent on its physical properties such as size, class, shapes, superficial area and surface coating (which acts as a stabilizer), dose of exposure, on their biocompatibility, reactivity, method of synthesis, among others (Suresh et al., 2012; Savithramma et al., 2011; Sharma et al., 2014).
Compared to NPs’, the bulk form releases ions in a moderate way for a longer period of time while higher amounts are briefly released from the superficial area of NPs. Due to this, the toxicity of the compound is dependent on the release of their ions (Thiéry et al., 2012).
Studies by Suresh and their collaborators (2012) showed that the toxicity is different between shapes and that the spherical shape is more toxic than rod shape (Suresh et al., 2012). In the case of AgNPs, the triangular shape has more reactivity to bacteria than the rod or spherical shapes (Pal et al., 2007).
The biological reactivity of NPs means that surface atoms are labile and can easily change its redox state (Thiéry et al., 2012) to distinctly affect the biota. In general, when ENPs decrease in size, their biological reactivity and, consequently, their toxicity increases (this has been reported for AgNPs) (Suresh et al., 2012). Therefore, ENPs dimensions have an inverse proportionality in relation to toxicity, meaning that high dimension might cause low toxicity (Sharma et al., 2014).
The antimicrobial activity is also dependent on the type of ENPs (metal nano-based) and on the microorganisms with which interact (Sharma et al., 2014).
Some of the ENPs which are causing environmental concern due to toxicity risk are mentioned in Table 2 (Klaine et al., 2008; Rana & Kalaichelvan, 2013).
14
Table 2. ENPs mentioned in the literature as causing environmental concern.
Nanoparticles Examples References
Fullerenes Fullerenes rings, carbon nanotubes and nanocones. Rana & Kalaichelvan, 2013 Metal nanoparticles Elemental silver (Ag), gold (Au) and iron (Fe). Sharma et al., 2014 Oxides Binary compounds when including carbides, nitrides
(e.g NO3).
Sharma et al., 2014
Complex compounds Alloys, composites, nanofluids, (consisting of two or
more elements; e.g. cobalt, zinc and iron oxide). Rana & Kalaichelvan, 2013
Quantum dots (or q-dots) CdSe. Klaine et al., 2008
Organic polymers Dendrimers, polystyrene. Pal et al., 2007
2.
ENPs: Silver nanoparticles (AgNPs)
Among all the manufactured NPs, the AgNPs plays a major role in the field of nanotechnology (Rana & Kalaichelvan, 2013) due to their broad application as a result of their antimicrobial activity (Losasso et al., 2014).
According to the Silver Institute, approximately 5% of the global silver production is used for production of AgNPs. The global production of AgNPs is estimated in 55 tons per year reaching 11 million Euros in 2015 therefore, being among the most used ENPs (Mueller & Nowack, 2008; Piccinno et al., 2012).
In a total of 1854 nano-base products (containing ENPs), the AgNPs are incorporated in more than 410 commercialized products (Woodrow Wilson Database of 2014) distributed by different sectors as Figure 2 shows. Most nano-based products are targeted to paint industries (35%) and cosmetics (25%) (Muller & Nowack, 2008).
Products based in AgNPs are particularly attractive owing to anti-inflammatory activity (Vaidyanathan et al., 2009) and protection of the skin against unwanted microbial action. For instance, the incorporation of AgNPs in soap is a slightly change in the soap formulation that adds value to the previous existing product by: (1) adding new properties (inhibition of acne) and (2) selecting a distinct target consumer. AgNPs coatings have been commonly used to treat infected wounds and the prevention of biofilm formation on home appliances (Sheng & Liu 2011).
15
Figure 2. Silver nano-based products in different commercial products (Adapted from: Muller & Nowack, 2008).
Another application of AgNPs based products is dental implants and toothpaste or tooth cleaning gels. AgNPs reduce the attachment of bacteria to the surfaces of dental implants preventing the formation of biofilms on the implant surface that may cause infection. In tooth paste, odors and dental cavities are reduced or eliminated due to the antibacterial effect of this nanoparticle (Sivolella et al., 2012).
AgNPs are also impregnated into the structures of socks, trousers and other textile products. Nanoparticles incorporation prevents the penetration of bacteria into hard-to-reach places inhibiting bacterial growth: odors as well as prejudicial bacteria responsible for disease (as Staphylococcus aureus and Escherichia coli) were eliminated (Vaidyanathan et al., 2009). Doors, windows and paints of new building materials have also AgNPs. AgNPs also offer a wide range of possibilities for the use of polyurethane foam characterized by its biocidal properties (Pulit-Prociak et al., 2015).
This nanoparticle can be also incorporated in food packaging enhancing protection of food products against the surrounding environment, inhibiting or retarding microbial growth and extending food shelf life (Azeredo, 2013).
16
2.1. AgNPs versus bulk form (Ag cation: Ag
+)
Silver metal has been used in different applications due to high silver electrical and thermal conductivity properties (Panyala et al., 2008) as well as in medicine to fight infections and in food industry to prevent spoilage (Rai et al., 2009). However, because of silver metal toxicity to human cells (Echavarri-Bravo et al., 2015), its use in medicine was discouraged. In this line of though, AgNPs have opened the range of applicability providing new properties that confer advantage particularly because AgNPs is not toxic for human cells (Echavarri-Bravo et al., 2015) as comproved using skin in vivo and keratinocytes in vitro (Samberg et al., 2010).
Comparison between silver metal and the nanoparticle forms shows that the main difference is that the surface/volume ratio is higher in the nanoparticle thus leading to higher biological reactivity (contact with the microorganisms is improved) (Choi et al., 2008; Losasso et al., 2014). Also, in the bulk form, the rapid release of ions is linked to high toxicity of silver bulk forms while for AgNPs, the release of ions occurs in a longstanding manner being more persistent in the environment (Fajardo et al., 2014).
2.2. Emission and exposure scenarios of AgNPs into the environment
AgNPs can be released into the environment in different states: uncoated, functionalized, aggregated or embedded in a matrix (Gottschalk & Nowack, 2011).
During the life cycle of the NMs containing AgNPs, which covers production, use and disposal, the AgNPs might represent hazard to the technosphere, to the distinct environmental compartments and to the associated biota (humans included) (Som et al., 2010) (Figure 3).
Considering the long duration of NMs life cycle and the opportunities they represent for novel applications, it becomes clear how extensive can be the exposure scenarios and the potential adverse effects (Som et al., 2010).
The highest probability of direct exposure to NMs is during “production” stage. NMs containing AgNPs might be directly released into the environment at this life cycle stage. Ideally the AgNPs and Ag+ released at production stage should undergo treatment inside Waste Water Treatment Plants (WWTP). However, the synthesis process often involves mixing, centrifugation and ultrafiltration steps to remove impurities and the
17
waste is directly discharged into the environment or into WWTP without proper prior treatment (Yu et al., 2013).
Figure 3. Life cycle stages of nanomaterials (NMs) and their environmental fate (Adapted from: Som et al., 2010).
The uncontrolled release of silver during the use (including recycling) and disposal stages gives rise to additional public concern (Yu et al., 2013).
Exposure to NMs during the “use” life cycle stage occur from intended applications (e.g. using sunscreen containing NMs) but also from unintended sources (e.g. release of NMs from nano-textiles). Cleaning products, creams and cosmetics have AgNPs contained in liquid phases which are easily released within hours after application, whereas NPs embedded into a solid matrix (paints) are gradually released and are supposed to remain in the soil matrix for years (Som et al., 2010).
The “disposal” life cycle stage includes the release of NMs into the environment, which can either occur at the end-of-life of NMs or when they are disposed into landfills or burned in waste incineration plants (Gottschalk & Nowack 2011; Som et al., 2010). Little is known about the clearing efficiency of nanoparticles in WWTP. Benn and Westerhoff (2008) showed that WWTP biomass is able to largely reduce the metallic nanoparticles in the effluent stream. The retention of Ag in WWTP may strongly depend on Ag speciation (e.g. Ag2S) in the influent and it does alter along different
treatment stages. Also, different Ag removal efficiencies and transformation processes may control the retention of metallic AgNPs within WWTP (Kaegi et al., 2011).
18
Unfortunately, in many countries untreated sewage sludge is often used as agricultural additive or fertilizer in a landfill (Keller et al., 2013). So it is expected that in these hazardous substances may be released into the soil, ultimately reaching the groundwater. Because of this, the “disposal” life cycle stage is an important source of environmental contamination by AgNPs (Gottschalk & Nowack 2011).
As a result, it is guaranteed and inevitable that AgNPs are being released into the environment (soil, water and air) (Tourinho et al., 2012), at an unknown rate or concentrations. Nonetheless some predictions of AgNPs concentrations were made. Modelling the Predicted Environmental Concentrations (PEC) is very difficult because the production volumes are continuously increasing (Rana & Kalaichelvan, 2013). Still, Gottschalk and collaborators (2009) demonstrated that, in Europe, the values of PEC for AgNPs in soil could reach 0.227 µg/Kg per year. These environmental concentrations were calculated as probabilistic density functions and were compared to data from ecotoxicological studies. Also, Muller and Nowack (2008) suggested that the PEC for AgNPs in soil could reach 0.02 µg/Kg or 0.1 µg/Kg in a realistic or in a high-emission scenario, respectively.
Studies by Tønning and collaborators (2012) pointed that the contamination of nanosilver, only analyzing textiles’ production on the Danish market, involved the release into the soil of an amount of 0.1 mg Ag/kg soil (dry weight).
Boxall and collaborators (2007) estimated that the penetration of AgNPs into the soil was 4.26 µg/Kg. This value was corroborated by Faust and Backhaus investigation (NanoFATE) suggesting it as a worst case scenario estimation for each environmental compartment. The PEC of AgNPs in Europe soil was determined by NanoFATE project conceived to link methodological gaps to environmental risks by ENPs and is represented in Figure 4.
19
Figure 4. Predicted concentrations (PEC) of AgNPs (ng/kg dry weight soil) in Europe (expecting 57% of agricultural land used, minimum NPs transfer to sludge and a 25 cm ploughing depth). In the figure: highest PEC was determined for England (> 10 ng, represented in red); the most abundant PEC rounds 5-10 ng/kg dry weight of soil in central and south of Europe (represented in orange) while the lowest PEC (0-5 ng/kg dry weight of soil) is represented in yellow (Faust & Backhaus, NanoFATE).
2.3. AgNPs interactions in soil compartment
The soil compartment is a dynamic and complex system supporting the habitat for microorganisms, organisms and humans, which interacts with water and air compartments (van Gestel, 2012).
The interaction between AgNPs and environmental matrices is complex. Both abiotic and biotic factors may influence the transformation and bioavailability of AgNPs in the environment (Dwivedi et al., 2015).
AgNPs contamination in soil can undergo distinct routes. AgNPs may be partially degraded and migrate into other ecosystems (Klaine et al., 2008) for instance it can be mobilized into groundwater or be biomagnified (through the food chain and ultimately affecting human health) (Dror et al., 2015).
The AgNPs that remain in the soil matrix can interact with the surrounding environment and biota in different ways (Figure 5), either directly or indirectly (Klaine et al., 2008; Dinesh et al., 2012). AgNPs can directly interact with the biota (e.g. microorganisms, plants and invertebrates) or indirectly when dissolved in the interstitial water or aggregated into the soil pores (Klaine et al., 2008).
AgNPs may experience aggregation, dissolution, redox reactions, photo-transformations, among others (Fabrega et al. 2011). These processes are dependent on


![Figure 6. Interactions between silver nanoparticles and environment. The figure shows the major characteristics of AgNPs (green) and the environmental conditions [pH, DO (dissolved oxygen), organic matter and salt concentration] (red) affecti](https://thumb-eu.123doks.com/thumbv2/123dok_br/15911230.1092693/40.892.172.662.382.694/interactions-nanoparticles-environment-characteristics-environmental-conditions-dissolved-concentration.webp)