© 2019 WIT Press, www.witpress.com
ISSN: 2058-8305 (paper format), ISSN: 2058-8313 (online), http://www.witpress.com/journals DOI: 10.2495/TDI-V3-N3-222-231
CHARACTERIZATION OF ROAD TRAFFIC
EXTERNALITIES IN AN INTERCITY CORRIDOR
CARLOS SAMPAIO, ELOÍSA MACEDO, MARGARIDA C. COELHO, JORGE M. BANDEIRACentre for Mechanical Technology and Automation (TEMA), University of Aveiro, Portugal ABSTRACT
This paper aims at evaluating road transport externalities in an intercity corridor taking into account the energetic and economic characterization of the available road transport modes: intercity bus, in-dividual transport and shared mobility. One of the purposes of this analysis is to identify the external costs (EC) and private costs (PC) of each mode/route and to which extent the best environmental option can be also considered as the best economical option. Results show the intercity bus at full or half occupancy is the best option in terms of EC, followed by the shared mobility. Regarding the PC, results suggest that the best option is the shared mobility along route 1 (motorway), followed by the intercity bus. When comparing both routes, route 1 has less PC than route 2 (national road). In order to reduce the overall environmental impacts of a transport system, one solution might be the reduction of the EC through an optimization of the PC, ensuring that the option with less EC is also the option with less PC, so that it can encourage users to choose routes and transport modes with less environmental impacts.
Keywords: externalities costs, intercity bus, intercity corridors, private costs, shared mobility.
1 INTRODUCTION
In the European Union, the transportation sector represents 33% of the energy consumption (2016) and is responsible for 21% of greenhouse gas (GHG) emissions [1]. In particular, in Portugal, and according to latest data of 2016, this sector remains the main driver of GHG emissions (24%) and represents a major proportion of the final energy consumption (37%) [2]. Road transport is by far the largest contributor to energy consumption and GHG emis-sions. In Portugal, rural roads and motorways represent 58% of the total vehicle-kilometres travelled in 2014 [3]. It is therefore important to reduce the use of road vehicles by fostering the use of both public transport and shared mobility. Among the parameters that influence modal and route choice are price, travel time, frequency, comfort and personal safety, while environmental considerations seem to be discarded.
The main objective of this paper is to assess an intercity corridor from environmental, energetic and economic perspectives and for that purpose, all road transport modes available in the corridor are evaluated: individual transport, shared mobility and public transport (bus).
2 LITERATURE REVIEW
The topic of intercity corridors has been receiving attention in the past years, mainly the impacts that the intercity traffic has in the environment, as well as road pricing schemes for this type of roads [4,5].
Recent studies showed the introduction of eco-routing strategies might be a good way to decrease the total emissions of intercity corridors [6]. Considering a multiobjective route optimization problem with environmental concerns, it is shown that distributing traffic with the objective of minimizing the overall impacts, a reduction of 9% in terms of environmen-tal costs can be achieved with a small variation on travel times [6]. Moreover, studies show that within a travel time variation of just 10%, it is possible to obtain carbon dioxide (CO2) savings around 11% [7,8]. Selection of routes with less environmental impacts can lead to
overall emission savings [9]. Faster intercity routes lead to less fuel consumption and CO2 emissions but may imply an increase up to 150% in the emissions of other pollutants [10]. In the context of route choice with environmental concerns, the trade-offs between travel times and overall emissions should be studied [11]. A routing choice analysis involves studying driver behaviour and routing guidance or strategy is very important to assess the real effec-tiveness of new and future measures. Although a new system may reduce externalities associ-ated with road transport, the measures may not be well seen by road users [12], as drivers are only willing to pay if they see benefits in it [13].
A study from the United States focused on the most commonly used intercity modes of transport (aircraft, intercity bus and passenger cars) shows the intercity bus is the most effi-cient mode of transport in terms of fuel usage and has the lowest per-passenger emissions for all the ranges of distance studied [14]. Intercity buses have great importance to persons with no car, being an economically viable, environmentally friendly and a socially inclusive mode of transport for long-distance travel [15].
However, very few studies have been devoted to considering shared mobility within inter-city passenger transport context. Moreover, a comparison between public transport and indi-vidual/shared vehicles has not been discussed. The objective of this paper is to analyse and compare the external and private costs (EC and PC) of each transport mode and route. For that purpose, an intercity corridor in Centro Region, Portugal, linking the cities of Aveiro and Coimbra will be used as a case study. This assessment can be of potential interest to increase the attractiveness of transport modes and routes with fewer externalities associated.
3 METHODOLOGY
The methodology used in this study comprises the traffic characterization and the estimation of impacts, fuel consumption and economic characterization parts.
The first part is devoted to studying the mobility patterns in the intercity corridor between the cities of Aveiro and Coimbra, Centro Region of Portugal, and for that purpose, the Sus-tainable Urban Mobility Plan of Aveiro [16] is considered. Regarding the routes, those that are available for individual/shared mobility are obtained using Google Maps [17], while bus route is obtained from [18].
A second part involves estimating impacts and fuel consumption by using data related to distance and time travelled.
3.1 Traffic characterization
Coimbra is one of the main destinations for intercity trips from Aveiro. Almost 5% of inter-city trips from Aveiro have as destination Coimbra, being Coimbra the origin of around 3% of the trips to Aveiro. In terms of the modal split, 68% of the trips are based on individual transportation and only 2% are using the intercity bus, being the remaining 30% by others means of transport [16].
In terms of individual transport by car, it is possible to obtain different routing options between Aveiro – Coimbra using Google Maps [17]. For this particular case, two differ-ent options were considered, one by national roads and the other by motorway. For the intercity bus, the values of travel time and distance were obtained in [18]. The travel time and distance of both modes of transport and for each route are presented in the informa-tion provided in Table 1 is retrieved from Google Maps [17]. It can be observed that the travel time may vary depending on the type of road. Both are similar when comparing the
Origin-Destination Aveiro – Coimbra and Coimbra – Aveiro, so the values presented here are only for the first case.
The population grid affected by these routes is depicted in Fig. 1.
From the results obtained regarding travel time, the route using the motorway yields lower travel times for individual transport, followed by a route using the bus (which also uses the motorway). In terms of population distributions, there is a high level of the population poten-tially exposed to traffic pollution in the national road, with an average of population density of 678 hab/km2, against an average of 517 hab/km2 in the surroundings of the motorway
linking the two cities. Recent studies show the population density factor can change the route with better environmental performance [19] since the values of EC increase with more people potentially exposed.
Table 1: Travel time and distance for each route (motorway and national road) between Aveiro and Coimbra for travelling by individual transport or bus.
Mode Route Travel time Distance
Car Motorway (route 1) 42 min 58.4 km
Car National (route 2) 1 h 6 min 57.1 km
Intercity bus Motorway (route 1) 45 min 62.0 km
Figure 1: Road options and population affected represented in a 1 × 1 km grid for each route considered between Aveiro and Coimbra.
3.2 Fleet characterization
An energetic, economic and environmental characterization will be made between all the modes of road transport considered: individual transport, intercity bus and shared mobility. The vehicle technology that will be analysed is a EURO6 diesel/gasoline vehicle 1.4–2.0 L, and the intercity bus is a EURO6 <=18 ton, able to transport 52 passengers at full capacity. Different occupancy rates will also be evaluated (Table 2).
3.3 Estimating Associated Costs
The model used in this work to estimate pollutant emissions and fuel consumption is the COPERT4 [20], a widely used computer software in Europe. The pollutants under study are the CO2 (carbon dioxide), NOx (nitrogen dioxides), NMVOC (non-methane volatile organic compound) and PM2.5 (particulate matter with a diameter of 2.5 µg or less) and the externalities costs are estimated using the updated values reported in [21]. Table 3 displays the economic factor (ec) values for Portugal. With respect to the impacts of local pollutants, population exposure is considered in the surroundings of each route based on the methodology recently described in [19]. The EC are estimated using the expression (1):
Mode Occupancy
(#passengers) Key
Intercity bus 10 Bus low
Intercity bus 26 Bus half
Intercity bus 52 Bus full
Individual transport diesel 1 dPassenger_1
Shared mobility diesel 2 dPassenger_2
Shared mobility diesel 3 dPassenger_3
Shared mobility diesel 4 dPassenger_4
Individual transport gasoline 1 gPassenger_1
Shared mobility gasoline 2 gPassenger_2
Shared mobility gasoline 3 gPassenger_3
Shared mobility gasoline 4 gPassenger_4
Table 2: Different occupancies simulated for each mode of transport.
Pollutant Economic factor (€/ton)
CO2 90
NOx 1,957
NMVOC 1,048
PM2.5 196,335
EC
=
GP ec
i+
∑
LP ec f
i i , (1) where f pd, =
1 500 is the adjustment factor related to average population density pd [19], ec is the economic factor for each pollutant i, GP is the global pollutant (CO2, not affected by population density) given in ton and LPi denotes the local pollutant i in ton.
An important component under costs is directly related to the user costs (UC), in which the average fuel and toll costs for individual transport should be taken into account.
From the passenger perspective, the costs associated with an intercity bus trip are related to the ticket price and for the shared mobility option, the average price presented at [22] is considered.
Furthermore, to calculate the PC, a methodology to estimate the value of (travel) time is used. The usage that the users do to their time while travelling is also an important factor [23]. It is proposed by [24] values of travel time cost for Portugal of 6.67€/h for the case of travel-ling by car, and 6.14€/h in case of bus. Regarding the case of shared mobility, a special value is suggested to be included, an intermediate value of 6.41€/h. Then, the PC can be given by:
PC UC tt= + ×tfmode, (2)
where tt is the travel time (h) and tfmode is the factor that represents the travel time cost per hour.
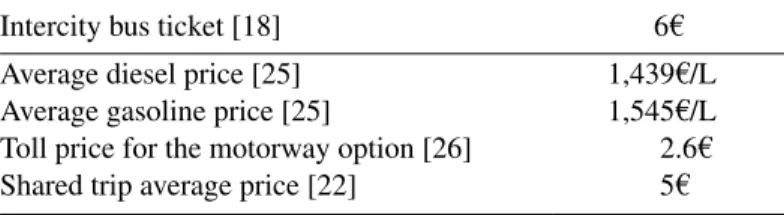
The average prices used in this study are presented in Table 4. 4 RESULTS
This section is devoted to presenting and discussing the results obtained for the mobility and route options considered in terms of fuel consumption, externalities and PC.
4.1 Energetic characterization
The results obtained for the energy characterization can be seen in the figure 2. The results are represented by passenger.
The mode of transport that entails less fuel consumption is the bus at full capacity (Bus
full), followed by the bus at half capacity (Bus half). The third mode of transport is shared mobility by diesel (gPassenger_4). As expected, the mode of transport with the highest fuel consumption is individual transport for both diesel and gasoline.
Intercity bus ticket [18] 6€
Average diesel price [25] 1,439€/L
Average gasoline price [25] 1,545€/L
Toll price for the motorway option [26] 2.6€
Shared trip average price [22] 5€
When comparing both routes, the motorway (route 1) leads to higher fuel use when com-paring to the national road (route 2). In all modes of transport, gasoline vehicles represent more fuel consumption than diesel vehicles.
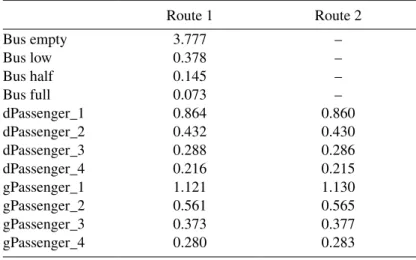
4.2 Environmental (external costs) characterization
The table 5 displays the results regarding the EC for each mode and route.
The mode of transport with better results is the bus at full occupancy (Bus full), followed by the bus at half occupancy (Bus half). The third best performance is achieved by the shared mobility with 4 occupants (dPassenger_4 and gPassenger_4). When comparing both routes, route 2 (national road) entails less 0.6% of EC when a gasoline vehicle is used, while the route 1 (motorway) has better results when a diesel vehicle is used (EC 0.8% inferior). Com-paring the diesel and gasoline vehicles, the former has on average 22% less of EC than the latter.
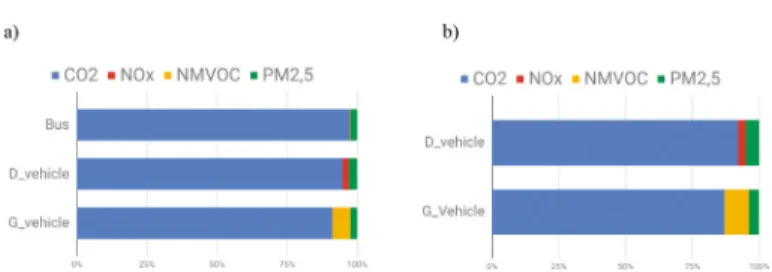
Regarding emissions, each pollutant represents different weights on the total emissions, as it can be observed in the figure 3. These results are for representative vehicles (Intercity Bus – “Bus”; Diesel Vehicle – “D_vehicle”; Gasoline Vehicle – “G_vehicle”).
0 1 2 3 4 L/(pass.route) Route 1 Route 2
Figure 2: Fuel consumption by passenger for the different mobility solutions addressed.
Route 1 Route 2 Bus empty 3.777 – Bus low 0.378 – Bus half 0.145 – Bus full 0.073 – dPassenger_1 0.864 0.860 dPassenger_2 0.432 0.430 dPassenger_3 0.288 0.286 dPassenger_4 0.216 0.215 gPassenger_1 1.121 1.130 gPassenger_2 0.561 0.565 gPassenger_3 0.373 0.377 gPassenger_4 0.280 0.283
From this figure, it is possible to see that for both routes and all different vehicles the CO2 is the main contributor for the EC. Some differences can be highlighted between each type of vehicles. In particular, for the bus, CO2 represents almost 97% of the total EC, being the remaining share divided by 2% for PM2.5 and 1% for both NOx and NMVOC. Regarding the NOx emissions, this pollutant represents some weight for the diesel vehicle (2%) when compared to the gasoline vehicle, for which values are close to 0%. NMVOC is a pollutant relevant in the gasoline vehicle with a share of 8% of the total costs, being practically 0% in the diesel vehicle. The emissions of PM2.5 are relevant in both vehicles, representing 4% and 3% for diesel and gasoline, respectively, vehicles. These results also permit to conclude that PM2.5 has more weight in the route 2 (that has lower average speed), with an increase of 2% in the share of the total EC when compared to route 1. In intercity trips, the CO2 usually represents a bigger weight than when urban trips are represented, because in urban environ-ment there are more people potentially exposed. As the population density average is below 1,500 hab/km2, the population density factor makes the EC decrease for the local pollutants
thus increasing the weight of CO2 and decrease the overall value of EC: Comparing the EC with and without the population density factor, it decreases. For route 1: 5% for the bus, 9% for the diesel vehicle and 14% for the gasoline vehicle, and for route 2: 9% for the diesel vehicle and 13% for the gasoline vehicle.
4.3 Economic (private costs) characterization
The results in terms of PC obtained for the case study can be seen in Table 6. The PC includes the UC, which are the ticket for shared mobility and intercity bus, and fuel and toll (if applied) costs for the individual transport. The travel time costs are also included, which is important to know the perceived costs by the travellers and can be considered as an indicator that can be further used as a strategic indicator for road pricing with an objective of EC reduction [24] of a transport system such as an intercity corridor.
Figure 3: Weight of each pollutant for different vehicles: (a) route 1 and (b) route 2.
Route 1 Route 2
Intercity bus 10.61 –
Shared 9.38 12.15
Passenger vehicle (diesel) 10.62 10.78
Passenger vehicle (gasoline) 11.85 11.98
Figure 4: Disaggregation of the PC by ticket, fuel, toll and travel time cost (tt_cost) for each transport mode, and (a) route 1 and (b) route 2.
Results show the shared mobility through route 1 (motorway) is the cheapest option, fol-lowed by the intercity bus. When comparing both routes, route 1 has less PC than route 2 (national road).
In the figure 4, disaggregation of the PC by ticket, toll, fuel and travel time costs is pre-sented.
For all vehicles, and in both routes, the travel time cost has major importance. This value should not be seen as a fixed constant, but involving some elasticity depending on the purpose and the travel time of the trip that may vary with different traffic conditions.
5 CONCLUSIONS
The main objective of this paper is to evaluate the impacts in terms of externalities of differ-ent road transport modes on an intercity corridor, and to perform an energetic and economic characterization of the corridor, taking into account the fuel consumption and the costs sup-ported by the users.
Results show the bus with full or half occupancy as the transport mode with less energy consumption and externalities costs (EC), followed by the shared mobility with 4 occupants. For the PC, the option with less PC is the shared mobility through route 1 (motorway), fol-lowed by the intercity bus. When comparing both routes, route 1 has less PC than route 2 (national road). In particular, regarding the travel time costs that belong to a category of per-ceived costs, an average of 65% of the total PC in route 2 is due to travel time costs, against 45% in route 1.
Information regarding EC and PC may be very important because it can represent the per-ceived costs of the travellers. This allows a more efficient optimization of the routing options for better road pricing and awareness. Coupled with analyses of the trade-off between PC and EC, it allows developing new and better road pricing schemes based on minimizing EC. Results also show one transport mode/route may be more attractive in terms of PC but may be worse regarding EC. A set of possible solutions to influence people to adopt modes of trans-port with less EC is to provide guidance to make the choices on routes with less EC, but also with less PC, and by the introduction of for instance, dynamic toll prices, smart and dynamic ticketing for the intercity bus, incentive the high occupancy of the buses with more attractive prices, or fostering the use of shared mobility.
Future research will be conducted on the following topics:
•
Evaluate different options/scenarios, using different models and software, mainly focused on studying the elasticity involved in EC and PC;•
Regarding the EC, other externalities such as noise and traffic accidents can be in-cluded;•
Extend the study to include railroad transport.ACKNOWLEDGEMENTS
The authors acknowledge the support of Strategic Project TEMA UID-EMS-0048-2013-FCT and CENTRO-01-0145-FEDER-022083, and projects: CISMOB (PGI01611), inFLOWence (POCI-01-0145-FEDER-029679), DICA-VE (POCI-01-0145-FEDER-029463), MobiWise (P2020 SAICTPAC/0011/2015) and “IDAD – Guyana energy inventory for the transporta-tion sector”. C. Sampaio also acknowledges the FCT support for the Scholarship SFRH/ BD/138746/2018.
REFERENCES
[1] Publications Office of the European Union (POEU). EU energy in figures : statistical pocketbook 2018. [Website], available at https://publications.europa.eu/en/publication- detail/-/publication/99fc30eb-c06d-11e8-9893-01aa75ed71a1/language-en/format-PDF, 2018 (accessed 5 January 2019)
[2] Agência Portuguesa do Ambiente (APA). Relatório do Estado do Ambiente Portugal 2017, available at https://sniambgeoviewer.apambiente.pt/GeoDocs/geoportaldocs/ REA/REA2017/RelatorioEstadoAmbiente2017.pdf, 2017.
[3] EMISIA. COPERT Countries data, available at http://emisia.com/products/copert-data, 2015.
[4] Fontes, T., Pereira, S.R., Bandeira, J.M., & Coelho, M.C., Assessment of the effectiveness of fuel and toll pricing policies in motorway emissions: an ex-post analysis. Research in
Transportation Economics, 51, 83–93, 2015. DOI: 10.1016/j.retrec.2015.07.010. [5] Bandeira, J., Coelho, M., Pimentel, M., & Khattak, A., Impact of intercity tolls in
por-tugal – an environmental perspective. Procedia – Social and Behavioral Sciences, 48, 1174–1183, 2012. DOI: 10.1016/j.sbspro.2012.06.1093.
[6] Bandeira, J.M., Fernandes, P., Fontes, T., Pereira, S.R., Khattak, A.J., & Coelho, M.C. Exploring multiple eco-routing guidance strategies in a commuting corridor.
International Journal of Sustainable Transportation, 12(1), 53–65, 2018. DOI:
10.1080/15568318.2017.1328545.
[7] Zeng, W., Miwa, T., & Morikawa, T., Prediction of vehicle CO2 emission and its appli-cation to eco-routing navigation. Transportation Research Part C: Emerging
Technolo-gies, 68, 194–214, 2016. DOI: 10.1016/j.trc.2016.04.007.
[8] Zeng, W., Miwa, T., & Morikawa, T., Application of the support vector machine and heuristic k-shortest path algorithm to determine the most eco-friendly path with a travel time constraint. Transportation Research Part D: Transport and Environment, 57, 458– 473, 2017. DOI: 10.1016/j.trd.2017.10.001.
[9] Bandeira, J.M., Carvalho, D.O., Khattak, A.J., Rouphail, N.M., Fontes, T., Fernandes, P., … Coelho, M.C., Empirical assessment of route choice impact on emissions over dif-ferent road types, traffic demands, and driving scenarios. International Journal of
[10] Bandeira, J., Almeida, T.G., Khattak, A.J., Rouphail, N.M., & Coelho, M.C., Generat-ing emissions information for route selection: experimental monitorGenerat-ing and routes char-acterization. Journal of Intelligent Transportation Systems, 17(1), 3–17, 2013. DOI:
10.1080/15472450.2012.706197.
[11] Nie, Y. (Marco) & Li, Q., An eco-routing model considering microscopic vehicle oper-ating conditions. Transportation Research Part B: Methodological, 55, 154–170, 2013. DOI: 10.1016/j.trb.2013.06.004.
[12] Abdulsalam Bin Miskeen, M.A., Rahmat, R.A.A.B.O.K., & Alhodairi, A.M., Model-ling intercity route choice behaviour to explore road users’ response to road pricing pol-icy in Libya. Australian Journal of Basic and Applied Sciences, 6(9), 431–439, 2012. [13] Soriguera, F., On the value of highway travel time information systems.
Transpor-tation Research Part A: Policy and Practice, 70, 294–310, 2014. DOI: 10.1016/j.
tra.2014.10.005.
[14] Liu, H., Xu, Y. “Ann”, Stockwell, N., Rodgers, M.O., & Guensler, R., A comparative life-cycle energy and emissions analysis for intercity passenger transportation in the U.S. by aviation, intercity bus, and automobile. Transportation Research Part D:
Trans-port and Environment, 48, 267–283, 2016. DOI: 10.1016/j.trd.2016.08.027.
[15] Woldeamanuel, M., Evaluating the competitiveness of intercity buses in terms of sustainability indicators. Journal of Public Transportation, 15(3), 77–96, 2012. DOI:
10.5038/2375-0901.15.3.5.
[16] WAY2GO, Plano Municipal de Mobilidade de Aveiro, available at http://files.cm-avei-ro.pt/XPQ5FaAXX42842aGdb9zMjjeZKU.pdf, 2012.
[17] Google, Google Maps, available at https://www.google.com/maps, 2019.
[18] Rede expressos, Rede expressos, available at https://www.rede-expressos.pt/, 2019 (accessed 28 February 2019).
[19] Sampaio, C., Bandeira, J.M., Macedo, E., Vilaça, M., Guarnaccia, C., Friedrich, B., … Coelho, M.C., A Dynamic Link-based Eco-indicator for supporting equitable traf-fic management strategies. Transportation Research Procedia, 37, 43–50, 2019. DOI:
10.1016/j.trpro.2018.12.164.
[20] EMISIA, COPERT4 [Computer Software], available at https://www.eea.europa.eu/ data-and-maps/data/external/copert-4, 2016.
[21] Korzhenevych, A., Bröcker, J., Holtkamp, H.M., Gibson, G., Varma, A., & Cox, V., Update of the Handbook on External Costs of Transport, available at https://ec.europa. eu/transport/sites/transport/files/handbook_on_external_costs_of_transport_2014_0. pdf, 2014.
[22] BlaBlaCar, Viagens Aveiro -> Coimbra, available at https://www.blablacar.pt, 2019 (accessed 28 February 2019).
[23] Kouwenhoven, M., & de Jong, G., Value of travel time as a function of comfort. Journal
of Choice Modelling, 28, 97–107, 2018. DOI: 10.1016/j.jocm.2018.04.002.
[24] Wardman, M., Chintakayala, P., de Jong, G., & Ferrer, D., European wide meta-analysis of values of travel time, available at http://www.significance.nl/papers/2012-Europe-an%20wide%20meta-analysis%20of%20values%20of%20travel%20time.pdf, 2012. [25] Maisgasolina, Preços médios dos combustíveis, available at https://www.maisgasolina.
com/, 2019 (accessed 28 February 2019).
[26] ViaMichelin, Itinerários Aveiro -> Coimbra, available at https://www.viamichelin.pt, 2019.