Using Map-Augmented Reality for
Forced Migrants
Apurva Anil Kochar
2017
Thesis submitted to fulfil partially the requirement of the Master of Science in Geospatial Technologies (Erasmus Mundus).
Supervisor: Dr. Auriol Degbelo
Institute for Geoinformatics (ifgi), University of M¨unster, Germany
Co-Supervisors: Dr. Michael Gould
LSI, Universidad Jaume I (UJI), Castellon de la Plana, Spain
Ana Maria Bustamante Duarte
Contents
1 Introduction 6 1.1 Motivation . . . 6 1.2 Background . . . 6 1.3 Research Aspects . . . 9 1.3.1 Research Question . . . 9 1.3.2 Method . . . 9 2 Related Work 11 2.1 Landmark and Route Knowledge . . . 112.2 Pedestrian Navigation . . . 11
2.3 Forced Migrants . . . 12
2.4 Decision Points . . . 12
2.5 Augmented Reality . . . 13
3 Implementation 16 3.1 Map and Navigation . . . 16
3.2 Augmented Reality . . . 16
3.3 JavaScript Object Notation (JSON) . . . 17
3.4 Geofencing . . . 18 3.5 User Interface . . . 18 3.6 Architecture . . . 21 4 User Study 23 4.1 Experiment Design . . . 23 4.2 Procedure . . . 26 4.3 Pilot Study . . . 27 5 Results 28 5.1 Effectiveness . . . 28 5.2 Efficiency . . . 28 5.3 Satisfaction . . . 28 5.4 Landmark Knowledge . . . 29 5.5 Route Knowledge . . . 29
6 Discussion and Future Work 30
Certificate of Originality
This is to certify that I am responsible for the work submitted in this thesis, that the original work is my own except as specified in acknowledgments or in footnotes, all the used references and sources are mentioned and that neither the thesis nor the original work contained therein has been submitted to this or any other institution for a degree.
Apurva Anil Kochar
—————————————(Signed)
25.02.2017
Acknowledgements
I would like to express my sincere gratitude to my (co-) supervisors Dr. Auriol Degbelo, Dr. Michael Gould and Ana Bustamante for their time to time feedback. They discussed concepts and ideas with me throughout the entire course of this thesis.
To my parents for their unconditional love and support.
To Kunal and Jana for kepping me motivated.
To Sitcom Lab for providing the Android phones.
To Dr. Marco Painho for providing me the opportunity to pursue this Master.
To Anita for helping me with the recruitments and correcting my mistakes from time to time as a friend and as a co-supervisor.
To Shahzeib, who was unfailingly there for me in every step of this Master Thesis.
At last to GEO-C, as this thesis is inspired by the work of Ana Bustamante in her ongoing research titled “Adapting Open Geospatial Data Visualization to Support Forced Migrants‘ Familiarization with the New City”
Abstract
Pedestrian Navigation can help greatly in spatial knowledge acquisition. Forced migrants (i.e. refugees and asylum seekers) have the need of familiarizing at a fast pace with their new resettlements. This masters thesis studied the effect of an alternative way of conveying route directions to the Forced Migrants. It was done by adding Location-Based Augmented Reality at decision points on a 2D Map route guidance system. It aimed to compare this interface with traditional 2D Maps for landmark and route knowledge acquisition & ease in navigation. A user study with ten forced immigrants was conducted in the city of M´unster, Germany to understand the navigation experience with the two interfaces. The results showed better landmark and spatial knowledge attainment using the interface with Augmented Reality. Also, participants found their way around more easily with this interface.
Keywords: Forced Migrants, Pedestrian Navigation, Location-Based Augmented Reality
1
Introduction
1.1
Motivation
According to a report by UNHCR (see [9]), there are over 11 million forced migrants worldwide and over 0.13 million have crossed the sea to migrate to Europe between January and March 2016. Germany had received over 476,000 applications for asylum request in the year 2015 [5]. According to 2014 UN report, 2.5 billion additional people will move to the cities in the upcoming years [46]. However, past studies have shown that they encounter several difficulties while accessing different services in the new cities they are arriving at, due to factors like low proficiency in the local language, as well as occasional low levels of literacy, cultural and social differences and often are equipped with limited technology [53, 19]. They tend to mostly rely on the locals for navigation and information about basic needs like supermarket, job center, among others [19]. Cultural differences and the low proficiency in the language make these tasks hard for them and may slow down the process of a smooth settlement in a new city. All of the above mentioned elements can in a way affect their navigation and wayfinding in unfamiliar urban territories. There is a need to address their problems utilizing the basic technology they have like smartphones [58].
Digital guides designed for the forced immigrants, addressing their requirements and objectives can ease their navigation around the city and make them more familiar with it. The thesis studied Landmark-Based Augmented Reality at decision points (see section 2.4) as an alternative way of conveying navigational information in the case of forced migrants. It aimed to address their specific needs while supporting their exploration of the new city. It combined AR at decision points with conventional 2D maps to help the forced migrants become more familiar to the new city and ease navigation by generating pop-up dialogs that in turn is expected to prevent them from taking wrong routes.
1.2
Background
Navigation, the ability to travel from one place to another is very crucial for an independent life and the initial familiarization of a new place [40]. It is a key factor in adjusting oneself in the new society, in the reduction of social exclusion and providing improved interaction among people of all kinds [40]. It is important that the forced migrants feel socially included and get hold of various opportunities available to them in a new city [19]. Navigation is important for getting access to various employment opportunities and Public Transportation plays a crucial part of it [40]. However, any sort of public transportation requires a walk of at least a few meters. This is more popularly known as Pedestrian Navigation (see Section 2.2). It is seen that the forced migrants often rely on verbal instructions from others to navigate around the city [19]. Sometimes, community based instructions are less reliable and lack specification for a particular community [40].
The new comers to a city like tourists, visitors and abroad students are often unfamiliar with the whereabouts of the city. The tourists continuously refer to a map and align themselves according to a Point of Interest (POI) [51]. The tourism guides of various kinds (see [51] ) with map support improve their location knowledge while encouraging their exploration of the new place. This information is often customized for the tourists to address their need of sight-seeing of popular landmarks[51]. In this case, maps are mostly created with highlighted landmarks relevant to the tourists [51].
Forced migrants have a similar need of familiarization. However, the kind landmarks, facilities, infrastructures, among others that hold importance can be very different for the forced migrants. They tend to live for longer in the city as compared to the tourists. Hence, a supermarket selling relevant food would be more important than a historic landmark. O’Reilly(2003) argues that a migrant can not be referred as a tourist. Generally, tourists are the people that 1) stay temporarily at new places for leisure activities [47];2) can adapt easily to new environments[47]; 3) have diverse and flexible ways of finding information [51]; 4) are familiar with a diverse set of navigation tools [51] and 5) find their way to communicate with people at the new place (e.g. using local language or English, gestures) , [47]. In contrast, forced migrants are a group of population forced to move from their original cities due to a diverse set of reasons. O’Reilly(2003) further suggests that the migrants do not want to get involved in leisure conversations. They try to adjust themselves to the routine of the city [47]. International Association for the Study of Forced Migration (IASFM) define forced migrant as a general term that refers to the movements of refugees and internally displaced people (those displaced by conflicts) as well as people displaced by natural or environmental disasters, chemical or nuclear disasters, famine, or development projects [10]. Hence, they are not necessarily prepared to confront certain conditions that are present or required in their new environments (e.g. need of have certain knowledge of local language or sometimes English, new ways of moving around, structure of the cities, urban dynamics, among others).
Based on this, an aid that can facilitate forced migrants quick familiarization of the city while providing them with an easy pedestrian navigation is required. One aspect of familiarization is Spatial Knowledge Acquisition [54]. During the early stages of familiarization, people start learning vivid locations [54]. These locations are mentally then connected to form routes and the association of various locations with several routes create a mental map in a persons head [54]. The Landmark Route Survey (LRS) model [52] accurately depicts it and comprises of the following parts:
Landmark Knowledge: This involves the recognition of important locations. Route Knowledge: Linking of the important locations (distance and direction) to form routes.
map comprising of important landmarks and routes connecting them.
The above are the three stages of cognitive development of an individual [52]. The author however aimed to evaluate only the first two kind of knowledge with the interface as Survey Knowledge need a considerable passage of time for evaluation.
Traditional cartographic 2D paper maps have been transforming into different types of representations and more technological tools, aiming to answer more effectively and specifically to the diverse needs of users. It has evolved from 2D maps using GPS, to photographic aids like Nokia City Scene [45], Google Street View [17] and AR based Navigation systems like Wikitude [11]. Google Street Views are not available everywhere due to political and privacy concerns [17]. They are unavailable in Germany [17]. 3D maps are in a state of development and as per the extent of authors knowledge, no strong conclusion has been reached over the preference of 3D maps over 2D [48].
A lot of Pedestrian Navigation system are task intensive and engage the users during almost the entire time [33]. Hence, the users become less aware of the surroundings and is unable to gain much spatial knowledge out of it. Augmented Reality (AR) is a whole new dimension. It augments virtual objects on a egocentric view [16]. The user sees the real surroundings with the camera with augmented directions [16]. Schmalstieg and Reitmayr [50], outlined the special features of Augmented Reality and how these features have high potential in cartography. Hence, making it a useful tool in navigation [16]. There is a virtual world created by the camera of the mobile application. Markers, models or different similar objects are augmented on this world created by the mobile camera using different algorithm of image matching or using the sensors and GPS of the mobile system. Each of this requires a creation of database that may have images of the area or a database of the objects to be augmented that would be visualized using the camera [12]. One of the special features of AR over traditional 2D maps is that it has 6 degrees of freedom namely up-down, roll, pitch, left-right, back-forward and yaw [50, 12]. Various studies have been done to apply and study the performance of AR in indoor navigation [23] as well as outdoor navigation [16, 33].
This master thesis used guiding instructions (e.g. directional arrows, landmark highlighting, and speech bubbles) as an embedded layer on the Augmented Reality view at decision points. The decision points are the pre-chosen locations (e.g. turning points, landmarks, roundabouts) that would prompt the users to use their camera using different notifications strategies (e.g. pop up notifications). These are the places where the user decides which direction to head and sort of make sure if it is the correct path. The application would retrieve the embedded guidance layer from the local DB. This guidance layer is augmented on the view generated by the camera. The thesis developed two kinds of interfaces, one being a simple 2D map aided navigation and the other a combination of 2D maps and AR.
Mulloni et al. [44] did the usability study and concluded that AR mode was preferred while standing than while moving. Based on this, the study used AR only at the decision points suggesting the further routes and also making sure if the user is on the correct path. A similar work to compare 2D maps with AR was done by [33], in which instead of displaying the route guidance, transit stops were displayed using AR. This was termed as MAR (Mobile Augmented Reality). However, this study was conducted using local transportation and was chosen over pedestrian navigation as the authors found it task-intensive. The research [33] had three criteria for the comparison namely the ease of use, fun to use and preference for future. The questionnaire given to the participants in this Master Thesis included this three criteria. The most interesting part of the research [33] is the last question asked to the participants which was whether they would prefer a combination of the map and MAR version and 72% of the participants voted in favour. This Master Thesis developed a combination of the two, focusing on the comparison of 2D map interface with a duo of 2D maps and AR.
This research also noted the time difference while using both kind of interfaces to know the efficiency of each system. The interface involving AR took longer time. This may be because of the unfamiliarity with this type of technology among the forced migrants. The study calculated both the performance of the interfaces as well as the preference stated by the migrants. Wen et al., 2013 [56] suggested that the performance of an application should not be confused with the preference stated by the user. The preference suffers from loss aversion since it is difficult to change habits [56]. The users prefer to use an interface which they have used in the past and have got pretty acquainted to it [56]. It may be also useful to know, in a needful scenario what user would do then what they say they would prefer. Hence, performance and preference were obtained separately in this study.
1.3
Research Aspects
1.3.1 Research Question
Does the use of Augmented Reality at Decision Points on a 2D map ease navigation and improve landmark and route knowledge of forced migrants?
1.3.2 Method
• Developed an Android based application (min API 23) using Skobbeler SDK and OpenGL ES 2.0.
• Experiment with ten participants from the forced migrant group.
• Participants navigated in a defined route either using the map View or the map + AR View which was randomly assigned.
• An online questionnaire available on mobile for the feedback of the application was given.
• An online questionnaire available on mobile to evaluate landmark knowledge was given.
• Route knowledge was evaluated based on their ability to retrace back the path without any aid.
2
Related Work
2.1
Landmark and Route Knowledge
People acquire spatial knowledge through exploration around an area [42]. The knowledge acquisition begins as soon as the person arrive in a spatial region and continues to grow overtime [42]. This in turn becomes a criterion in designing various wayfinding tools. The first step of familiarization is gaining of landmark knowledge [52]. Remembering distinct entities and objects present in a space is landmark knowledge [42].
Pedestrian Navigation is affected eminently by landmarks [41]. A typical 2D map uses symbols of different shape and size to highlight these landmarks. But these landmarks or Point of Interests(POIs) are often random and not appropriate [41] for specific user groups. These reference points help the user to imagine the topology of the near space and facilitate navigation by providing choice points [41] at decision points (see section 2.3). Additionally they provide confidence to the users and reduce manoeuvering errors [49].
Montello [42] defines route knowledge as travel paths connecting landmarks. It is a combination of landmarks and actions [30]. When distinct landmarks are not available people often look up to building lines for remembering routes [30]. There are often sex differences in acquiring spatial knowledge [26]. Females tend to remember more landmarks than males whereas males remember more routes than females [26].
2.2
Pedestrian Navigation
Baker [18] describes how navigation is route based and location based. The route based means the conscience of the direction and distance to the location whereas location based is checking if right landmarks are crossed while navigating [18]. Hill [31] has described the significance of non verbal navigational directions like various hand movements and personalisation of information. Mobile based navigation tool can obviously be not personalised for each individuall but focus can be made on a particular user group like in this case Forced Migrants. Pedestrian Navigation has developed over the years with continuous improvement in technologies like GPS, internet, among others [55]. A verbal instruction can also help in pedestrian navigation. However, visual tools are more important in wayfinding and self-orientation [36]. A typical pedestrian navigation system (PNS) consists of visual information about the place, route directions and other relevant information like whether it is a school, a restaurant, among others [36]. Generally, map based interfaces are the first choice for pedestrian navigation [55]. Some systems use geotagged and iconographic photos [20] whereas some used infrared beacons for indoor navigation [29]. Kolbe [36] used augmented videos and panoramic scenes for PNS. PNS should be designed in a way that it requires minimum effort from a person to self-associate in the
virtual environment [36]. Walther and Malaka [55] concluded that AR is better alternative for route presentation than map interfaces. It provides an egocentric view of the virtual reality [55].
2.3
Forced Migrants
Forced Migrants are people who have moved to a different country or continent in search for a better life [10]. They can be refugees or asylum seekers [10]. Forced migration generally happens due to political or social distress or as a result of a natural disaster [10]. They go through real disruptive life changes during the process of migration [22]. Some of them have little access to health, education and technology [19]. These people often face challenges in interacting with the locals due to social and cultural differences [28]. They often have low literacy levels and are less proficient in English and other local languages [28]. This calls for addressing their needs in specific manner keeping in account their limited lingual and technical abilities.
Initially they are provided with resettlement facilities [22]. However, at later stages they go through complete rehabilitation process and often lack proper guidance in carrying out their lives ahead [22]. In US, there is very little technical assistance available to ease the transition of the forced migrants [19]. However, in Europe things are in better shape [53]. Human Computer Interaction (HCI) has emerged as a very popular research area in the case of forced migrants [53]. Technical innovation is required to address resettlement needs of the forced migrants [53]. Some technical work has been done in providing translation facilities [22] and guidance around the city [19]. Social works like increasing cultural understandings, reducing gender barriers and keeping account of the challenges faced by the forced migrants have been done [28].
2.4
Decision Points
May[39] defines Decision Points as nodes where a pedestrian would expect further guidance for navigation. These nodes are extremely important as a wrong turn here may lead to a significant loss of time. Decision points often use landmarks to direct the user where to go next and also the landmarks can be used in confirmation points, which assures the user of a correct path. Often people prefer to travel in a route which is although longer in length but contains less number of decision points [41]. This is also referred as least decision load strategy [57]. Some researches show an improvement in pedestrian navigational accuracy when landmarks are included in these confirmation points [41]. But most of the navigational methods tend to use these landmarks only at these decision points [41].
The decision points can be marked to the places where people often pause while navigating to orient themselves for the next direction or ask others for help [41]. Some points or nodes might have turns but may or may not be a potential
decision point. At some points users do not require any further guidance and just move past them. These points will not be a decision point. [37] defines decision points as the places where there is a change in the walking directions. Sometimes, crossroads with a unique appearance are often stamped as decision points [41].
2.5
Augmented Reality
AR is an amalgamation of physical and digital world [40]. The main difference between using a traditional 2D map and AR is that the step of placing oneself in the real environment is eliminated. AR started off as heads up displays in the assembly line production in 1960s. Later it was used with computer back-packs in early 2000s. Now it has taken up a significant role in open application development [40]. AR on mobile uses several different algorithms and methods to generate augmentations on the camera view of the mobile screen. The algorithms used for AR are complex and requires high computational ability from smartphones [32].
In the context of mobile application development, there are three approaches towards Augmented Reality [34]. The first one is Marker-Based which involves image matching. The image matching is often known as Object Recognition. For this, generally an artificial or a natural marker is used to compute the pose of a camera. Markers are a set of images which would possibly be viewed by the camera. These are stored in a database prior to the pose computation. Later, when the user points her camera, the image viewed is matched with the closest image in the database. Pose is computed from the difference in orientation and placement of the recognised image from the database. The position of the augmentations onto the camera view are determined based on the computed pose [12].
However, Object Recognition works well when the object has features as required by different image matching algorithms [12]. These features may not be found in several objects or would require very complex algorithms for image matching. For doing real time navigation, it is difficult to obtain such objects at every decision point (see section 2.4). Also, not all cameras are equipped to capture these objects due to image quality and resolution. For matching of the captured image in real time navigation, high computational efficiency and storage is required for pre-collected image storage database. Therefore, often augmented reality used for navigation is markerless [25].
The Markerless AR is another approach for overlaying virtual data on real time camera view. It uses sensors like accelerometer and magnetometer and location determined by using GPS, Mobile Internet, Wi-Fi or network, to compute the pose of the Camera. This is often termed as Location-Based Augmented Reality. The location of the device and the sensors determine the what and where of the augmentations respectively. The obtained location matches the location that is
already stored in the database. If a location is matched, then the associated augmentations are retrieved. The sensors then determine the position of the augmentations. This is explained in details in Section 3.
Another approach to it is the use of pre-augmented images. The images collected are augmented with virtual objects and georeferenced. In case of a 3D image, absolute rotation and the intrinsic parameters are stored along with the pose of the camera [12]. Either of the above two approaches can be used for calculating the pose of the camera during runtime. In some cases, a combination is used. The pose is calculated using markers as well as sensors and GPS. Then the captured image is overlaid by a pre-stored augmented image. Alappanavar stored these images in a local database to facilitate offline use. However, large memory usage and high computational need makes us hesitant to use this approach.
Augmented Reality Engine Application (AREA) KERNEL was designed by [27] in 2014. It is based on the concept of Point of Interests (POIs) and LocationView. It was implemented on Android, iOS and Window Phones. The Location View contains all the augmentations in one view(frame) [27]. So, when needed, instead of rotating every augmentation the entire frame is rotated. This ensures the efficient display of augmentation even when the device is obliquely held [27]. If one frame is already been used, the augmentations inside the frame can be used again [27], sort of like a cached memory. Hence, the screen doesnt have to draw again and again.
In the study [27] the author pointed out different capabilities of Android and iOS, that can be used for AR development. The authors also pointed certain shortcomings in both the Operating Systems (OS). With the combination of accelerometer and compass, the direction of view is known. With the direction of view obtained and the angle of view of the camera the fence of the augmentations is determined [27]. In iOS CoreLocation provides the information of the current location and heading. In Android, the heading is calculated by a series of steps. First the sensor data is used to calculate a rotation matrix and then using this matrix the direction at which the device is pointing is calculated [27].The accelerometer values in iOS is provided by CoreMotion framework. However, it doesnt push the data automatically to the main thread [27]. Therefore, it has to be called after every fixed interval of time.In Android, the child view containing the augmentations cannot be simply rotated. One has to rotate the individual augmentation along with the child view [27]. The movement of the augmentation inside a location view was not smooth in case of Android and hence the concept of layout was utilized eliminating the child view [27]. Nexus 4 worked quite well like in case of iOS when the layout was rotated [27]. However, in the case of Nexus 5, the camera surface view often clipped the locationView [27]. There were certain limitations in case of Android but as it is more commonly used than iOS worldwide, Android development was chosen over iOS.
In a study conducted by McMahon et al [40] on intellectually disabled students, it was found that Augmented Reality was the most successful option among various navigational tools. Number of spatial decisions made by the students correctly determine the accuracy of a navigational aid [40]. The results showed 87% of decision independency using the AR [40]. Recently, a location based augmented reality pedestrian navigation was designed by Amirian and Basiri [14]. The results showed a significant improvement in spatial knowledge acquisition using AR as compared to tradition 2D map navigation [14]. Lot has to be still done on the engineering side of AR for mobile applications [27]. Sensors such as accelerometer, magnetometer & motion sensor and GPS & internet are carried out and a lot of augmentations need to be drawn causing a high frame rate per second[27]. One has to keep in mind the battery storage, limited screen size and occasional freezing of the smartphones [27].
3
Implementation
The link to the github repository of the android application is https://github. com/apurvaakochar/ApurvaMasterThesis. The next lines would brief about the major components of the application.
3.1
Map and Navigation
Software Development Kit(SDK) by Skobbler Maps was used to generate 2D maps and real-time Navigation. The SDK is based on OpenStreetMaps (OSM). OSM has been the most successful project in the field of geospatial data generation with cooperation among different sectors and users [32]. The most important feature of OSM is the provision of geospatial information at feature level [32]. The access to various commercial mapping services like Google Maps [6], HERE [7] among others were available. However, they all came along in the form of Application Programming Interfaces(APIs). The free use of these APIs is often restricted. In the case of Google Maps [6], real time navigation was not allowed and it was paid in the case of HERE Maps [7]. Skobbeler SDK is built on OSM and provides Real Time Navigation functionality. Following is the link to the documentation of Skobbler map: https://developer.skobbler.de/docs/android/3.0.1/index.html.
3.2
Augmented Reality
Camera2 API of Android was used to connect and open the camera services of the android devices. The link to the documentation of Camera2 API is given below.
https://developer.android.com/reference/android/hardware/camera2/package-summary.html. The Camera API was deprecated in Android API level 21 [3]. In this study, a
texture view was used instead of the camera surface view since it is known to better hold the capabilities of camera2 API [1]. The android.location [2] package provides an approximate location based on network triangulation as opposed to the iOS [27]. This can come out handy when GPS signals are shaky.
OpenGL ES 2.0 was used for augmenting the guidance layer on the camera. The following link directs to the Android documentation of OpenGL:
https://developer.android.com/guide/topics/graphics/opengl.html.
Android does not directly calculate the direction where the camera is pointed [27]. A rotation matrix needs to be calculated which is later used to determine the direction. A built in function in Android called getRotationMatrix() is used for this [8]. It takes input from the two sensors namely accelerometer and magnetometer. When the augmentations are drawn, some jumping can be noticed. The oscillations are caused due to variation in the two input variables (accelerometer and magnetometer) in the calculation of the rotation matrix causing discrepancies. The oscillations are reduced to some extent by the low pass filter.
The article by Conder and Darcey [24] provides the basic algorithm of Location Based Augmented Reality. However, it does not deal with the issue of oscillations. It used onDraw() method of Android which is not suitable for drawing 3D images. Hence OpenGL ES 2.0 was adopted. For a better understanding of the mathematical calculations in the background, basic formulae are stated. Horizontal Angle of View(HAV) and Vertical Angle of View(VAV) of the camera determines the range of the sight that would be captured. The location of the objects that need to be augmented on the screen should lie within this range. The horizontal coordinate of the augmentations is determined by three variables namely HAV, bearing angle and azimuth of the device. The shift in the x component of the augmentation (dx) can be calculated as follow:
dx = w × (b − a)
HAV (1)
where:
dx = shift in the horizontal component of the augmentation (pixels) w = width of the screen (pixels)
a = azimuth angle(degrees) b = bearing angle
HAV = horizontal angle of view of the camera (degrees)
Whereas the bearing is the bearing between the current location and the location of the augmentation. The Azimuth of the device is calculated using the Rotation Matrix [8] of the device and with respect to the direction towards which the camera is pointing. The Orientation Vector [8] also returns the pitch and roll of the device as well which respectively determine the vertical and angular shift of the augmentation.
dy = h × (r)
V AV (2)
where:
dy = shift in the vertical component of the augmentation (pixels) h = height of the screen (pixels)
r = roll angle(degrees)
V AV = vertical angle of view of the camera (degrees)
The rotation of the augmentation is determined by the pitch angle which is the angle between a plane parallel to the screen and a plane parallel to the ground.
3.3
JavaScript Object Notation (JSON)
The coordinates of the decision points as well of the POIs and routes were stored in JSON Format. SQL databases are very effective for managing structured
data [13]. But NoSQL (Not only SQL) DBMs can deal with both structured and semi-structured data[15]. JavaScript Object Notation (JSON) is used by NoSQL developers nowadays where the connection between data is more important than the relationship [32]. The NoSQL DBMSs have been proved quite efficient in geosearches [32]. These database schemas like JSON reduces burden on the application layer by carrying out a lot of computations in the database itself [32]. JSON is very easy, simple and extendable database schema among developers [27]
3.4
Geofencing
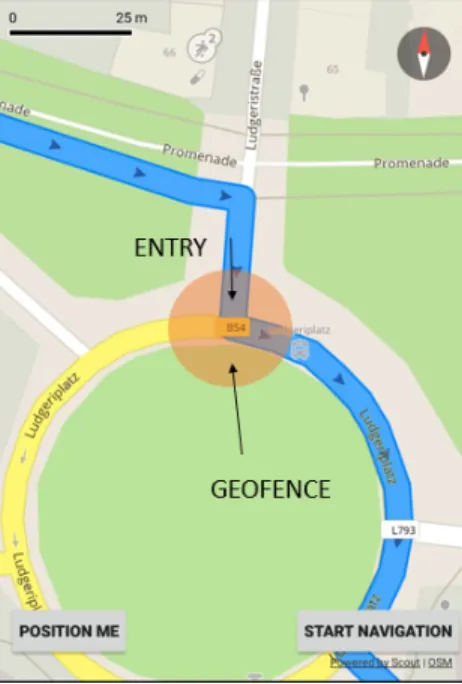
The Decision Points were not mere a location but were a buffer of radius five meters. Geofencing mechanism (see [4])was adopted to notify the user of a decision point. When a user enters a geofence, a pop up dialog box would prompt the user to open AR View. Figure 1 depicts a typical geofence at one of the decision points.
Figure 1: Typical Geofence at one of the decision points
3.5
User Interface
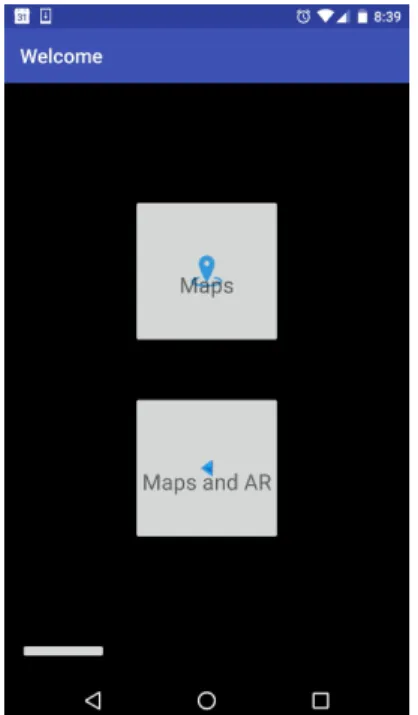
The launcher activity (Figure 2) of the application displays two options referring to the two types of interface:
• Maps and AR
Figure 2: The screen after the activity is launched
If the choice is Maps then another activity opens up displaying the current location of the user. There are two buttons at the bottom of the activity namely:
1. Position Me
2. Calculate Route
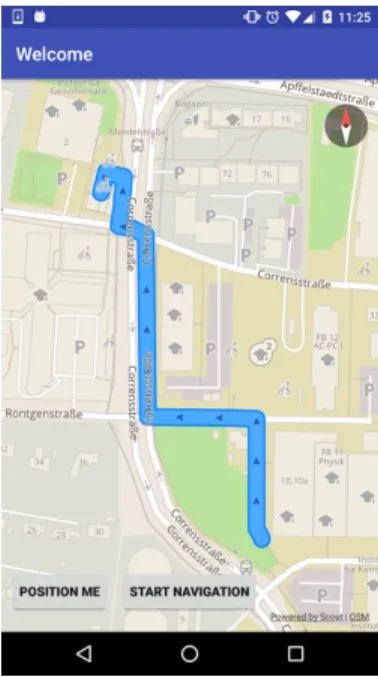
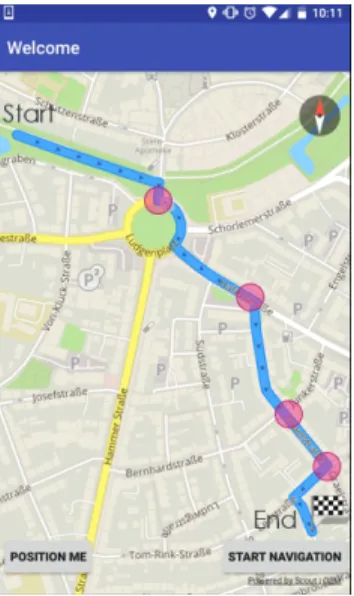
The option no. 1 works like a Current location button and on clicked centers the map to the user’s current position whilst displaying his/her position by circles. The orientation of the device is represented by an acute beam like in Google Maps. The option no. 2 calculates the route between two points. This is an offline feature of Skobbler Maps. When a route is calculated, it is displayed on the map (figure 3). Then the Calculate Route Button is changed to Start Navigation which starts the real time navigation. Then the user gets the option of stopping the navigation. Meanwhile, the navigator icon moves with the user’s position. The application toasts ”Destination Reached” when the user reaches the destination. In the scenario where the user is lost, the route is recalculated and navigation starts again.
Figure 3: Result after Route Calculation
If the user chooses the option Maps and AR then the above process is carried out except at Decision Points (DP). At a DP, a dialog box pops up asking the user if the user wants to switch to the AR View (figure 4).
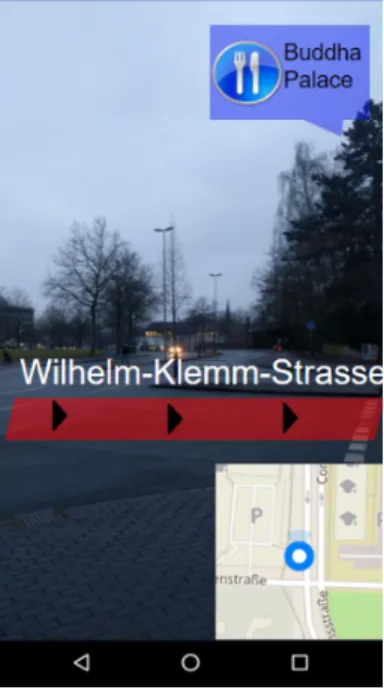
If the user clicks on No, the 2D Map navigation is resumed else the AR View opens up with a small window on the bottom right corner indicating the current position of the user on the map. The path that has to be followed next is augmented like shown in figure 5 Some important landmarks are also augmented on the screen. When the users click on the map, they are redirected to the Map View.
Figure 5: Augmented Reality View
The following table summarizes the functions of different features of the application:
OBJECT FUNCTION
Position Me Centers the map to the user’s current position Calculate Route Calculates the route between two points Start Navigation Starts Navigation
Stop Navigation Stops Navigation
Dialog Box Whether user wants to switch to AR View Small Map Window Current position and Orientation of the user
Augmentations Direction and important Landmarks
3.6
Architecture
4
User Study
4.1
Experiment Design
Experiments concrete a theoretical argument. It is true that however promising an argument sounds, the experiments may speak out completely differently. Here, a user study was done to address the research question (see section 1.3.1). This study lies somewhere in between a research and a usability study. Although, in this study the application is tested among the forced migrants. It does not fall completely under a usability testing. For the latter comes after a significant development of the product to test its interface [38]. However, in this case, an initial prototype was tested to know the effect of AR at decision points on the spatial skills of forced migrants. The problems associated with the spatial skills of the forced migrants in a new city was being understood at certain level. Also, a solution to the existing issues of language difference and unfamiliarity with the new urban dynamics was proposed and later tested. Hence, having the components of both usability study and a research [38].
Learning effect, participants previous knowledge and number of participants may bias the results [38]. There is one independent variable in this case: Type of View at decision point. The Map View (MView) is common in all other time of the navigation except at decision points (DP). The dependent variables are Easy of Navigation, Landmark Knowledge, Route Knowledge and Satisfaction. The Ease of Navigation can be broadly classified into Efficiency and Effectiveness. The Efficiency in this case was determined by the time taken by the user to finish the task. The successful completion of the task and number of errors involved would determine the effectiveness of the task. The Satisfaction in this case is broadly classified into four variables namely Ease of Use, Fun, Future Use and Confidence. Since there is only one type of Independent Variable, we need a basic design [38] and there will be in total two conditions in the experiment (with or without the AR View). It is very important to control the independent variable [35] and the behavior should be deterministic without any errors.
The participants were mostly recruited from Hans-Bockler-Berufskolleg, M¨unster. They were contacted with the help of the school authorities and the others participated through mouth to mouth communication by these students. The participants were of the age group 17-27. There were eight males and two females. They had migrated from Syria and had sought asylum in Germany. They had a low proficiency in German and English languages and were all native Arabic speakers. All of them had smart phones and only two of the ten had used Augmented Reality before. They were all familiar with Google Maps and other navigation services like DB Navigator. At the end of the study they were given a sum of 10 Euros each for the participation.
Between-group design (see [38]) was adopted for the user study meaning one participant would do one type of task (either Map View or Map + AR View). It is a simpler design and avoids learning effect (see [43]). It reduces
the time devoted by one participant to the experiment and reduces exertion and frustration [38]. But this relies on the similarity of the users since the results of one group for one experimental condition is compared against the results of the other group under a different experimental condition [38]. The group of participants was fairly homogeneous, since their levels of education, their language proficiency levels in English, and their cultural background were similar. Between-group design calls for a large recruitment of participants to conclude to significant findings. This is the limitation of this study. Hence, the results obtained are only indicative and needed to be tested with more number of participants.
Within-group (see [38]) design requires less number of participants [38]. However, in Munster, it was difficult to find two routes with the same level of complexity of the decision points. Also, making the participants navigate for over two km in two different route keeping is difficult. This could have led to false results caused by fatigue and frustration resulting in negatively biased results [38]. On the contrary positively biased results would have arisen due to learning effect [38].
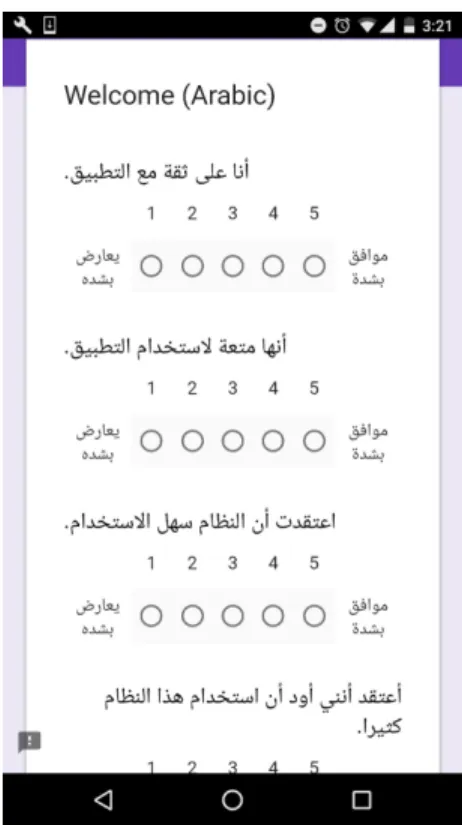
There can be several different ways to advance towards testing the dependent variables. Satisfaction can be measured by an Oral Interview, or a set of standard questionnaire like System Usability Test (SUS) [21], a rating or a one liner feedback of the interface. In this study, satisfaction is calculated by a mobile questionnaire built on the System Usability Scale(SUS) [21]. However, it only comprises of four questions. SUS cannot be applied in this case because of the low proficiency in English language among the participants. The questions were selected based on the three criteria addressed by Kamilakis and Gavalas [33]. An additional criteria of confidence of use adapted from SUS [21] was added. An online questionnaire was given to them on a mobile device. The questionnaire was translated to Arabic with the help of an Arabic Translator. Figure 7 is a screenshot of the questionnaire in Arabic.
Figure 7: Questionnaire to test the usability of the application
A mobile questionnaire for image recognition and street name recognition was also given for testing the landmark knowledge. Figure 8 shows the screenshot of the questionnaire.The route knowledge was tested by asking the participants to retrace back their path without any navigational aid. The errors were noted in case of missing a turn or taking a wrong turn.
4.2
Procedure
The experiment was set up near Ludgeriplatz, M¨unster, North-Rhine Westphalia, Germany. Figure 9 shows the experiment area. It is a moderately crowded area in the city of M¨unster. During the recruitment process the participants were asked if they were familiar with the area. They all replied in negation. This place has several important landmarks like Job Center, Immigration department, Halal Restaurants, among others.
Figure 9: Experiment Area
The study was conducted in the months of December and January. All the participants were given similar instructions at the starting point and were explained the functioning of the application. Two Android devices were used namely Nexus 5X and Samsung Galaxy S6. Both of them had an Android Version of 6.1.2. The devices were provided by the Sitcom lab of Institute for Geoinformatics, University of M¨unster. The application was already installed on these devices. It is true that a different type of interface can produce conflicting results [38]. But all the participants were familiar with Android devices and there was not much user interaction to do than a few clicks. So the use of device provided cannot create any significant variation in the results obtained.
The participants were asked to reach the destination as indicated by the interface. They were then handed over the device and was asked to use the interface (either Map View or Map+AR View which was randomly assigned). The participants opened the application, chose the assigned view, calculated the route and started the navigation. They were monitored for the errors and time taken. For the participants using Map+AR View, a note was made that whether they used AR at a decision point. After the arrival at the destination point, the participants were given an online questionnaire for recognizing street names and pictures of landmarks. After that, they were given the questionnaire for the feedback of the application. They were then asked to return back to the starting point without any aid to observe the route knowledge imparted by either of the navigation interface. Notes were made if a user creates an error of taking a wrong turn or missing a turn. Similar, notes were made when the users were retracing their paths back. A stopwatch was used to record the time taken by a user to complete the task and also to record the time between an error is made and the error is corrected by the user. At the end of the task, they were debriefed and their feedbacks and other concerns were noted down.
4.3
Pilot Study
A pilot study was conducted before the final study to figure out the problems (if any) in the application. The participants included two males of ages 24 and 25, who had come to the City of M¨unster three months ago and were unfamiliar with the study area. One participant was subjected to Map View while the other was subjected to Map + AR View. No difficulties in understanding the UI and system crashes were found during the study, this indicated that a final study can be conducted with the current functionalities of the application.
5
Results
The Effectiveness, Efficiency, Satisfaction, Landmark Knowledge and Route Knowledge obtained from the study conducted with 8 participants are described in the next sections.
5.1
Effectiveness
The completion Rate of the tasks for both Map View (MView) and Map+AR View (MARView) was 100%. All the ten participants were able to reach the destination. However, two out the five participants using the MView made an error. The error in both the scenarios was at the roundabout. Both the participants took the first exit instead of the second one. An error which may have occurred due to incorrectly associating onself in the oblique exits. In the case of MARView, no such error was made.
5.2
Efficiency
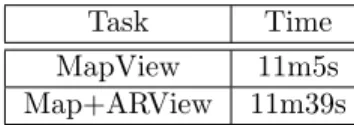
The time taken for the participants is listed in the table below. The average time taken by the MARView to complete the task is slightly more than that of the map view. The effeciency is determined by the time taken to complete both the tasks. There is only difference of 34 seconds in both the views and hence MView is only slightly more efficient tan MARView.
Task Time MapView 11m5s Map+ARView 11m39s
Table 2: The average time taken for both the tasks by the participants.
5.3
Satisfaction
The Satisfaction score of MARView was slightly more than than of the MView. However, the difference is quite low for any strong statement. But the interesting fact is that the users found MARView more fun to use and are likely to use it frequently in the future. They felt more confident in using MView and also found it easier. The table below shows the average score given by the participants to the four criteria (Confidence, Fun to Use, Easy and would use it frequently) for both the tasks.
CRITERIA MView MARView Confidence 4.6 3.8 Fun to Use 3.8 5
Easy 4.8 4
Would use it frequently 4.25 4.8 Total (out of 20) 17.2 17.6
Table 3: The average score of various factors for both the tasks.
All the scores are out of five since the participants were asked to answer from a scale of 1 to 5.
5.4
Landmark Knowledge
Eight images were shown to each participants on the online questionnaire. Out of which four were correct. The partipants who used the MARView could recognize correctly more images (Table 3).This may be attributed to the fact that they could see the landmarks in the AR View. This egocentric view helped them in remembering these places.
NUMBER OF CORRECTLY RECOGNIZED IMAGES MapView Map+AR View
3.4/8 5/8
Table 4: The average number of correctly recognized images for both the tasks.
Another questionnaire for recognising street names was given to them. They were able to correctly recall more number of street names with the MARVIiew. The street name was augmented on the route direction in MARView and was indicated on the map as well. The removal of redundant information may be the reason behind this or the less focused attention on the navigation line in case of MARView. The figure 10 shows the percentage of street names correctly recognized by the participants.
(a) MView (b) MARView
Figure 10: Percentage of street names correctly recognized by the participants
5.5
Route Knowledge
Three out of the five participants using the MView could trace their way back. However, two of them took one wrong turn and hence could not reach back without any additional aid. In the case of MARView all the five participants were able to go back to the starting point without making any error.
6
Discussion and Future Work
The debriefing session with the forced migrants suggested that they faced problems of spatial awareness around the city. They are usually only aware of the locations which have been previously told to them by friends or families. They stated the requirements of an application which would improve their learnability of important locations. These locations can be the ones which they are aware of but can’t reach without an aid or other unknown locations which might be of interest to them. They affirmed that this application if scaled and more information relevant to them were added would be very useful and they would use it frequently in the future. Issues of focused attention to the screen while navigating with a usual 2D maps application was seen. The Augmented Reality View provided them with the information of the nearby landmarks which may be of their use in future like Job Center, German learning classes, tourist spots, among others. It also decreased their tendency to get lost in oblique exits and turns.
However, the results would be more assuring if more participants are tested. In future, a within-group design can be implemented on two similar routes to get statistically significant results. A study can also be done to find out the best type of guidance layer for spatial knowledge acquisition. In the study only young participants (Aged from 16 to 27) were recruited. However, during the debriefing session it was found that adults of age more than 40 are more in need of such applications. They lack knowledge of German and English and they are not inclined to learn them at this age. An augmentation layer with information in Arabic with a suitable User Interface can be designed to address the need of this population group. The participants also apprised the need for an offline navigation tool. They briefed that they mostly do not have internet connection in their cell phones. The application that was developed during the course of this Masters thesis had this option. However, the scalability of the offline feature is still a question to be addressed.
The application here was Android based. However, it can be extended to iOS and tested with tourists, new comers, among others. The documentation on various Android platforms vary a lot making it questionable the scalability and robustness of the interface. With the updates in Android, the method structure often changes and the newer versions may sometime lack the availability of simple calculationsgeiger2014. For example, in Camera API [3], there is a provision of calculation of Horizontal Angle of View (HAV) and Vertical Angle of View (VAV) of the Camera. The Camera API was deprecated in Android API level 21. The new API called the Camera2 [1] does not have this provision and one has to manually provide a method to calculate the HAV and VAV. The magnetic field sensor is also influenced by surrounding magnetic fields [27]. Another issue is that sensor data is not manually pulled in android. All the sensor data is pushed by android to the main thread and hence one has to count on Android internal mechanisms which may be a real hazard at times.
The issue of slight oscillation of the augmentations is reduced by low pass filter. However, it is not quite efficient and requires a mechanism to handle huge flow of sensor data. In future, gyroscope along with compass and accelerometer can be used to resolve this issue to some extent. Also, in future location based augmented reality can be combined with marker based augmented reality for more accuracy.
7
Conclusion
The results obtained from the user study answers our question that “the use of Augmented Reality at Decision Points on a 2D map eases navigation and improves landmark and route knowledge of forced migrants”. The participants using the Map and ARView (MARView) were able to recognize more places correctly. These participants were also able to trace back their path without any aid while the particpiants using the Map View(MView) showed some errors for the same. The answers to the questionnaire suggested that the participants found the MARView more fun to use and are likely to use it if any such application is made available to them in the future.The average time taken to complete the task using the MARView was only slightly more than the Map View. This can be attributed to the fact that this technology was new to the users and also it takes a certain amount of time to rotate the mobile phone to obtain the correct path. However, this additional time provides them with the knowledge of important landmarks around and also eliminates the redundant information. The MARView users did not get lost during the task. This Master Thesis recommends the use of AR at Decision points having multiple oblique turns to help us reach the broader aim of making these newly Forced Migrants familiarize with the city.
References
[1] android.hardware.camera2 — Android Developers. https: //developer.android.com/reference/android/hardware/camera2/ package-summary.html. Accessed on: 2017-10-12.
[2] android.location — Android Developers. https://developer.android. com/reference/android/location/package-summary.html. Accessed on: 2017-09-25.
[3] Camera — Android Developers.
[4] Creating and Monitoring Geofences — Android Developers. https: //developer.android.com/training/location/geofencing.html. Accessed on: 2017-10-26.
[5] European Commission. 2016. EUROSTAT- Asylum Statistics. http://ec.europa.eu/eurostat/statistics-explained/index.php/ Asylum{_}statistics. Accessed on: 2016-08-26.
[6] Google Maps APIs — Google Developers. https://developers.google. com/maps/. Accessed on: 2017-08-26.
[7] Mobile SDKs from HERE Maps - HERE Developer. https://developer. here.com/develop/mobile-sdks. Accessed on: 2017-08-26.
[8] SensorManager — Android Developers. https://developer.android. com/reference/android/hardware/SensorManager.html. Accessed on: 2017-12-20.
[9] UNHCR Global Appeal 2011. http://www.unhcr.org/4cd91dc29.html. Accessed on: 2016-08-26.
[10] What is forced migration? Forced Migration Online. http:// forcedmigration.org/about/whatisfm. Accessed on: 2017-01-29.
[11] Wikitude - The World’s leading Augmented Reality SDK. https://www. wikitude.com/. Accessed on: 2017-08-26.
[12] Prof P B Alappanavar, Bhushan Kurvey, Monali Karad, and Sunil Bhagwatkar. Location Based Augmented Reality. 4(5):566–568, 2013.
[13] Pouria Amirian, Ali A Alesheikh, and Anahid Bassiri. Standards-based, interoperable services for accessing urban services data for the city of tehran. Computers, Environment and Urban Systems, 34(4):309–321, 2010.
[14] Pouria Amirian and Anahid Basiri. Landmark-based pedestrian navigation using augmented reality and machine learning. In Progress in Cartography, pages 451–465. Springer, 2016.
[15] Pouria Amirian, Anahid Basiri, and Adam Winstanley. Evaluation of data management systems for geospatial big data. In International Conference on Computational Science and Its Applications, pages 678–690. Springer, 2014.
[16] D Andreas, Mark Billinghurst, James Wen, Ville Lehtinen, and Antti Nurminen. Computers & Graphics Exploring the use of handheld AR for outdoor navigation $. 36:1084–1095, 2012.
[17] Dragomir Anguelov, Carole Dulong, Daniel Filip, Christian Frueh, St´ephane Lafon, Richard Lyon, Abhijit Ogale, Luc Vincent, and Josh Weaver. Google street view: Capturing the world at street level. Computer, 43(6):32–38, 2010.
[18] Robin Baker. Human navigation and the sixth sense. Simon and Schuster, 1981.
[19] Jennifer Baranoff, R Israel Gonzales, Jay Liu, Heidi Yang, and Jimin Zheng. Lantern: Empowering refugees through community-generated guidance using near field communication. In Proceedings of the 33rd Annual ACM Conference Extended Abstracts on Human Factors in Computing Systems, pages 7–12. ACM, 2015.
[20] Ak Beeharee and Anthony Steed. A natural wayfinding exploiting photos in pedestrian navigation systems. MobileHCI ’06 Proceedings of the 8th conference on Human-computer interaction with mobile devices and services, pages 81–88, 2006.
[21] John Brooke et al. Sus-a quick and dirty usability scale. Usability evaluation in industry, 189(194):4–7, 1996.
[22] Deana Brown and Rebecca E Grinter. Designing for transient use: A human-in-the-loop translation platform for refugees. In Proceedings of the 2016 CHI Conference on Human Factors in Computing Systems, pages 321–330. ACM, 2016.
[23] Jaewoo Chung, Francesco Pagnini, and Ellen Langer. Mindful navigation for pedestrians: Improving engagement with augmented reality. Technology in Society, 45:29–33, 2016.
[24] Shane Conder and Lauren Darcey. Android SDK Augmented Reality: Camera & Sensor Setup. https://code.tutsplus.com/tutorials/ android-sdk-augmented-reality-camera-sensor-setup--mobile-7873. Accessed on: 2017-09-12.
[25] Alan B Craig. Understanding augmented reality: Concepts and applications. Newnes, 2013.
[26] Liisa AM Galea and Doreen Kimura. Sex differences in route-learning. Personality and individual differences, 14(1):53–65, 1993.
[27] Philip Geiger, Marc Schickler, R¨udiger Pryss, Johannes Schobel, and Manfred Reichert. Location-based mobile augmented reality applications: Challenges, examples, lessons learned. WEBIST 2014 - Proceedings of the 10th International Conference on Web Information Systems and Technologies, 2:383–394, 2014.
[28] Fern R Hauck, Elsbeth Lo, Anne Maxwell, and P Preston Reynolds. Factors influencing the acculturation of burmese, bhutanese, and iraqi refugees into american society: Cross-cultural comparisons. Journal of Immigrant & Refugee Studies, 12(3):331–352, 2014.
[29] Frank Heidmann, Fabian Hermann, and Matthias Peissner. Interactive maps on mobile, location-based systems: design solutions and usability testing. Proc. 21st ICC. Durban, South Africa, 2003.
[30] C. Donald Heth, Edward H. Cornell, and Tonya L. Flood. Self-ratings of sense of direction and route reversal performance. Applied Cognitive Psychology, 16(3):309–324, 2002.
[31] MR Hill. Asking directions and pedestrian wayfinding. Man-Environment Systems, 17(4):113–120, 1987.
[32] Jamal Jokar Arsanjani, Alexander Zipf, Peter Mooney, and Marco Helbich. OpenStreetMap in GIScience. OpenStreetMap in GIScience: Experiences, Research, Applications, (JANUARY):1–20, 2015.
[33] Manousos Kamilakis and Damianos Gavalas. Mobile User Experience in Augmented Reality vs . Maps Interfaces : A Case Study in Public Transportation. 4:388–396, 2016.
[34] Anuroop Katiyar, Karan Kalra, and Chetan Garg. Marker Based Augmented Reality. Advances in Computer Science and Information Technology, 2(5):441–445, 2015.
[35] Roger E Kirk. Experimental design. Wiley Online Library, 1982.
[36] Thomas H. Kolbe. Augmented Videos and Panoramas for Pedestrian Navigation. Geowissenschaftliche Mitteilungen, 66(Azuma 1997):45–52, 2003.
[37] Antonio Kr¨uger, Ilhan Aslan, and Hubert Zimmer. The Effects of Mobile Pedestrian Navigation Systems on the Concurrent Acquisition of Route and Survey Knowledge. Mobile HCI, pages 39–60, 2004.
[38] Jonathan Lazar, Jinjuan Heidi Feng, and Harry Hochheiser. Research methods in human-computer interaction. John Wiley & Sons, 2010.
[39] Andrew J May, Æ Tracy Ross, and Æ Steven H Bayer. Pedestrian navigation aids : information requirements and design implications. pages 331–338, 2003.
[40] Don D McMahon, Cate C Smith, David F Cihak, Rachel Wright, and Melinda M Gibbons. Effects of digital navigation aids on adults with intellectual disabilities: Comparison of paper map, google maps, and augmented reality. Journal of Special Education Technology, 30(3):157–165, 2015.
[41] Alexandra Millonig and Katja Schechtner. Developing landmark-based pedestrian-navigation systems. IEEE Transactions on Intelligent Transportation Systems, 8(1):43–49, 2007.
[42] Daniel R Montello. A new framework for understanding the acquisition of spatial knowledge in large-scale environments. Spatial and temporal reasoning in geographic information systems, pages 143–154, 1998.
[43] Gur Mosheiov. Scheduling problems with a learning effect. European Journal of Operational Research, 132(3):687–693, 2001.
[44] Alessandro Mulloni, Hartmut Seichter, and Dieter Schmalstieg. User experiences with augmented reality aided navigation on phones. In Mixed and Augmented Reality (ISMAR), 2011 10th IEEE International Symposium on, pages 229–230. IEEE, 2011.
[45] David J Murphy, Tuomas Vaittinen, and Ville-Veikko Mattila. Mirror worlds as large-scale outdoor mixed reality enablers. In ISMAR 2011 Workshop: Enabling Large-Scale Outdoor Mixed Reality and Augmented Reality, IEEE, 2011.
[46] U Nations. World urbanization prospects: The 2014 revision, highlights. department of economic and social affairs. Population Division, United Nations, 2014.
[47] Karen OReilly. When is a tourist? the articulation of tourism and migration in spains costa del sol. Tourist studies, 3(3):301–317, 2003.
[48] Malisa Ana Plesa and William Cartwright. Evaluating the effectiveness of non-realistic 3d maps for navigation with mobile devices. In Map-based mobile services, pages 80–104. Springer, 2008.
[49] Tracy Ross, Andrew May, and Simon Thompson. The use of landmarks in pedestrian navigation instructions and the effects of context. In International Conference on Mobile Human-Computer Interaction, pages 300–304. Springer, 2004.
[50] Dieter Schmalstieg and Gerhard Reitmayr. Chapter 19 Augmented Reality as a Medium for Cartography.
[51] Wieland Schwinger, Christoph Gr¨un, Birgit Pr¨oll, and Werner Retschitzegger. Context-awareness in mobile tourist guides. In Handbook of Research on Mobile Multimedia, Second Edition, pages 534–552. IGI Global, 2009.
[52] Alexander W Siegel and Sheldon H White. The development of spatial representations of large-scale environments. Advances in child development and behavior, 10:9–55, 1975.
[53] Reem Talhouk, Syed Ishtiaque Ahmed, Volker Wulf, Clara Crivellaro, Vasilis Vlachokyriakos, and Patrick Olivier. Refugees and hci sig: The role of hci in responding to the refugee crisis. In Proceedings of the 2016 CHI Conference Extended Abstracts on Human Factors in Computing Systems, pages 1073–1076. ACM, 2016.
[54] David Waller, Earl Hunt, and David Knapp. The transfer of spatial knowledge in virtual environment training. Presence: teleoperators and virtual environments, 7(2):129–143, 1998.
[55] Benjamin Walther-Franks and Rainer Malaka. Evaluation of an augmented photograph-based pedestrian navigation system. Lecture Notes in Computer Science (including subseries Lecture Notes in Artificial Intelligence and Lecture Notes in Bioinformatics), 5166 LNCS:94–105, 2008.
[56] James Wen, William S Helton, and Mark Billinghurst. A study of user perception, interface performance, and actual usage of mobile pedestrian navigation aides. In Proceedings of the Human Factors and Ergonomics Society Annual Meeting, volume 57, pages 1958–1962. SAGE Publications Sage CA: Los Angeles, CA, 2013.
[57] Jan M Wiener, Alexander Schnee, and Hanspeter A Mallot. Navigation strategies in regionalized environments. Retrieved May, 2:2006, 2004.
[58] Ying Xu, Carleen Maitland, and Brian Tomaszewski. Promoting participatory community building in refugee camps with mapping technology. In Proceedings of the Seventh International Conference on Information and Communication Technologies and Development, page 67. ACM, 2015.