Maria dos Anjos
de Jesus Barros
Monteiro Lopes
BIOVALORIZAÇÃO DE RESÍDUOS ALIMENTARES
POR PROCESSOS DE ACIDIFICAÇÃO ANAERÓBIA
BIOVALORIZATION OF FOOD WASTES BY
ANAEROBIC ACIDIFICATION PROCESSES
Maria dos Anjos
de Jesus Barros
Monteiro Lopes
BIOVALORIZAÇÃO DE RESÍDUOS ALIMENTARES
POR PROCESSOS DE ACIDIFICAÇÃO ANAERÓBIA
BIOVALORIZATION OF FOOD WASTES BY
ANAEROBIC ACIDIFICATION PROCESSES
Tese apresentada à Universidade de Aveiro para cumprimento dos requisitos necessários à obtenção do grau de Doutor em Ciências e Engenharia do Ambiente, realizada sob a orientação científica da Doutora Maria Isabel Aparício Paulo Fernandes Capela, Professora Associada do Departamento de Ambiente e Ordenamento da Universidade de Aveiro, e do Doutor Luís Manuel Guerreiro Alves Arroja, Professor Associado com Agregação, aposentado, do Departamento de Ambiente e Ordenamento da Universidade de Aveiro.
Apoio financeiro do Instituto Camões POPH/FSE (SFRH/BD/46845/2011) no âmbito do Quadro Comunitário de apoio 2011 – 2014
Dedico este trabalho:
à minha amada filha Emma Luísa, ao meu marido Florentino Neves, à minha mãe (in memória), ao meu pai e irmãos.
o júri
presidente Prof. Doutor Nuno Miguel Borges de Carvalho Professor Catedrático da Universidade de Aveiro
Prof. Doutor António José Guerreiro de Brito
Professor Associado com Agregação do Instituto Superior de Agronomia, Universidade de Lisboa
Prof. Doutor António João Carvalho de Alburquerque
Professor Auxiliar da Faculdade de Ciências da Engenharia, Universidade da Beira Interior
Prof. Doutora Leonor Miranda Monteiro do Amaral
Professora Auxiliar da Faculdade de Ciências e Tecnologia, Universidade Nova de Lisboa
Prof. Doutora Maria Helena Gomes da Almeida Gonçalves Nadais Professora Auxiliar da Universidade de Aveiro
Prof. Doutora Maria Isabel Aparício Paulo Fernandes Capela Professora Associada da Universidade de Aveiro (orientadora)
Agradecimentos Além de um considerável esforço próprio e de realização pessoal, por de trás deste trabalho encontram-se enormes contribuições, sugestões e apoios vindos de diversas pessoas, sem as quais teria sido muito difícil concluir este trabalho.
Assim, ao concluir este projeto da minha vida resta-me então manifestar os meus sinceros agradecimentos à Professora Isabel Capela, pela orientação, sugestões, dedicação durante todas as fases do desenvolvimento deste trabalho e pelos valiosos apoios.
Agradeço também ao Professor Luís Arroja, que aceitou desde logo ser o meu co-orientador.
Agradeço também à Tânia, pela enorme contribuição, sugestões, orientação de uma valia tão grande... o meu muito obrigada.
Ao Professor Arlindo Matos pelo carinho e por estar sempre disponível para qualquer que seja o assunto.
Ao Professor Camiro Pio, pelo carinho, incentivo e por ter me emprestado a sua confortável cadeira a fim de aliviar as minhas dores de costas, no momento mais complicado deste trabalho.
À Paula, Martha, Sónia, Ana Vicente e Márcio, pela amizade e por estarem sempre presentes nas horas boas e más da minha vida.
À doce amiga Anabela do bar do DAO, pela amizade, carinho e apoio moral.
Aos colegas do laboratório de águas e resíduos, Vitória, Cátia e Flávio, pelo apoio e convivência saudável.
À Diana, Engª. Manuela e ao Nuno, pelo apoio logístico e colaboração nas análises laboratoriais.
À Sandra, João e Djoy, pela força, companheirismo, cumplicidade e incentivo nos momentos difíceis.
À Universidade de Cabo Verde, pelo apoio e dispensa de serviço docente concedida durante a minha formação e ao Instituto Camões, pela concessão da bolsa de estudo. Ao meu pai Elias e a minha mãe Luísa (in memória) por terem acreditado na minha capacidade, e que não mediram esforços em investir e contribuir para minha formação profissional.
Ao meu marido Florentino e minha amada filha e companheira Emma que são razão e motivo para minha longa jornada, pelo amor, apoio e compreensão dos momentos da minha ausência. Te amo amor!
À minha família e em especial às minhas irmãs Tesera, Maria Luisa e Zizi, pelo enorme apoio e contribuição à minha formação.
A todos os professores do Departamento Ambiente e Ordenamento, que de forma direta ou indireta contribuíram para a minha formação.
A todos que não se encontram aqui expressados, mas que contribuíram para o desenvolvimento deste trabalho, os meus sinceros agradecimentos.
A Deus, meu porto seguro, por estar sempre presente na minha vida. O Senhor é meu pastor. Nada me faltará.
anaeróbia, ácidos orgânicos voláteis (AOV), polihidroxialcanoatos (PHA)
resumo A biodegradação constitui uma opção ecológica e sustentável para a eliminação e valorização de resíduos orgânicos, nomeadamente de origem alimentar. Estes resíduos podem ser tratados e valorizados através de processos de digestão anaeróbia, reduzindo assim o seu teor poluente e ao mesmo tempo produzir compostos intermediários valorizáveis, como os ácidos orgânicos voláteis (AOV). Estes compostos resultantes da fermentação acidogénica são fontes de carbono preferenciais para a obtenção de produtos de valor acrescentado, nomeadamente polihidroxialcanoatos (PHA) ou bioenergia, sob a forma de metano ou hidrogénio.
Neste trabalho estudou-se a fermentação acidogénica de vários resíduos orgânicos, em mono ou co-digestão, nomeadamente a fração orgânica de resíduos sólidos urbanos (FORSU), resíduos da indústria de processamento de tomate (RT), borras de café (BC) e lamas ativadas prevenientes de uma estação de tratamento de águas residuais domésticas (LA), em reatores descontínuos e semi-contínuos, a fim de avaliar o seu potencial de produção de AOV.
Nestes ensaios foram estudados os efeitos de vários parâmetros, nomeadamente a 1) concentração de sólidos totais (ST) no interior do reator, 2) a alcalinidade, 3) a carga orgânica (CO) e 4) a relação carbono-azoto (C:N).
Nos ensaios de mono-digestão, verificou-se um comportamento muito distinto nos quatro substratos estudados, com um grau de acidificação substancialmente superior para o RT (49 %) e FORSU (41 %) do que para as borras de café (10 %) e lamas ativadas (6 %). Observou-se também que nos ensaios de co-digestão, o ensaio com a percentagem mais elevada de RT (75 %) e BC (25 %) apresentaram o mais elevado grau de acidificação (57 %), confirmando a sinergia que ocorreu com esta mistura.
Dos três modelos cinéticos utilizados para estudar o desempenho da co-digestão entre os dois resíduos maioritários em Cabo Verde (FORSU e LA), o modelo que apresentou a melhor correlação para obtenção do potencial metanogénico foi o modelo de exponencial (com Curve factor). Os valores para a constante de velocidade metanogénica aumentaram com o aumento de FORSU na mistura, com o valor experimental máximo de kM (0.27 d-1)
obtido no ensaio com 75% de FORSU. Verificou-se também que apesar da baixa biodegradabilidade das LA, este substrato promoveu a estabilidade do processo de digestão da FORSU neste ensaio, evitando assim a inibição da produção de metano devido a valores baixos de pH e a concentrações elevadas de AOV, conforme verificado experimentalmente no ensaio de mono-digestão da FORSU. Assim, o estudo cinético forneceu uma ferramenta simples e útil para prever o desempenho do reator no que diz respeito à produção de metano, tendo em conta as proporções de cada um dos co-substratos nas condições aplicadas.
que o aumento da concentração de alcalinidade adicionada conduziu ao aumento do grau de acidificação. Por conseguinte, o maior grau de acidificação obtido foi de 78% com a combinação de ST mais baixo estudado (5 %) e a alcalinidade adicionada mais elevada (50 gCaCO3.L-1).
No entanto, e dependendo da utilização final dos AOV que são produzidos, as condições que apresentaram elevado teor de AOV (99 %), com uma concentração elevada de ácido propiónico na sua composição (mais adequado para a produção de PHA de elevada qualidade), foram os teores de ST intermédios (8 %). A partir das superfícies de resposta obtidas observou-se também que todas as variáveis de resposta estudadas (produção de AOV, grau de acidificação e qualidade do efluente) apresentaram uma dependência maior do teor em ST do que da adição de alcalinidade.
O processo de fermentação acidogénica da FORSU foi posteriormente desenvolvido em modo semi-contínuo num reator CSTR, que operou a longo prazo. De todas as condições testadas (carga orgânica entre 3.0–6.5 g COD L-1 e alcalinidade entre 2.0-5.0 g CaCO
3 L-1), a condição onde se
obteve o maior grau de acidificação (59 %), a melhor qualidade de efluente em termos de AOV (66 %), e uma boa razão impar-par em AOV (0.44), foi o ensaio com carga orgânica de 6,0 g CQO L-1d-1 e alcalinidade de 2,5 g
CaCO3 L-1. O aumento da carga orgânica levou aoaumento de AOV, sendo
os ácidos acético, propiónico e butírico as espécies predominantes em todas as fases do processo.
O efluente acidificado no processo anaeróbio foi então usado como substrato em reatores SBR operadospara seleção de culturas microbianas mistas com capacidade para acumular PHA, nos quais foi aplicado um regime de alimentação dinâmica (fartura/fome) em condições aeróbias. Foram estudadas três cargas orgânicas e duas razões C:N para avaliar o potencial de enriquecimento da cultura. Durante o processo, todas as condições testadas apresentaram uma eficiência de remoção de CQO superior a 80 %, com uma acumulação de PHA entre 17 % e 53 %. Em estudos de acumulação de PHA efetuados em reatores semi-contínuos foram estudados três valores de pH, entre 7 e 8.5, em que a acumulação de PHA foi mais favorável a pH neutro, resultando num teor de PHA de 25% (w/w). O monómero HB foi o principal composto do polímero sintetizado a partir de FORSU acidificada.
Com base nestes resultados, pode concluir-se que os resíduos orgânicos de origem alimentar podem ser tratados por processos biológicos, com tratamento convencional de resíduos, e ao mesmo tempo podem ser convertidos em materiais de valor acrescentado.
(VFA), polyhydroxyalkanoates (PHA).
abstract Biodegradation is an eco-friendly option for the disposal and recovery of organic waste, including food waste (FW). These residues can be treated and recovered through anaerobic digestion processes, thereby reducing their pollutant content and, at the same time, producing high value-products such as volatile fatty acids (VFA). These compounds resulting from acidogenic fermentation are the preferred carbon sources for the production of added-value products, namely polyhydroxyalkanoates (PHA) or bioenergy, in the form of methane or hydrogen.
In this work, it was studied the acidogenic fermentation of several organic residues, such as the organic fraction of municipal solid waste (OFMSW), waste from the tomato processing industry (TW), coffee grounds waste (CG) and waste activated sludge (WAS) from a wastewater treatment plant. The assays were performed in batch and semi-continuous reactors, either in mono- or co-digestion assays, in order to assess and optimize its potential for VFA production. In these tests, the effects of various parameters, such as 1) total solids (TS) content in the reactor, 2) alkalinity addition, 3) organic loading rate (OLR) applied and 4) carbon-nitrogen ratio (C:N) were studied. In the mono-digestion assays, a very distinct behavior was observed in the four substrates studied, with a substantially higher acidification rate for TW (49 %) and OFMSW (41 %) than for CG (10 %) and WAS (6 %). It was also observed that in the co-digestion assays, the assay with the highest percentage of TW (75 %) and GC (25 %) showed the highest acidification degree (57 %), confirming the synergy that occurred with this mixture. Out of the three kinetic models used to study the co-digestion performance between the two major residues in Cape Verde (OFMSW and WAS), the model that presented the best correlation to obtain the methanogenic potential was exponential Curve factor model. The values for the methanogenic rate constant increased with the increase of OFMSW in the mixture, with the maximum experimental value of kM (0.27 d-1) obtained in
the 75 % OFMSW assay. It was also found that, despite the low biodegradability of WAS, this substrate promoted the stability of the OFMSW digestion process in this assay, thus avoiding the inhibition of methane production due to low pH values and high concentrations of VFA, as verified experimentally in the OFMSW mono-digestion test. Thus, the kinetic study provided a simple and useful tool to predict reactor performance with respect to methane production, taking into account the proportions of each of the co-substrates, and under the conditions applied.
increase in the alkalinity addition led to the increase of the degree of acidification. Therefore, the highest degree of acidification (78 %) was obtained at the lowest TS reactor content (5 %) and the highest alkalinity addition (50 gCaCO3.L-1). However, depending on the ultimate use of the
produced VFA mixture, the conditions presenting the highest VFA content (99 %) with high propionic acid concentration (VFA mixture more suitable for the production of high quality PHA), were the intermediate TS reactor content (8 %). From the response surfaces obtained, it was also observed that all response variables under study (VFA production, degree of acidification and effluent quality) presented a higher dependency on TS reactor content than on initial alkalinity addition.
The FORSU acidogenic fermentation process was further developed in a semi-continuous CSTR reactor, which was operated under long-term and several operational conditions (organic load between 3.0 - 6.5 g COD L-1 and
alkalinity between 2.0 - 5.0 g CaCO3L-1).The operational condition
correspondent to of 6.0 g COD L-1d-1 and the alkalinity of 2.5 g CaCO3 L-1,
was the condition where the highest degree of acidification (59 %), the best effluent quality In terms of VFA (66 %), and a good odd-to-even ratio in VFA (0.44) were achieved. In general, the increase on the organic load applied led to the increase of VFA, with acetic, propionic and butyric acids being always the predominant species in all experimental stages.
The acidified effluent in the anaerobic process was then used as substrate in SBR reactors operated for the selection of mixed microbial cultures with high capacity for PHA accumulation, where it was applied a regime of dynamic feeding (feast/famine) under aerobic conditions. Three organic loads and two C:N ratios were studied, in order to evaluate the enrichment potential of the microbial mixed culture. During the process, all tested conditions showed a COD removal efficiency higher than 80 % with a PHA accumulation capacity between 17 % and 53 %. In PHA accumulation studies carried out in fed-batch reactors, three different pH values, between 7 and 8.5 were studied, where PHA accumulation was more favorable at neutral pH, , resulting in a PHA content of 25 % (w/w). The HB monomer was the main compound of the polymer synthesized from acidified OFMSW. Based on these results, it can be concluded that organic waste from food sources can be treated by biological processes, as a conventional waste treatment, and at the same time can be converted into value-added materials.
i
Table of contents
Table of contents ... i
List of tables ... vi
List of figures ... viii
List of abbreviations ... xii
1. Introduction ... 1
1.1 General introduction ... 3
1.2 Aim of the work ... 5
1.3 Structure of the thesis ... 6
2. State of the art ... 9
2.1 Wastes generation ... 11
2.1.1 Organic solid wastes production ... 13
2.1.2 Organic wastes produced worldwide ... 15
2.1.2.1 Coffee grounds ... 15
2.1.2.2 Tomato wastes ... 17
2.1.2.3 Wasted activated sludge ... 18
2.1.3 Production and characterization of MSW in Cape Verde ... 20
2.2 Anaerobic digestion process ... 22
2.2.1 Historical perspective ... 22
2.2.2 Microbiology and biochemistry ... 25
2.2.2.1 Hydrolysis ... 26
2.2.2.2 Acidogenesis ... 27
2.2.2.3 Acetogenesis... 28
2.2.2.4 Metanogenesis ... 29
2.2.3 Anaerobic digestion of organic solid waste ... 30
2.2.4 Anaerobic co-digestion of organic solid waste... 31
2.3 Key parameters in anaerobic digestion of solid waste ... 35
2.3.1 Temperature ... 35
2.3.2 pH and alkalinity ... 36
2.3.3 Retention time ... 37
2.3.4 Organic loading rate ... 38
2.3.5 Nutritional additives ... 38
2.3.6 Toxicants inhibitory ... 40
2.3.6.1 Toxic Organic compounds ... 40
ii
2.3.6.2.1 Ammonia ... 41
2.3.6.2.2 Sulfide ... 41
2.3.6.2.3 Heavy metals ... 42
2.3.6.2.4 Salts ... 42
2.4 Biovalorization of anaerobic digestion byproducts ... 43
2.4.1 Volatile fatty acids ... 44
2.4.2 Bioenergy ... 46 2.4.2.1 Electric energy... 46 2.4.2.2 Biogas ... 47 2.4.2.3 Hydrogen ... 47 2.4.2.4 Biodiesel ... 48 2.4.3 Added-value compounds ... 49 2.4.3.1 Polyhydroxyalkanoates ... 49
2.5 Kinetic model of anaerobic digestion ... 53
3. Methodology ... 57
3.1 Introduction ... 59
3.2 Organic residues and aerobic and anaerobic inocula ... 59
3.2.1 Inocula ... 60
3.2.1.1 Anaerobic Biomass ... 60
3.2.1.2 Aerobic Biomass ... 60
3.2.2 Organic residues as substrates ... 60
3.2.2.1 Waste Activated Sludge (WAS) ... 60
3.2.2.2 Organic Fraction of Municipal Solid Waste (OFMSW) ... 62
3.2.2.3 Coffee Grounds (CG) ... 63
3.2.2.4 Tomato Waste (TW)... 64
3.3 Biological reactors operation ... 65
3.3.1 Anaerobic Batch experiments ... 65
3.3.1.1 Experiment set up and operational conditions ... 66
3.3.1.1.1 Experiment I ... 68
3.3.1.1.2 Experiment II... 68
3.3.1.1.3 Experiment III ... 70
3.3.2 Reactor set-up for continuous or semi/continuous experiments ... 70
3.3.2.1 Semi-continuous anaerobic experiments ... 72
3.3.2.1.1 Experimental set-up... 72
3.3.2.1.2 Operational conditions ... 73
iii
3.3.3.1 Aerobic batch assays for PHA accumulating ... 76
3.4 Analytical Procedures ... 78
3.4.1 Solids ... 78
3.4.2. Chemical Oxygen Demand (COD) ... 79
3.4.2.1 Closed reflux method ... 79
3.4.2.2 Open reflux method ... 80
3.4.3. pH and Alkalinity ... 81
3.4.4. Total Organic Carbon (TOC) ... 81
3.4.5. Total Kjeldahl Nitrogen (TKN) ... 82
3.4.6. Volatile Fatty Acids (VFA) ... 82
3.4.7. Biogas ... 83
3.4.8. Polyhydroxyalkanoates (PHA) ... 84
3.5 Microscopic Analysis ... 85
3.5.1 Direct observation of samples and Fluorescence ... 85
3.6 Indirect Calculations ... 85
3.6.1 Degree of Solubilization (DS) ... 85
3.6.2 Degree of Acidification (DA) ... 86
3.6.3 Odd-to-Even ratio of VFA (Odd-to-even) ... 86
3.6.4 Total solids (TS) or volatile solids (VS) removal... 87
3.6.5 Hydraulic Retention Time (HRT)... 87
3.6.6 Organic Loading Rate (OLR) ... 88
3.7 Kinetic Model ... 88
3.7.1 Hydrolysis kinetic coefficient of the first order... 88
3.7.2 Methanogic kinetic coefficient ... 89
3.8 Statistical Study ... 90
3.8.1 Response surface methodology (RSM) ... 90
3.8.2 Quadratic model validation ... 91
4. Acidogenic biochemical potential of various organic wastes in mono and co-fermentation processes ... 93
4.1 Introduction ... 95
4.2 Results and Discussion ... 96
4.2.1 Mono substrates digestion and performance ... 96
4.2.2 From mono-digestion to co-digestion of organic solid wastes ... 99
4.2.3 VFA composition during the acidogenic co-fermentation assays ... 104
4.2.4 Digester stability on VFA production ... 107
iv
4.2.6 Kinetic study ... 110
4.3 Conclusions ... 111
5. Performance and kinetic assessment of Co-fermentation of WAS and OFMSW .... 113
5.1 Introduction ... 115
5.2 Results and Discussion ... 115
5.2.1 Performance of batch anaerobic reactors... 115
5.2.2 Fermentation products from anaerobic co-digestion assays ... 118
5.2.3 Methane yields for the single and mixed substrates ... 120
5.2.4 Kinetic assessment ... 122
5.2.4.1 Determination of first-order hydrolysis rate constants ... 122
5.2.4.2 Assessment of methanogenic kinetics and comparison of models ... 125
5.2.4.3 Assessment of digester stability/inhibition ... 130
5.2.5 Mixture ratio assessment ... 133
5.3 Conclusions ... 134
6. Study of acidogenic fermentation of OFMSW for volatile fatty acids production in batch reactors... 137
6.1 Introduction ... 139
6.2 Influence of TS concentrations and alkalinity addition ... 139
6.3 Results and Discussion ... 140
6.3.1 pH and COD conversion ... 141
6.3.2 Solubilization of particulate organic matter ... 144
6.3.3 Acidogenic potential of OFMSW ... 146
6.3.3.1 Performance of acidogenic fermentation ... 146
6.3.3.2 VFA production and effluent quality ... 149
6.3.3.3 Dependence of acidogenic fermentation on pH ... 151
6.3.4 Statistical Analysis of acidogenic fermentation of OFMSW ... 153
6.4 Conclusions ... 157
7. CSTR operation for the acidogenic fermentation of OFMSW: Effect of operational parameters ... 159
7.1 Introduction ... 161
7.2 Results and Discussion ... 162
7.2.1 Solubilization and acidification efficiencies... 162
7.2.2 VFA production and composition ... 166
7.2.3 Biogas production ... 171
7.2.4 Effect of the pair OLR and Alkalinity applied for the stability of the acidogenic fermentation process ... 173
v
7.3 Conclusions ... 176
8. Polyhydroxyalkanoates (PHA) production from acidified OFMSW ... 179
8.1 Introduction ... 181
8.2 Results and Discussion ... 182
8.2.1 Enrichment of PHA accumulating microorganisms with fermented OFMSW ...182
8.2.2 Effect of the C:N ratio in the performance of the SBR enrichment ... 189
8.2.3 Microscopic observations ... 191
8.2.4 PHA accumulation in batch experiments with acidified OFMSW ... 192
8.2.5 PHA production and quality: a comparison approach ... 194
8.3 Conclusions ... 195
9. General conclusions and perspectives of future work ... 197
9.1 General Conclusions ... 199
9.2 Future work ... 201
10. References ... 203
11. Annexes ... 227
Annex I - The determination of chemical oxygen demand (COD): preparation of the solutions (closed reflux) ... 229
Annex II - Preparation of these reagents for TCOD determination (open reflux) ... 229
Annex III - Calibration of the chromatographic method for the quantification the VFA ... 230
Annex IV - The calibration curves for monomers (PHA) determination: methodology to PHA quantify. ... 232
vi
List of tables
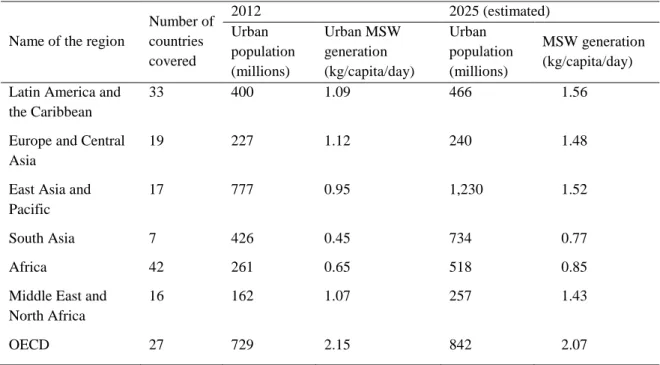
Table 2-1: Urban population and MSW generation rate of different regions of the globe for
2012 and 2025 (adapted from Hannan et al. (2015)). ... 12
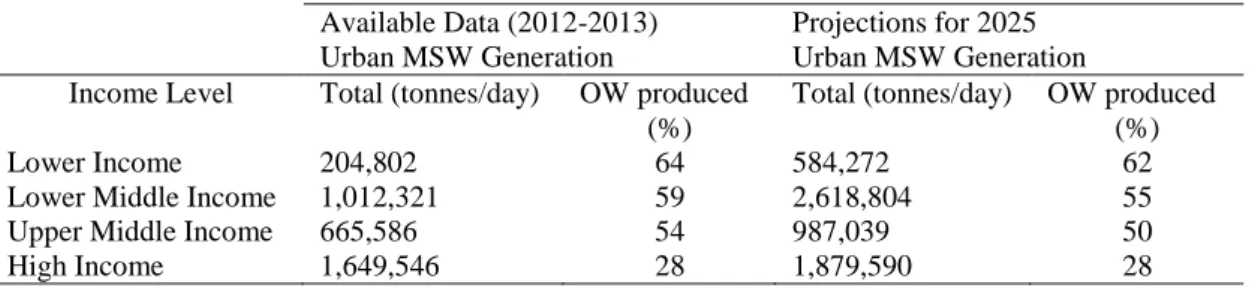
Table 2-2: Global MSW generation and OW produced in % by income level for 2012 and projections for 2025 (adapted from What a Waste (2012)). ... 14
Table 2-3: The Top 10 coffee producing and exporting countries in 2015/2016 (adapted from: www. ico.org (2016)). ... 15
Table 2-4: Main advantages of AD of the organic wastes treatment. ... 24
Table 2-5: Different types of solid organic waste from the co-digestion. ... 34
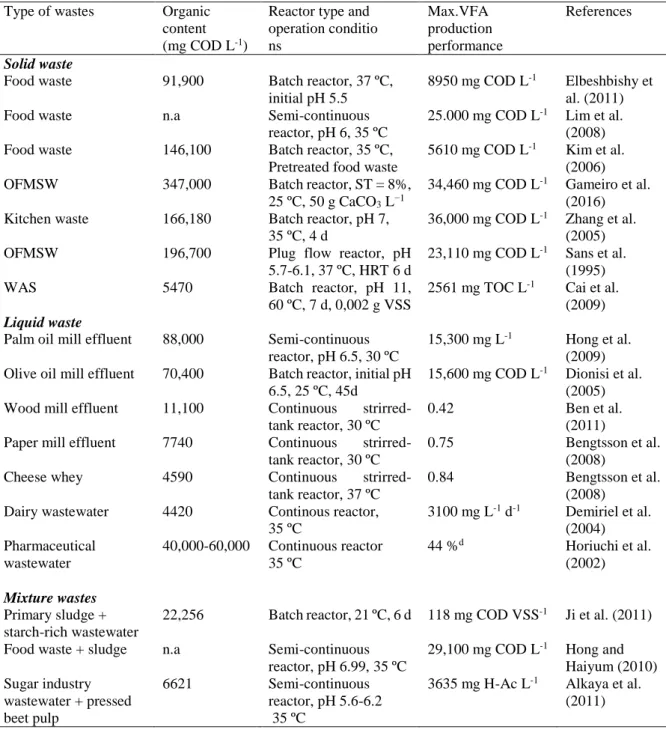
Table 2-6: Different types of organic wastes used for production of VFA (adapted from Lee et al. (2014)). ... 45
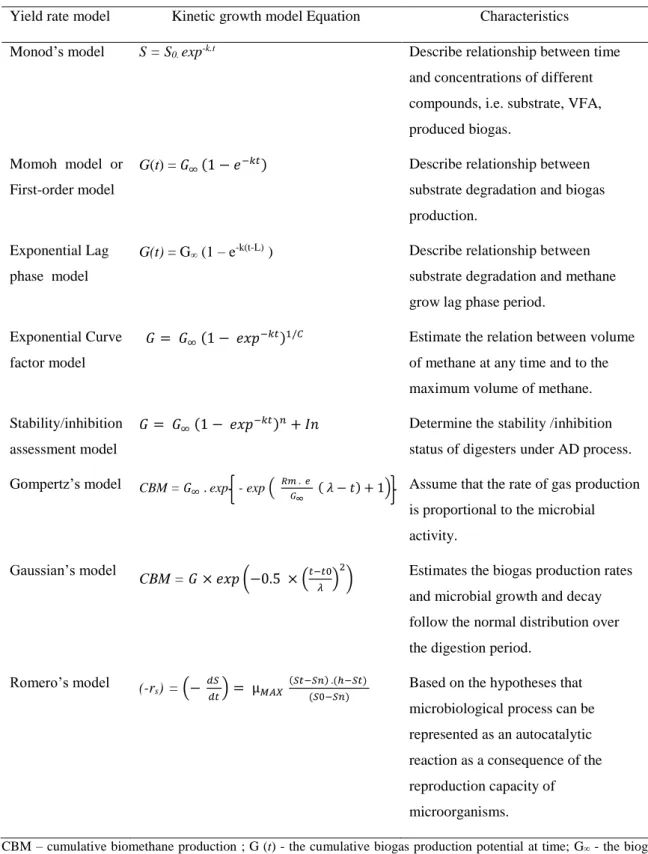
Table 2-7: The most studied kinetic model of anaerobic digestion (adapted from Nielfa et al. (2015)) ... 55
Table 3-1: Characterization of the anaerobic biomass used in the fermentation batch assays (average ± standard deviation). ... 60
Table 3-2: Characterization of the aerobic biomass used in the biomass enrichment assays for PHA production (average ± standard deviation). ... 60
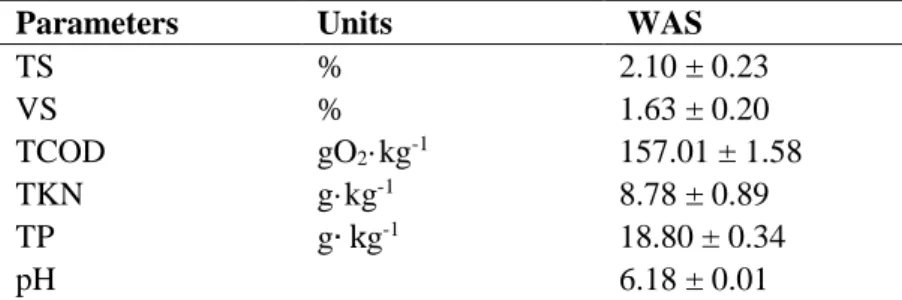
Table 3-3: Characterization of the WAS (average ± standard deviation). ... 62
Table 3-4: Characteristic of OFMSW used in this study (average ± standard deviation). . 63
Table 3-5: The coffee grounds characteristics (average ± standard deviation) ... 64
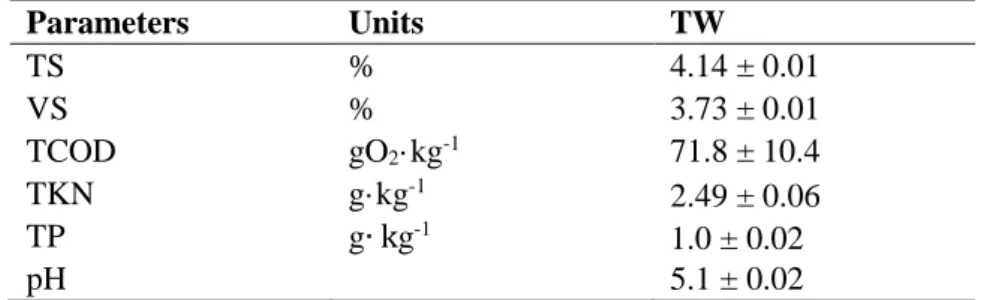
Table 3-6: The main characteristics of tomato waste (average ± standard deviation). ... 65
Table 3-7: Composition of inorganic nutrient solution ... 67
Table 3-8: Main characteristic of the feedstock used in CSTR system. ... 73
Table 3-9: Experimental phases tested in the acidogenic CSTR reactor ... 74
Table 3-10: SBRs operational conditions for biomass selection and enrichment ... 75
Table 3-11: Micronutrients concentration added SBR and batch reactors ... 77
Table 4-1: Soluble and total COD in the beginning of the experiment, maximum total VFA concentration, DA in percentage, and VFA/ALK ratio, in the co-digestions assays (mean ± standard deviation) ... 101
Table 4-2: Maximum predicted and experimental VFAs produced in batch experiments of mono and co-digester acidogenic fermentation and kinetic parameters obtained in this study. ... 111
vii
Table 5-1: Summary of digester performance of co-digestion WAS with OFMSW under
different conditions. ... 121
Table 5-2: Values of hydrolysis rate constants (kH) obtained with different subtracts in different studies ... 123
Table 5-3: Parameters estimated from non-linear regression for of kinetic parameters and statistical analysis predicted by three models. ... 126
Table 5-4: Values of methanogenic rate constants (kM) obtained with different subtracts in different studies. ... 129
Table 5-5: The co-digestion of OFMSW and WAS mixing ratios (n value) and inhibition/stability variation (In values). ... 132
Table 6-1: Parameters determined in the batch assays: initial TCOD and sCOD concentrations and maximum sCOD and VFA concentrations measured, maximum degree of solubilization (DSmáx) and maximum degree of acidification (DAmáx), maximum odd-to-even ratio of VFA and maximum VFA amount in sCOD (effluent quality) in all assays. 141 Table 6-2: Fitting coefficients and evaluation of regressions ... 154
Table 7-1: Summary of the experimental results obtained in the CSTR operation ... 163
Table 8-1: Composition of the fermented OFMSW used as carbon source ... 183
Table 8-2: Reactor performance under different enrichments conditions. ... 183
Table 8-3: TOC and TN consumption during the feast phase. ... 189
Table 8-4: Performance of batch PHA production under various pH conditions. ... 192
Table 8-5: Comparison between OFMSW and other similar food wastes used as substrate for PHA accumulation step... 195
Table 11-1: VFA composition of each standard used in this study ... 231
Table 11-2: Individual concentrations for the standards dilution (mg L-1), with 30% of formic acid added. ... 232
viii
List of figures
Figure 2-1: World production and consumption of coffee between 2012/13 and 2015/16
(adapted from www. ico.org, 2016). ... 16
Figure 2-2: MSW composition and composition for the Praia city (data from 2013 – 2015).
... 22
Figure 2-3: Schematic example relationship between digester operation and benefits
(adapted from: Kinyua et al., 2016). ... 23
Figure 2-4: Process Diagram for Anaerobic Digestion of Organic Municipal Solid Waste
(Modified from Naik and Wung (2013) and Stronach et al., 1986) ... 26
Figure 2-5: Production of waste derived VFA and their applications (adapted from Lee et
al. (2014)). ... 46
Figure 2-6: General structure of PHA. ... 49 Figure 2-7: PHAs biosynthesis pathways and metabolic pathways to overproduce PHA.
From (Magdouli et al., 2015)... 52
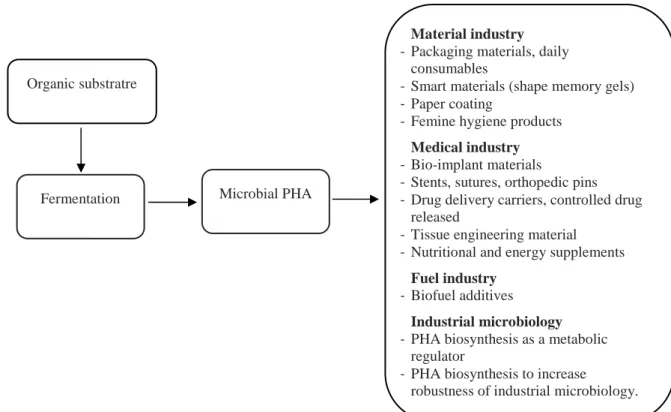
Figure 2-8: Potential applications of PHAs in sector services (adapted from
Możejko-Ciesielska and Kiewisz (2016)). ... 52
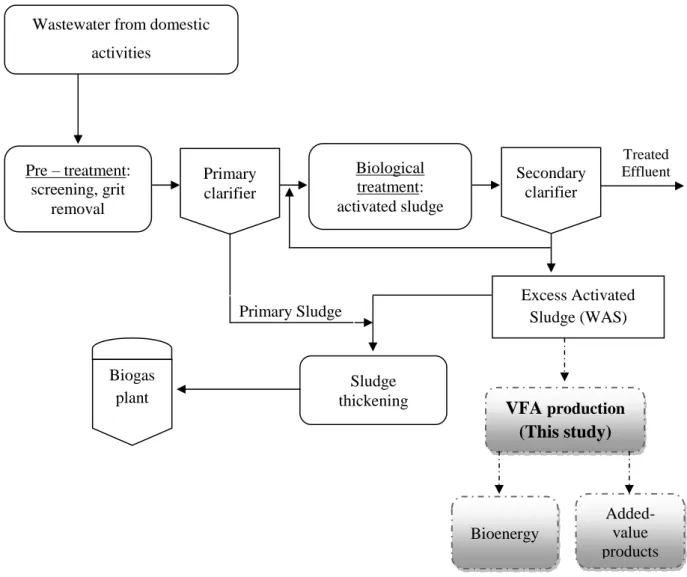
Figure 3-1: Process overview of a wastewater treatment plant, including WAS production.
... 61
Figure 3-2: Schematic representation of the process involved in OFMSW production. .... 62 Figure 3-3: Schematic representation of the process involved in coffee industry and coffee
grounds production and application (adapted from (Mussatto et al. (2011)). ... 64
Figure 3-4: Schematic presentation of tomato industry process and possible TW
biovalorization. ... 65
Figure 3-5: Reactor set-up for batch operation. ... 66 Figure 3-6: Schematic of experimental setup of the anaerobic reactors ... 67 Figure 3-7: Schematic presentation of three experiments in batch reactors. ... 69 Figure 3-8: Schematic diagram of the 3 stage PHA production process using microbial
mixed cultures. ... 71
Figure 3-9: Schematic diagram of lab-scale anaerobic digester (CSTR type). ... 72 Figure 3-10: Variation of OLR and Alk concentration applied in the CSTR reactor during
ix
Figure 3-11: Schematic diagram of lab-scale for selection and enrichment of PHA
accumulation culture in aerobic reactor (SBR type). ... 75
Figure 3-12: Schematic diagram from PHA accumulation assays. ... 77 Figure 4-1: Plot showing the evolution of: a) pH values and b) VFA concentrations during
all mono assays ... 97
Figure 4-2: DA measured for the four substrates: a) DA in percentage with respect to time,
b) maximum DA. ... 98
Figure 4-3: Schematic of organic waste mixture in this study for co-digestion ... 99 Figure 4-4: Plot for the evolution of pH and VFA production during the mono and co‐
digestion assays: ... 103
Figure 4-5: Individual VFA composition; acetic acid, propionic acid and butyric acid from
mono and co-digestion assays: a), b) and c) CG and OFMSW; g), h) and i) WAS and TW. ... 106
Figure 4-6: Evolutions of cumulative biogas and methane production from mono and
co-digestion under experience. ... 109
Figure 5-1: (a) pH variation for co-digestion assays; (b) TCOD and VS removals and DA
for all assays (in percentage). R1: 100 % OFMSW; R2: 75 % OFMSW + 25 % WAS; R3: 50 % OFMSW + 50 % WAS; R4: 25 % OFMSW + 75 % WAS; R5: 100 % WAS. ... 116
Figure 5-2: Cumulative production of VFA, CH4 and hydrolyzed COD for all assays: R1:
100 % OFMSW; R2: 75 % OFMSW + 25 % WAS; R3: 50 % OFMSW + 50 % WAS; R4: 25 % OFMSW + 75 % WAS; R5: 100 % WAS ... 119
Figure 5-3: Plot for determination of hydrolysis rate constant (kH): R1: 100 % OFMSW; R2:
75 % OFMSW + 25 % WAS; R3: 50 % OFMSW + 50 % WAS; R4: 25 % OFMSW + 75 % WAS; R5: 100 % WAS. ... 123
Figure 5-4: Plot for determination of methanogenic rate constants (KM) for all assays: R2:
75% OFMSW + 25% WAS; R3: 50% OFMSW + 50% WAS; R4: 25% OFMSW + 75% WAS; R5: 100% WAS ... 125
Figure 5-5: Simulated of experimental data assays by three models: A: First-order
exponential model; B: Exponential Lag model; C: Exponential curve factor model. ... 127
Figure 5-6: (a) Adjustment of experimental data to the model determined, for methane
x
OFMSW + 75% WAS; R5: 100% WAS; (b) Experimental data and model determined for methane production in R1: 100. ... 130
Figure 5-7: Results of MBPPSA model parameter determined for digesters: R1: 100%
OFMSW; R2: 75% OFMSW + 25% WAS; R3: 50% OFMSW + 50% WAS; R4: 25% OFMSW + 75% and R5: 100% WAS. ... 131
Figure 5-8: Relation between kH (a) and kM (b) and OFMSW percentage in substrate mixture
and their respective linear regressions. ... 133
Figure 6-1: pH profile during the operation time for all assays: (a) TS content of 5%, (b) TS
content of 8 %, (c) TS content of 10 %; error bars represent standard deviations of triplicate determinations. ... 143
Figure 6-2: Soluble COD concentration during time for the conditions under study: (a) TS
content of 5%, (b) TS content of 8 %, (c) TS content of 10 %; error bars represent standard deviations of triplicate determinations. ... 144
Figure 6-3: Solubilized COD profiles during time for the conditions under study: (a) TS
content of 5%, (b) TS content of 8 %, (c) TS content of 10 %; error bars represent standard deviations of triplicate determinations. ... 146
Figure 6-4: Daily variation of TVFA concentration during time for the conditions under
study: (a) TS content of 5%, (b) TS content of 8 %, (c) TS content of 10 %... 148
Figure 6-5: (a) DA and (b) VFA concentration versus alkalinity concentration added in
different assays with 5, 8 and 10 % of TS content and respective equations obtained from the linear adjustment; error bars represent standard deviations of triplicate determinations. ... 149
Figure 6-6: Minimum pH values and VFA composition obtained at maximum VFA
concentration point, testing different conditions of TS content in the reactor and alkalinity concentrations added ... 150
Figure 6-7: Response surface plots and contour plots calculated from batch fermentation of
OFMSW: (a) and (b) total maximum VFA concentration (gCOD L-1); (c) and (d) Degree of acidification (%); (e) and (f) effluent quality in terms of VFA (gCOD g-1COD), versus alkalinity addition (gCaCO3 ... 153 Figure 7-1: Performance of the CSTR reactor processing OFMSW under different OLR and
Alk conditions: (a) pH and Alk evolution; (b) TCOD of the feed, solubilized COD and solubilized degree in the fermented effluent. ... 164
xi
Figure 7-2: Evolutions of individual VFA species and TVFA concentrations, expressed in
mg COD L-1, at different CSTR operational stages... 167
Figure 7-3: Distribution of individual VFA and their percentages to the total VFA (TVFA)
with different OLR and alkalinity applied to the CSTR system... 171
Figure 7-4: Daily biogas and methane productions at different OLR and alkalinity applied
during experimental operation of the CSTR system. ... 172
Figure 7-5: Evolution of CH4 and CO2 (%) in the biogas with different OLR and alkalinity
applied to the CSTR system as a function of time. ... 173
Figure 7-6: Evaluation of TVFA production and Odd-to-Even ratio at different OLR
applied. Error bars indicate standard deviation. ... 174
Figure 7-7: Evaluation of OLR and TVF/Alk ratio to the CSTR system as a function of time.
... 175
Figure 7-8: Comparative between DA, VFA/sCOD in percentage and evaluation of
VFA/Alk ratio according to different OLR applied. ... 175
Figure 8-1: Reactor performance over time (variation of OLR, SSV, COD removal and PHA
content in the biomass for a) SBR1 and SBR2; b) SBR3 ... 185 Figure 8-2: Laboratory-scale experimental results in a cycle performed in SBR culture
enrichment assays (TOC, VFA, TN, PHA and OD); a): SBR1; b) SBR3. The vertical dash
line represents the changeover from the feast phase to the famine phase. ... 187
Figure 8-3: Profiles of TOC (Cmmol L-1) and TN (Nmmol L-1) consumption trend) during the SBR assays, ... 190
Figure 8-4: Microscopy images of the biomass taken from the cultivation reactor of
PHA-accumulating organisms: a) Phase contrast images and b) with Nile-blue fluorescence. . 191
Figure 8-5: PHA profille (%), substrate consumption trend (Cmmol L-1) during the accumulation assays. (A1) Accumulation test with pH control (7.0 – 7.3); (A2) accumulation test without pH control and (A3) accumulation test with pH (8.0). ... 194
Figure 11-1: Calibration curves for VFA quantification: acetic acid (H-Ac); propionic acid
(H-Pr); iso-butiric acid (iH-Bu); n-butiric acid (nH-Bu); iso-valeric acid (iH-Va); n-valeric acid (nH-Va); n-caproic acid (nH-Ca) ... 231
xii
List of abbreviations
AD - Anaerobic digestion AcoD – Anaerobic co-digestion Alk – AlkalinityCG – Coffee grounds CH4 – Methane
C:N – Carbon-nitrogen ratio CO2 – Carbon oxygen
COD – Chemical oxygen demand CSTR – Continues stirred tank reactor DA – degree of acidification
DAF – Dynamic aerobic feed DCP – Dichlorophenols DS – Degree solubilization EC – European Commission EU – European Union
FAS – Ferrous ammonium sulphate F:F – Feast and famine ratio
FW – Food waste H2 – Hydrogen
H-Ac – Acetic acid H-Prop – Propionic acid H-Bu – Butiric acid H-Val – Valeric acid H-Cap – Caprionic acid
HRT – Hydraulic retention time kH – Hydrolysis rate constant
kM – Methanogenic rate constant
MFC – Microbial fuel cell MH – Maize husk
MMC – Mixed microbial culture MPB – Methane producing bacteria MSW – Municipal solid waste
xiii MSWM – Municipal solid waste management
MT – Mesophilic temperature O2 – Oxygen
OD – Oxygen dissolved
OFMSW – Organic fraction of municipal solid waste OW – Organic Waste PCP – Pentachlorophenol PE – Polyethylene PHA – Polyhydroxyalkanoates PHB – Polyhydroxybutyrate PHV – Polyhydroxyvalerate -q
VFA – Specific substrate
q
PHA – Specific PHA production
R2 – Coefficient of Correlation S – Substrate concentration
S0 – Substrate concentration initial
SRT – Solid retention time
STR – Sequencing Batch Reactors SW – Solid waste
t – Time
TCOD- Total chemical oxygen demand TOC- Total organic carbon
TN- Total nitrogen
TKN- Total kjeldhal nitrogen TS – Total Solids
TSS – Total suspended solids TT – Thermophilic temperature TP – total phosphorous
TW – Tomato waste
TVFA – Total volatile fatty acid WAS – Waste activated sludge
WWTP – Wastewater treatment plants VS – Volatile Solids
1
3
1.1 General introduction
The energy crisis and the environmental degradation are currently two of the vital issues for global sustainable development. It is now accepted that consumption of fossil fuels is over 80 % of the total energy consumption and that it contributes not only to climate change and the global warming, but also to a rapid exhaustion of natural energy resources (Mao et al., 2015; Abudi et al., 2016).
In a similar trend, it is observed nowadays a rapid increasing of the amount of waste generated annually, due to an increase of population, a rapid increase on urbanization and a growth of industrialization, constituting one of the most serious problems of contemporary societies (Forster-Carneiro et al., 2008). As result of these growing and development trends, millions of tons of wastes are produced per year worldwide, including food wastes, agricultural residues, or sewage sludge from wastewater treatment processes, which can be considered harmful for the environment, if not effectively treated and efficiently of disposed (Barrantes et al., 2014). The environmental effects of incorrect management of wastes can include surface water pollution and eutrophication, residues accumulation and odor pollution (Nielsen et al., 2009; Beyene et al., 2011), creating several risks to public health.
Therefore, proper waste management is crucial to minimize further environmental degradation and simultaneously foster the transition to a sustainable society. The most common waste management approach is treatment oriented, which mainly focuses on meeting environmental regulations (Lee et al., 2014). This approach omits the potential of using the waste as a feedstock for the production of value added products, reducing the amounts of waste produced and creating value. Then, a more embracing waste management approach is needed, where resources recovery is the focus, allowing a simultaneous minimization of waste and a generation of value added products.
According to Lebiocka and Piotrowicz (2012), other strategies in waste management include the change in the practice of landfilling, taking into account a waste-to-energy approach.For this purpose, several countries worldwide are interested in the search for new and economical process, which can be used to treat biodegradable waste and, simultaneously, reduce the volume of waste generated (Monnet, 2003).
4
The biological treatment (anaerobic and aerobic) is known as one of the most beneficial methods for maximizing the recycling and the recovering of several components present in the waste or wastewater to be treated, and has been demonstrated as the most effective waste management technique for bioconversion and the most cost-effective technology for different high strength biowaste. Several types of wastes were effectively treated and valorized using biological process, as wastewater sludge, organic fraction of municipal solids waste, agricultural residues, food industries residues and other organic wastes. There are multiple characteristics that make this technology applicable to treatment for the most organics solid wastes and wastewaters are well known (Abouelenien et al., 2014; Bacenetti et al., 2015; Gohil and Nakhla, 2006; Hernández et al., 2014; Jabłoński et al., 2015; Jang et al., 2016; Kalyuzhnyi et al., 1997; Khan and Martin, 2016; Lee et al., 2014; Li et al., 2015a; Molino et al., 2013). Currently, there is an increasing number of small-scale digestion plants, which include the development of high rate reactor systems for the treatment of organic waste (Kinyua et al., 2016). On the other hand, there is a growing scientific and commercial interest in developed and under developing countries in using these technologies, in order to improve the treatability as well as the additional recovery of bioproducts (Arroja et al., 2012; Kinyua et al., 2016; Madsen et al., 2011; Mata-Alvarez et al., 2000; Molino et al., 2013; Monnet, 2003).
Among biological treatments, anaerobic digestion (AD) is an economically viable process to treat high-strength organic waste, due to the associated low operational costs, which allows high energy recovery linked to the process (Bonk et al., 2015). Besides contributing to the biological treatment of organic waste, AD is also used to obtain intermediate materials, which can be incorporated into new added-values products. Some of these intermediates are used for biopolymers synthesis like polyhydroxyalkanoates (PHA) (Coats et al., 2011; Elain et al., 2016; Korkakaki et al., 2016) or for energy production such as bioethanol, biohydrogen or biomethane (Singh and Harvey, 2010). In addition, biomass from AD contains primary nutrients (nitrogen, phosphorus, potassium), that have agronomic benefits if used as a soil amendment to improve plant growth and at the same time reduce the environmental impact from agricultural activities (Capela et al., 2008; Zhang et al., 2014).
AD is recognized as a practical technology for the rapid stabilization of organic waste prior to final disposal in landfill (Shao et al., 2013), contributing to the reduction of the organic
5
content, to the minimization of odors and pathogens. This technology is commonly applied to treat waste activated sludge (Metcalf, 2003), or to remove nitrogen compounds from effluents (Ahn, 2006; Jokela et al., 2003), but can be applied to a wide range of substrates. In a previous study, Murthy and Novak (1999) reported that aerobic digestion caused poor decomposition of organic substances and increased biopolymer content. Thus, in recent years, aerobic treatment process has engaged increased attention into this particular aspect and in the simultaneous use of anaerobic and aerobic treatment strategies (Akizuki et al., 2016; Bahar and Ciggin, 2016; Di Maria and Micale, 2015a; Jin et al., 2016; Z. Zhang et al., 2015).
However, several factors can affect the AD process performance and stability (Di Maria and Micale, 2015a, 2015b; Moñino et al., 2016). To overcome the above problems, anaerobic co-digestion (AcoD) has been reported as an optimal solution to the treatment of mixture of various organic wastes (Aǧdaǧ and Sponza, 2007, 2005; Agyeman and Tao, 2014; Capela et al., 2008; Fonoll et al., 2015a).
In this context, various organic wastes have been treated by biological treatments, both anaerobic and aerobic process, in this present work, in order to maximize the VFA production for further use in the PHA and energy production, with a perspective to contribute in the process of waste management and recovery, mainly in developing countries as it is the case of Cabo Verde.
1.2 Aim of the work
The general aim of this work was to investigate the performance of the bioreactors treating various organic wastes from different sources. This thesis reports several studies that were undertaken in order to improve VFA and methane production. For that, food waste and waste activated sludge were used, by either mono-digestion or co-digestion and investigating the maximum organic loading rate to increase the quality of effluents in terms of VFA, for further use in the biodegradable polymer-PHA production.
6
to performs the comparison of mono and co-digestion potential of different organic solid wastes which are the potential substrates and the interaction (synergisms) between substrates was investigated, as well as the stability of the system,
to compare the kinetic constants for hydrolytic and methanogenic steps of anaerobic process for the proposed substrate mixtures, in order to provide a simple basis to obtain a stable digestion process,
to optimize the production of a VFA mixture from organic fraction of municipal solid waste (OFMSW) by hydrolytic/acidogenic fermentation, taking into account the influence of two main operational parameters: the initial addition of external alkalinity and the TS content inside of reactor,
to determine the maximum loading rate for continuous stirred tank reactor (CSTR) treating organic waste in order to increase and optimize the generation effluent rich in VFA, from the point of view of their used as substrate for PHA production, to investigate the potential of OFMSW for PHA production in Sequencing Batch
Reactors (SBR) system in feeding regime dynamics, in order to select mixed cultures for a high PHA storage capacity.
1.3 Structure of the thesis
This thesis is organized in nine chapters, as follows:
Chapter 1 presents a general description and contextualizes the scientific relevance and the global and specific objectives of the thesis.
Chapter 2 includes the literature review about the objectives of the thesis, wastes generation and management, problematic of the production of organic solids wastes in Cape Verde, a brief description of the anaerobic digestion process and some examples of the valorization of anaerobic digestion.
Chapter 3 describes the experimental facilities used in the different experimental tests, the characteristics of the raw materials and the wastes tested, including the different calculations used in the treatment and discussion of results.
7
Chapter 4 describes the comparative study of biochemical acidogenic co-fermentation of different food wastes as co-substrates (coffee grounds, tomato waste, OFMSW) and waste activated sludge was added in this study in order to comparative the biochemical acidogenic co-fermentation in anaerobic co-digestion. The VFA production and the composition of the acids produced from these substrates operated in anaerobic batch reactor were comparatively evaluated, as well as the performed the comparison of mono and co-digestion potential of selected substrates and the interaction (synergisms), stability between substrates was investigated.
Chapter 5focuses on the anaerobic co-fermentation process of simulated OFMSW produced in Cape Verde with waste activated sludge (WAS) at different percentages of each substrate, determining the influence of the substrate mixture in either hydrolyzed COD, VFA concentration or methane production, without pH control during the operation assays. Based on experimental data, kinetics parameter was used in order to compare the kinetic constants for hydrolytic and methanogenic steps of anaerobic process for the proposed substrate mixtures.
Chapter 6 details evaluation of the anaerobic fermentation of OFMSW and the influence of both TS content inside the reactor and alkalinity addition. In this chapter it is described the influence of operational parameters on the process performance and VFA production, using a discontinuous pilot-scale reactor under ambient temperature conditions (25+ 2°C). Response surface methodology was used to explore the relationships between the two predictors (TS content and initial alkalinity added) and the response variables (total VFA concentration, degree of acidification and effluent quality in terms of VFA).
Chapter 7 studies the acidogenic potential of long-term of OFMSW carried out in CSTR reactor in semi - continuous mode. The influence of operational parameters (organic load rate and alkalinity added) in the performance of acidogenic system for the VFA production and composition was monitored in order to achieved the effluent rich in quantity and quality of VFA to be used as a feedstock for the culture selection and PHA batch accumulation. Chapter 8 studies the aerobic processes for the selection of microbial culture under regime "Feast:Famine" (F:F) for a PHA accumulation. Thus, as an organic substrate was used OFMSW fermented effluent from Chapter 7 was using as feedstock for batch PHA accumulation, in order to evaluate the profile on PHA production.
8
Chapter 9 refers to the general discussion, as well as the suggestions for future works particularly in defining suitable waste management operations in order to achieve sustainable solutions.
9
11
2.1 Wastes generation
Human activities always produce waste, and the generation rates increase with the population expansion and the economic development. The trends in intensification of urbanization and improved living standards in cities led to an increase of the amount of solid wastes (SW) and wastewater sludge generated throughout the world (Karak, 2012).
According to the European Council Directive 2008/98/CE, wastes are heterogeneous materials mixtures resulting from human activities and nature. Among the diversity of solid wastes, it can be highlighted the SW which contain a recyclable fraction (as paper), biodegradable organic wastes or organic fraction municipal solid waste (containing fruit and vegetal peels), food wastes, plastic, glass and metals, toxic substances (as paints, pesticides, used batteries or medicines) and hospital wastes. The combination of household and commercial residues is designated as municipal solid waste (Rajkumar et al., 2010). Municipal solid waste (MSW) is one of the most abundant by-products resulting from urban lifestyle with faster growth than the rate of urbanization (Wang and Nie, 2001). The MSW generated in cities around the world exceeds 1.3 billion tons per year. On average the developed countries typically generate 521.95 – 759.2 kg per person per year (kpc) and the developing countries generate 109.5 – 525.6 kpc (Global Waste Management, 2007) with estimated growth for 2015 of 4.3 billion tones.
According to Late and Mule (2013), the amount and the characteristics of MSW vary with geography, social behavior and education. Table 2-1 summarizes the amounts of MSW generated by urban population, for the year 2012 and the estimates for the year 2025 (census estimated data), in seven different regions in the words, considering data from 161 countries (Hannan et al., 2015).
It can be seen from Table 2-1 that, the MSW generation rate per capita is high in the Organization for Economic Co-operation and Development (OECD) countries. The high amount of MSW can be explained by the development level of these countries. However, in the countries designated as “underdeveloped or middle development” (as East Asia and Pacific, South Asia and Africa), the per capita generation rate of MSW is relatively low. Medina (1997) reported that many developed countries are the major sources of MSW due to the high consumption of industrialized products, which results in an increase in the amount of waste generated and this increment could add challenges to waste treatment and disposal.
12
Therefore, MSW management (MSWM) is becoming an emerging problem for the successful planning of efficient waste management systems and environmental sustainability.
OECD - Organization for Economic Co-operation and Development.
MSWM has been reported by several researchers in different countries all over the world (Mohanty et al., 2014; Das and Bhattacharya, 2013; Noorjahan et al., 2012; Jafari et al., 2010; Chatterjee, 2010), and the focus in some key aspects of MSWM, such as recycling, landfilling, incineration and pollutant emissions are illustrated. According to the European Landfill Directive, one of the possibilities in waste management is to change the practice of landfilling at the same time, increasing the alternatives for waste recycling and reusing (Costuleanu et al., 2015; Gaba et al., 2014; Ghinea et al., 2014).
For Vergara and Tchobanoglous (2012), efficient MSWM is one of the most important and challenging issues throughout the world, and wastes recycling can represent a significant opportunity along with major challenges, contributing to renewable natural resources and for a plethora of inexpensive eco-friendly and sustainable materials. Some wastes, such as food waste, sludge from wastewater treatment and agricultural and industrial wastes, can be valuable sources for renewable energy production. Normally, these wastes are referred to as Table 2-1: Urban population and MSW generation rate of different regions of the globe for 2012 and 2025
(adapted from Hannan et al. (2015)).
Name of the region
Number of countries covered 2012 2025 (estimated) Urban population (millions) Urban MSW generation (kg/capita/day) Urban population (millions) MSW generation (kg/capita/day) Latin America and
the Caribbean
33 400 1.09 466 1.56
Europe and Central Asia
19 227 1.12 240 1.48
East Asia and Pacific
17 777 0.95 1,230 1.52
South Asia 7 426 0.45 734 0.77
Africa 42 261 0.65 518 0.85
Middle East and North Africa
16 162 1.07 257 1.43
13
organic solid wastes or organic biodegradable wastes due to high contents of carbohydrates, cellulose, lipids and proteins in their composition, and present moisture contents below 85-90% (Mata-Alvarez et al., 2000). Thus, “The increasing volumes of waste being generated
would not be a problem if waste was viewed as a resource and managed properly” (UNEP,
2001).
2.1.1 Organic solid wastes production
The production of organic solid wastes (OSW) as the organic fraction of municipal solid wastes (OFMSW), agricultural wastes, sewage sludge or other food wastes, is a major problem in almost all cities in the world. OFMSW is considered as the most relevant organic wastes largely produced from MSW. OFMSW is a common name for the heterogeneous mixture of wastes from houses, hospitals and commercial activities such hotels, supermarkets, restaurants, canteens, companies of food production and processing in urban areas (Gupta et al., 2015; Karak, 2012; Mao et al., 2015; Miezah et al., 2015). It consists of different organic and inorganic mixed fractions of food waste, encompassing vegetables, carbohydrates, paper, wood, garden waste and other inert materials. Despite the variability in its composition, the OFMSW has a higher fraction of biodegradable organic matter and high pollution loads (Angelidaki et al., 2003).
According to What a Waste (2012), OFMSW represents about 46 ± 2 % of the world’s total amount or volume of waste generated. Due to a rapid growth of global productivity from food processing industry, every day it is generated a large variety of OSW (Gupta et al., 2015; Khan et al., 2016; Kolekar et al., 2016; Miezah et al., 2015; Troschinetz and Mihelcic, 2009). According to FAOUN (2011), approximately 1/3 of the food cultivated for consumption is transformed in OSW by human activity with an annual production in the world of about 1.3 billion tones. In Portugal the wastes generation tended to increase over the years, being produced almost 4.57x10⁶ ton of MSW in 2013, with a fermentable fraction from 20 to 65 %. The majority of these wastes are deposited in landfills (51 %) and only a small fraction is used for organic valorization (13 %) (INE 2014). With regard to the fast OW growth, the European Parliament (European Parliament, 2015) adopted recently that the separate collection of the organic fraction of wastes will become mandatory in Europe by 2020. In East Asia and in Africa, the production of OFMSW is the highest percentage (62%),
14
compared with the OECD countries, which have the lowest percentage (27 %). Table.2-2 presents the global organic waste generation relatively with the total annual waste mass or volume (in percentage), by income, and compared between current values and values projected for 2025 (What a Waste, 2012).
Owing to the high growth of OSW production (Table 2-2), the management strategies for these wastes have been raising a series of environmental concerns in recent years, due to the large environmental impact of landfills (Khan et al., 2016; Kolekar et al., 2016; Ma and Hipel, 2016; Mao et al., 2015; Troschinetz and Mihelcic, 2009). Nowadays, high amounts of OSW contain high concentration of organic and easily biodegradable matter and low calorific values, so traditional management practices such as landfilling, incineration, composting and animal feed are less satisfactory in terms of environmental sustainability (Zhang and Jahng, 2012).
According to EPA (2013), OFMSW, agricultural residues, waste activated sludge and some industrial wastes have a high potential for biomethane production, thus these wastes, when landfilled, produces greenhouse gases (rich in methane and carbon dioxide), odors and other gases with harmful consequences for climate and human health. With high costs associated with waste disposal, and its negative impact on environment, and with the European Union legislations for the reduction of the landfilling of OW by 75 % until 2020, it is necessary to put forward new strategies for the management and treatment of OSW (Capela et al., 2008). Thus, the treatment of OSW through the use of technologies as anaerobic digestion (AD) or aerobic process present two of the most suitable methods for the valorization of these wastes owing to valuable products, being environmental friendly process with high economic feasibility (Álvarez et al., 2010; Ariunbaatar et al., 2015; Bonk et al., 2015; Dhamodharan et al., 2015; Grimberg et al., 2015; Lee et al., 2014; Molino et al., 2013).
Table 2-2: Global MSW generation and OW produced in % by income level for 2012 and projections for 2025 (adapted from What a Waste (2012)).
Available Data (2012-2013) Projections for 2025 Urban MSW Generation Urban MSW Generation Income Level Total (tonnes/day) OW produced
(%)
Total (tonnes/day) OW produced (%)
Lower Income 204,802 64 584,272 62
Lower Middle Income 1,012,321 59 2,618,804 55
Upper Middle Income 665,586 54 987,039 50
15 2.1.2 Organic wastes produced worldwide
2.1.2.1 Coffee grounds
Coffee is one of the most popular drinks in the world and second largest traded commodity in the world after petroleum and occupies the top of the business ranking in the export of raw materials with an average annual production of 5.9 Mtons (Battista et al., 2016). It is cultivated in tropical areas where the temperature oscillates between 16 and 32 °C, and in altitudes between 500 and 5000 meters above the level of the sea.
In the last century, coffee cultivation has experienced steady growth worldwide. Globally, about 80 countries across the globe are coffee products. Despite the vast production, only ten producing countries account for 70% of world producers. Table 2-3 report the Top 10 of largest coffee producing and exporting countries in the World (data consulted on www.ico.org). Brazil and Vietnam are the highest global producers and exporters of coffee beans worldwide.
Production Exportation
Rank Country Coffee Production (kilograms)
Rank Country Coffee exports (60 kg sacs) 1 Brazil 2,594,100,000 1 Brazil 45,420,000 2 Vietnam 1,650,000,000 2 Vietnam 27,500,000 3 Columbia 810,000,000 3 Columbia 11,600,000 4 Indonesia 739,020,000 4 Indonesia 6,850,000 5 Ethiopia 384,000,000 5 Ethiopia 6,500,000 6 India 349,980,000 6 India 5,005,000 7 Honduras 345,000,000 7 México 4,500,000 8 Uganda 285,300,000 8 Guatemala 4,000,000 9 México 234,000,000 9 Honduras 2,700,000 10 Guatemala 204,000,000 10 Uganda 2,500,000
Coffee exports slightly decrease to 9.13 million bags in 2016-2017 compared with 9.31 million bags in October 2015. Europe, the United States and Japan are the main consumers with annual importation of 61 %, 25 % and 7 % respectively.
According to consolidated data in (http://www.ico.org/trade_statistics.asp), world coffee consumption presented an average annual growth rate of 2.4 % since 2011 to reach approximately 9 million tons in 2014/15. In the year 2015 – 2017, it has estimated 151.3 million of 60 kg bags of coffee. Fig. 2-1 shows the worldwide production and consumption of coffee between the periods 2012/13 - 2015/16.
Table 2-3: The Top 10 coffee producing and exporting countries in 2015/2016 (adapted from: www. ico.org (2016)).
16
Due to the great demand and consumption of this product, large amounts of by products and residues are generated during the entire processing of coffee beans (Li et al., 2015b; Mussatto et al., 2011), being coffee silver skin and coffee grounds the main products from coffee industry. According to Qiao et al. (2013), every year it is produced about 6 million tons of coffee grounds in the coffee beverage industry. Coffee grounds (CG) waste is a mixture of fine particles and high organic matter content, with proteins and hemicelluloses as the main carbon sources. Due to the putrefaction and the toxic characteristic of this waste, the improperly management is becoming an emerging environmental problem, polluting soil, water and air (Abouelenien et al., 2014). Hence, the use and management of coffee grounds waste in large-scale still remains a challenge worldwide, due not only to the generation of earlier gases, but also to their high contents of caffeine, free phenols and tannins, which are known to be toxic agents for many biological processes used for their treatment (Fan et al., 2003). The deposition of this waste in the environment and sanitary landfill are disposal strategies still performed nowadays. To reduce the negative environmental impact, all developed and underdeveloped countries are trying to adapt to this reality by modifying their management and treatment processes in order to maximize the recycling of a wide range of materials, lowering the emission of secondary pollutants and converting the organic matter into valuable products (Solange et al., 2011; Fernández et al., 2013; Vintiloiu et al., 2013). Several studies have confirmed that the toxic materials in CG can be minimized by microbial degradation (Selvamurugan et al., 2010; Shofie et al., 2015). In this point of view, anaerobic
Figure 2-1: World production and consumption of coffee between 2012/13 and 2015/16 (adapted from www. ico.org, 2016).
17
digestion (AD) is an attractive process for GC treatment to maximize recycling, helping the reduction of environmental impact and emissions of secondary pollutants, converting the organic matter present in wastes into valuable products (Fernández et al., 2013; Vintiloiu et al., 2013). The generation of bioproducts by AD such as biogas, has not been fully used so far, due to the main problems associated with inhibition by accumulation of ammonia and VFA during the anaerobic process (Shofie et al., 2015). Despite this, the use of CG for VFA production is limited and there is a need of evaluation of its functional potential.
This study focuses on the evaluation of the feasibility of the CG anaerobic acidification, in mono and co-digestion processes, to evaluate the potential acidification for this waste.
2.1.2.2 Tomato wastes
Tomato (Lycopersicon esculentum L.) is one of the most important crops in the industrialized countries and the second most produced vegetable in the world, next to potato, with an annual production of 171 million tons (Faostat, 2014), being Italy and Spain the main producers. Only in Portugal, about 1.4 million tons of tomato was generated annually. And, significant amounts of tomatoes are consumed either as fresh fruit or as processed product. According with the Word Process Tomato Council (WPTC, 2014), considering about 95 % of world producers of tomatoes, every year more than 35 million tons of tomatoes are somehow processed globally and it usually represents an environmental source of pollution, during the production and processing phases, mainly due to energy and natural resources usage and associated greenhouse gas (GHG) emissions. To González-González et al. (2013), the tomato processing industry generates abundant wastes containing carbohydrates, with an average value of 80 % of total fiber, being insoluble fibers the major component.
To Del Valle Cámara and Torija (2006), tomato waste (TW) from vegetables processing activities generally contains large amounts of nutrients and bioactive compounds, such as sugars, organic acids, pigments, fibers, proteins, oils, antioxidants and vitamins, with a high potential for VFA and biogas production applying anaerobic digestion. Despite that, the most relevant agro-food industrial or processing wastes such as tomato residues and other food processing residues, are often not valorized or in some cases even wasted, or can be used for animal feeding (Bacenetti et al., 2015).