Parasite Interactions to Infer Population History from
Partial Genetic Information
A. Ma´rcia Barbosa1,2*, Guillermo Thode3, Raimundo Real4, Carlos Feliu5, J. Mario Vargas4
1 Ca´tedra ‘Rui Nabeiro’ – Biodiversidade, Centro de Investigac¸a˜o em Biodiversidade e Recursos Gene´ticos (CIBIO), Universidade de E´vora, E´vora, Portugal, 2 Division of Biology, Imperial College London, Ascot, United Kingdom,3 Departamento de Biologı´a Celular y Gene´tica, Universidad de Ma´laga, Ma´laga, Spain, 4 Laboratorio de Biogeografı´a, Diversidad y Conservacio´n, Departamento de Biologı´a Animal, Universidad de Ma´laga, Ma´laga, Spain, 5 Unitat de Parasitologia, Departament de Microbiologia i Parasitologia Sanita`ries, Universitat de Barcelona, Barcelona, Spain
Abstract
Phylogeographic studies, which infer population history and dispersal movements from intra-specific spatial genetic variation, require expensive and time-consuming analyses that are not always feasible, especially in the case of rare or endangered species. On the other hand, comparative phylogeography of species involved in close biotic interactions may show congruent patterns depending on the specificity of the relationship. Consequently, the phylogeography of a parasite that needs two hosts to complete its life cycle should reflect population history traits of both hosts. Population movements evidenced by the parasite’s phylogeography that are not reflected in the phylogeography of one of these hosts may thus be attributed to the other host. Using the wild rabbit (Oryctolagus cuniculus) and a parasitic tapeworm (Taenia pisiformis) as an example, we propose comparing the phylogeography of easily available organisms such as game species and their specific heteroxenous parasites to infer population movements of definitive host/predator species, independently of performing genetic analyses on the latter. This may be an interesting approach for indirectly studying the history of species whose phylogeography is difficult to analyse directly.
Citation: Barbosa AM, Thode G, Real R, Feliu C, Vargas JM (2012) Phylogeographic Triangulation: Using Predator-Prey-Parasite Interactions to Infer Population History from Partial Genetic Information. PLoS ONE 7(11): e50877. doi:10.1371/journal.pone.0050877
Editor: Kelly A. Brayton, Washington State University, United States of America Received June 18, 2012; Accepted October 25, 2012; Published November 28, 2012
Copyright: ß 2012 Barbosa et al. This is an open-access article distributed under the terms of the Creative Commons Attribution License, which permits unrestricted use, distribution, and reproduction in any medium, provided the original author and source are credited.
Funding: AMB was supported by doctoral and post-doctoral fellowships from Fundac¸a˜o para a Cieˆncia e a Tecnologia, Portugal (SFRH/BD/4601/2001 and SFRH/ BPD/40387/2007), co-financed by the European Social Fund. Further financial support was provided by the Spanish Ministerio de Ciencia e Innovacio´n (projects REN2003-02471 and CGL2009-11316/BOS) and Generalitat de Catalun˜a (project 2009SGR 403). The funders had no role in study design, data collection and analysis, decision to publish, or preparation of the manuscript.
Competing Interests: The authors have declared that no competing interests exist. * E-mail: [email protected]
Introduction
Phylogeography examines the geographical distribution of intra-specific genetic lineages to infer historical information such as the location of glacial refuges and subsequent migratory routes. It requires gathering geographically dispersed biological samples and analysing rapidly-evolving genetic markers such as mitochondrial genes [1]. Phylogeographic studies are expensive, time-consuming, and barely practicable for scarce species for which an adequate number of DNA samples is difficult to obtain. Non-invasive methods exist for those cases [2], but they are more expensive and less efficient.
Co-structure analysis has been defined as the comparison of population demographic and/or genetic structures between two or more species, with the aim of elucidating factors that determine that structure in one or more of those species [3]. Comparative phylogeography of ecologically related species can thus provide a valuable insight into the role of historical factors in their observed distribution patterns. The phylogeographies of species linked by a close biotic interaction such as parasitism show a degree of congruence that tends to increase with the obligate character of the parasite [4]. Moreover, as parasites can have a higher molecular evolution rate, the phylogeography of a specific parasite
may work as a ‘‘biological magnifier’’ over the phylogeography of its host, revealing cryptic aspects of the history of its populations [5]. The concordance decreases if the parasite is either not specific or heteroxenous, i.e., uses more than one host species to complete its lifecycle [3,6–8].
Predator-prey interactions may also, by a similar logic, contribute to generating congruence in species’ population histories. Moreover, the phylogeography of a parasite with a prey species as intermediate host and its predator as definitive host should reflect population history traits of both the prey and the predator hosts. If the parasite has no additional hosts and no free dispersing lifecycle phases, any migratory movement indicated by the parasite’s phylogeography that is not reflected in one of the hosts can be attributed to population movements of the other host [3,7,9]. It may thus be possible to use the phylogeography of, for example, a game species and a specific heteroxenous parasite, with several high-quality biological samples easily available from hunters, to infer population history traits of its predators without the need for direct genetic analyses on the latter.
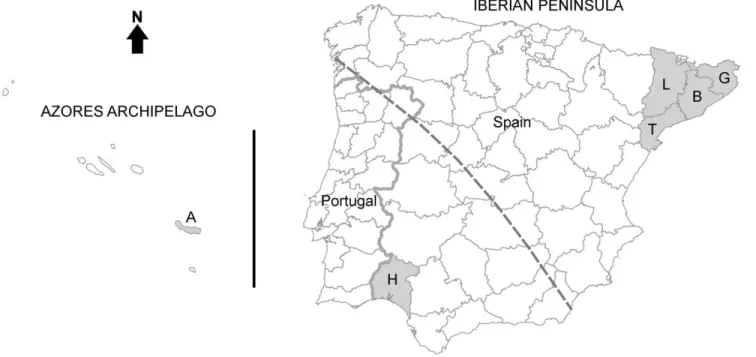
We used, as an exploratory example, samples of a tapeworm (Taenia pisiformis) that were stored in a parasitological collection [10] including individuals from two parts of the Iberian Peninsula (SW Europe) and from the Archipelago of the Azores (N Atlantic
Ocean; Figure 1). This tapeworm uses rabbits (Oryctolagus cuniculus; very rarely hares Lepus spp.) as intermediate hosts and canids and felids as definitive hosts. Several studies on rabbit phylogeography have revealed the existence of two clearly divergent and practically allopatric lineages: one in the south-western half of the Iberian Peninsula and in the Azorean islands, and the other in the remaining rabbit distribution range, including the north-eastern Iberian Peninsula, the remaining European countries, and Australia [11–14] (Figure 1). We analysed phylogeographic traits of the tapeworm and compared them to the known phylogeo-graphy of the rabbit. Our central aim was to demonstrate the use of comparative phylogeography within predator-prey-parasite relationships to uncover dispersal movements of host species whose phylogeography may be difficult to analyze directly. We detected incongruences between the rabbit and the tapeworm’s spatial genetic structures that may be attributed to migratory movements of predators of the rabbit that act as definitive hosts for this parasite.
Materials and Methods
DNA was salt-extracted [15] from 17 T. pisiformis individuals from NE Iberian Peninsula, 9 from SW Iberian Peninsula, and 4 from the Azores (Figure 1). Each individual had been recovered from a separate rabbit host (shot by licensed hunters during the game season) and preserved in 70% ethanol for several years [10]. DNA was thus scarce and degraded, so we chose a relatively small mitochondrial DNA sequence to analyze, the cytochrome oxidase C subunit I (COI), which had already been analysed successfully in other flatworm (Platyhel-minthes: Cestoda) species [16,17].
A first degenerate primer pair (Taenia_COI-F: 59-TGG TCW GGT TTT GTR GGT TTA AG and Taenia_COI-R: 59-GCM ACM ACA AAY CAA GTA TC) flanking 1100 bp was designed from relatively conserved marginal regions of the
COI gene of T. asiatica, T. solium and T. crassiceps, whose mitochondrial DNA sequences were available in GenBank (accession numbers NC 004826, NC 004022, and NC 002547, respectively). These primers achieved amplification in 8 of our T. pisiformis samples, whose sequences were then aligned to design a second nested pair of primers (Tp_COI-F: 59-CTA ATC ACG GTA TAA TCA TG-39 and Tp_COI-R: 59-CCA GTT ACA CCT CCA AAA G-39) flanking 885 bp for amplifying the remaining samples.
Polymerase Chain Reactions (PCR) were carried out on 20-mL volumes containing 0.88 mL dNTPs (10 mmol/L), 0.8 mL each primer (10 mmol/L), 0.2 mL EcoTaq polymerase (5 units/mL), 2 mL DNA sample, 2 mL reaction buffer, and 0.8 to 1.6 mL MgCl2
(successive adjustments in MgCl2concentration were necessary to
amplify all sequences). Reactions were cycled 30 times as follows: 30 sec at 94uC, 30 sec at 50uC, and 30 sec at 72uC, with an initial denaturation of 5 min at 94uC and a final elongation of 7 min at 72uC. A total of 21 samples were amplified successfully (Table 1). PCR products were purified using ExoSAP-IT (GE Healthcare) according to the manufacturer’s instructions, and then sequenced on both strands by an independent laboratory (STAB vida, Oeiras, Portugal) using the PCR primers. Sequences were aligned with BioEdit [18]. A total of 777 bp could be compared among all samples.
We used the ape package [19] in R 2.11 [20] to quantify the genetic dissimilarity [21] between the analysed sequences. The limited sample size prevented obtaining robust clusters for a reliable phylogeographic tree; instead, we carried out multidi-mensional scaling, also known as principal coordinates analysis [22], to obtain a two-dimensional representation of the genetic distances between these sequences. This allowed visual compar-ison with their geographic distances, which were mapped with Quantum GIS 1.8 Lisboa [23].
Figure 1. Geographic distribution of the analysedTaenia pisiformisindividuals. Iberian Peninsula, the Azores archipelago and (shaded in grey) the regions of origin of the analysed sequences. Province initials correspond with those in Table 1. The dashed line is the putative limit between the north-eastern and south-western Iberian rabbit (intermediate host) lineages [13].
Results and Discussion
We found 18 variable positions (18 mutations) forming 11 different haplotypes, most of which in the individuals from the north-eastern Iberian Peninsula (Tables 1 and 2). This may be due to the greater number of individuals analysed in the north-eastern region (Table 2), although it might also be related to a greater abundance in this area of this parasite’s wild hosts, rabbit and red fox (Vulpes vulpes), as suggested by environmental favourability models for these species [24–26]. Such models have shown to correlate with abundance data where these were available [25,26]. Host abundance is often directly related to parasite abundance and, hence, parasite diversity [24,27]. However, haplotype diversity, which accounts for the number of analysed individuals in each region, was only slightly higher in the north-eastern than in the south-western Iberian Peninsula (Table 2). In rabbits, genetic diversity is clearly higher in south-western than in north-eastern Iberian populations [13,14].
Despite some genetic divergence, such as that of individual H3, most tapeworm individuals from south-western Iberia were closely similar to others from north-eastern Iberia (Table 1, Figure 2). These genetic similarities among north-eastern and south-western individuals indicate the absence of a clear geographic differenti-ation among the Iberian populdifferenti-ations of this parasite, despite the clear spatial genetic structure that has been observed its
in-termediate host, the wild rabbit [12–14]. The existence of definitive host species with greater mobility, such as foxes, dogs and cats, may explain the lack of a clear genetic structure in this tapeworm at the analysed scale. Indeed, previous studies on the phylogeography of the red fox indicate relatively uniform, not spatially structured genetic patterns in our study area [28,29]. Additionally, domestic dogs and cats are frequently transported by humans. The presence of four tapeworm individuals in the Azores with the same haplotype as the north-eastern B1 individual (Table 1, Figure 2) also suggests recent transportation by a definitive host (in this case, most probably a domestic animal) rather than by a wild rabbit, as Azorean rabbits are genetically closer to those from western Iberia [14]. Human intervention is known to affect many species’ phylogeographic patterns [8].
The particular results presented here have a mainly exploratory interest, given the reduced sample size, host specificity, geo-graphical coverage and genetic marker set analysed. Our study was based on biological samples that were available in a parasi-tological collection. Biological collections are fundamental re-sources for studies concerning species and biodiversity trends, biological invasions, public health and safety, and many other important areas [30]. Some changes to procedures associated with biological collections could mitigate some of their biases and limitations, making such collections more useful [31]. Host-parasite comparative studies can be a valuable tool for a number of purposes and, ideally, they should be based on directly comparable individuals – that is, on genetic sequences of parasites and hosts sampled simultaneously. It would thus be useful to include in parasitological collections a biological sample of the host individual containing each parasite pool, as a standard procedure to make future co-structure or co-phylogeography analyses more feasible, rigorous and valuable.
Some parasite traits, such as effective population size, genera-tion time, mutagenera-tion rate and level of host specificity, may be important for allowing accurate inferences on host history. Ideally, there should be a match between these traits and the timescales (phylogenetic, phylogeographic and demographic) that are rele-vant to the issues at hand [32]. Different rates of evolution between hosts and parasites can make it difficult to synchronize observed molecular changes in time [8]. In spite of the limitations outlined above, the results presented here unequivocally show that comparative phylogeography of a parasite and its intermediate prey host can provide evidence for population movements of a definitive predator host, independently of genetic analysis of the latter. Our analysed sample clearly documents recent geographic movements of T. pisiformis that were unlikely led by its host rabbits, as rabbit genetic lineages have long been segregated [12–14]. They therefore reflect dispersal or migration movements of the predators/definitive hosts, which have effectively remained more mobile [28,29].
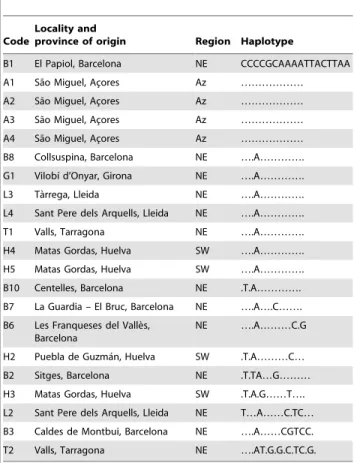
Table 1. Variation in Taenia pisiformis COI sequences.
Code
Locality and
province of origin Region Haplotype
B1 El Papiol, Barcelona NE CCCCGCAAAATTACTTAA A1 Sa˜o Miguel, Ac¸ores Az ……… A2 Sa˜o Miguel, Ac¸ores Az ……… A3 Sa˜o Miguel, Ac¸ores Az ……… A4 Sa˜o Miguel, Ac¸ores Az ……… B8 Collsuspina, Barcelona NE ….A…………. G1 Vilobı´ d’Onyar, Girona NE ….A…………. L3 Ta`rrega, Lleida NE ….A…………. L4 Sant Pere dels Arquells, Lleida NE ….A…………. T1 Valls, Tarragona NE ….A…………. H4 Matas Gordas, Huelva SW ….A…………. H5 Matas Gordas, Huelva SW ….A…………. B10 Centelles, Barcelona NE .T.A…………. B7 La Guardia – El Bruc, Barcelona NE ….A….C……. B6 Les Franqueses del Valle`s,
Barcelona
NE ….A………C.G H2 Puebla de Guzma´n, Huelva SW .T.A………C… B2 Sitges, Barcelona NE .T.TA…G……… H3 Matas Gordas, Huelva SW .T.A.G……T…. L2 Sant Pere dels Arquells, Lleida NE T…A……C.TC… B3 Caldes de Montbui, Barcelona NE ….A……CGTCC. T2 Valls, Tarragona NE ….AT.G.G.C.TC.G. Individuals of T. pisiformis whose COI was sequenced, their geographic origin (province code letters correspond with those in Figure 1) and haplotype. Only variable positions are shown; complete sequences are published in GenBank (accession numbers KC020690 to KC020710). Dots represent consensus with the first sequence in the list. NE: North-Eastern Iberian Peninsula. SW: South-Western Iberian Peninsula; Az: Azores.
doi:10.1371/journal.pone.0050877.t001
Table 2. Genetic diversity of Taenia pisiformis populations.
Individuals Haplotypes Mutations Hd
Northeast 13 9 16 0.87
Southwest 4 3 5 0.83
Azores 4 1 0 0.00
TOTAL 21 11 18 0.85
Number of individuals, haplotypes, and mutations encountered, and haplotype diversity (Hd) for each region studied and for the whole study area. doi:10.1371/journal.pone.0050877.t002
It is well accepted that, if the phylogeographies of a hetero-xenous parasite and one of its hosts do not match, the discrepancy can be explained by the dispersal provided by other hosts in the parasite’s life cycle [3,7,9]. It has also been suggested that, when a host or geographic region is of conservation concern, parasite data can be used to support the boundaries of historically unique regions or managed host populations [33]; and that genetic assignment of parasites may be useful to identify dispersal patterns or feeding grounds for migratory host species [3], among several other interesting applications [8]. What we propose here is that co-structure or co-phylogeography be used as a tool to specifically detect dispersal movements and other population history traits of difficult-to-analyse species that are involved in predator-prey-parasite triangles. Species whose phylogeography is hard to analyse directly include not only rare and endangered species for which adequate DNA samples are difficult to obtain in sufficient quantity, but also common predator species, which often have large home ranges and high dispersal ability, so their spatial genetic structures tend to be less well-defined and their migratory movements more difficult to detect from their own genetic structure [29]. Our results show that information on the genetic structure of their prey and shared parasites can reveal, via triangulated inference, unnoticed population dynamics traits (such
as particular dispersal movements) of predators. This application can be especially valuable given the current conservation crisis, which is compounded in apex predators such as carnivores and raptors.
Acknowledgments
This study was included in A.M.B.’s PhD Thesis, presented in 2006 at the University of Ma´laga. We thank all collaborators in field collection and parasite isolation. Nuno Ferrand, coordinator of the CIBIO-UP, kindly provided the lab and equipment for genetic analyses. Alba Estrada, Ba´rbara Barbosa and Lurdes Cancela helped with sample processing. Jose´ Teixeira helped design the primers and, along with James Harris, Raquel Vasconcelos, Helena Gonc¸alves and many other CIBIO-UP researchers, provided invaluable help in the lab. Diogo Alagador and I´n˜igo Martı´nez-Solano helped with some further technical tasks. Robert Poulin, Donald Quicke and the Purvis lab meeting group at Imperial College London provided insightful comments and discussion.
Author Contributions
Conceived and designed the experiments: AMB GT RR. Performed the experiments: AMB. Analyzed the data: AMB GT RR. Contributed reagents/materials/analysis tools: GT RR CF JMV. Wrote the paper: AMB GT RR. Supervised the project: CF JMV.
References
1. Avise JC (2000) Phylogeography: the history and formation of species. Cambridge MA: Harvard University Press. Available: http://www.hup. harvard.edu/catalog.php?isbn = 9780674666382. Accessed 23 August 2012. 2. Pires AE, Fernandes ML (2003) Last lynxes in Portugal? Molecular approaches
in a pre-extinction scenario. Conservation Genetics 4: 525–532. Available: http://www.springerlink.com/content/n65119662259w500/. Accessed 26 Sep-tember 2012.
3. Criscione CD (2008) Parasite co-structure: broad and local scale approaches. Parasite 15: 439–443.
4. Hafner MS, Demastes JW, Spradling TA, Reed DL (2003) Cophylogeny between pocket gophers and chewing lice. In: Page RDM, editor. Tangled Trees: Phylogeny, Cospeciation, and Coevolution. Chicago: University of Chicago Press. 195–220.
5. Nieberding CM, Morand S, Libois R, Michaux JR (2004) A parasite reveals cryptic phylogeographic history of its host. Proc R Soc Lond, Ser B: Biol Sci 271: 2559–2568. Available: http://www.pubmedcentral.nih.gov/articlerender. fcgi?artid = 1691906&tool = pmcentrez&rendertype = abstract. Accessed 20 July 2012.
6. Price PW (1980) Evolutionary Biology of Parasites. Princeton: Princeton University Press. Available: http://press.princeton.edu/titles/645.html. 7. Keeney DB, King TM, Rowe DL, Poulin R (2009) Contrasting mtDNA
diversity and population structure in a direct-developing marine gastropod and its trematode parasites. Mol Ecol 18: 4591–4603. Available: http://www.ncbi. nlm.nih.gov/pubmed/19845857. Accessed 12 December 2011.
8. Morgan ER, Clare EL, Jefferies R, Stevens JR (2012) Parasite epidemiology in a changing world: can molecular phylogeography help us tell the wood from the trees? Parasitology 24: 1–15. Available: http://www.ncbi.nlm.nih.gov/pubmed/ 22917112. Accessed 22 October 2012.
9. Blasco-Costa I, Waters JM, Poulin R (2012) Swimming against the current: genetic structure, host mobility and the drift paradox in trematode parasites. Mol Ecol 21: 207–217. Available: http://www.ncbi.nlm.nih.gov/pubmed/ 22118193. Accessed 21 February 2012.
10. Blasco S, Torres J, Feliu C, Casanova JC, Miquel J, et al. (1996) The helminthfauna of Oryctolagus cuniculus (Linnaeus, 1758) in the Iberian Peninsula. Faunistic and ecological considerations. Parasite 4: 327–333. 11. Biju-Duval C, Ennafaa H, Dennebouy N, Monnerot M, Mignotte F, et al. (1991)
Mitochondrial DNA evolution in lagomorphs: Origin of systematic
hetero-Figure 2. Multidimensional scaling of the genetic distances between the analysed individuals. Values in the axes are coordinates generated to provide a two-dimensional representation of the genetic dissimilarity between the Taenia pisiformis COI sequences (individual codes correspond with those in Table 1, province initials with Figure 1). The symbols represent their main regions of origin.
plasmy and organization of diversity in European rabbits. J Mol Evol 33: 92– 102. Available: http://www.springerlink.com/content/w54320jm88w3718v/. Accessed 26 September 2012.
12. Branco M, Ferrand N, Monnerot M (2000) Phylogeography of the European rabbit (Oryctolagus cuniculus) in the Iberian Peninsula inferred from RFLP analysis of the cytochrome b gene. Heredity 85: 307–317. Available: http:// www.ncbi.nlm.nih.gov/pubmed/11122408. Accessed 26 September 2012. 13. Branco M, Monnerot M, Ferrand N, Templeton AR (2002) Postglacial dispersal
of the European rabbit (Oryctolagus cuniculus) on the Iberian peninsula reconstructed from nested clade and mismatch analyses of mitochondrial DNA genetic variation. Evolution 56: 792–803. Available: http://www.ncbi.nlm.nih. gov/pubmed/12038537.
14. Ferrand N, Branco M (2007) The evolutionary history of the European rabbit (Oryctolagus cuniculus): Major patterns of population differentiation and geographic expansion inferred from protein polymorphism. In: Weiss SJ, Ferrand N, editors. Phylogeography of Southern European Refugia: Evolution-ary perspectives on the origins and conservation of European biodiversity. Dordrecht, The Netherlands: Springer. 207–235. Available: http://www. springerlink.com/content/j371w1870r52r811/.
15. Miller SA, Dykes DD, Polesky HF (1988) A simple salting out procedure for extracting DNA from human nucleated cells. Nucleic Acids Res 16: 1215. 16. Wickstro¨m LM, Haukisalmi V, Varis S, Hantula J, Fedorov VB, et al. (2003)
Phylogeography of the circumpolar Paranoplocephala arctica species complex (Cestoda: Anoplocephalidae) parasitizing collared lemmings (Dicrostonyx spp.). Mol Ecol 12: 3359–3371. Available: http://www.ncbi.nlm.nih.gov/pubmed/ 14629352. Accessed 30 September 2012.
17. Haukisalmi V, Henttonen H, Wickstro¨m LM, Hantula J, Guba´nyi A (2004) Molecular and morphological evidence for multiple species within Paranoplo-cephala omphalodes (Cestoda, Anoplocephalidae) in Microtus voles (Arvicoli-nae). Zool Scr 33: 277–290.
18. Hall T (1999) BioEdit: a user-friendly biological sequence alignment editor and analysis program for Windows 95/98/NT. Nucleic Acids Symp Series 41: 95– 98. Available: http://www.citeulike.org/user/echinotrix/article/691774. Ac-cessed 26 September 2012.
19. Paradis E, Claude J, Strimmer K (2004) APE: Analyses of Phylogenetics and Evolution in R language. Bioinformatics 20: 289–290. Available: http:// bioinformatics.oxfordjournals.org/content/20/2/289.abstract. Accessed 13 July 2012.
20. R Development Core Team (2011) R: A language and environment for statistical computing. Available: http://www.r-project.org.
21. Kimura M (1980) A simple method for estimating evolutionary rates of base substitutions through comparative studies of nucleotide sequences. J Mol Evol 16: 111–120.
22. Gower JC (1966) Some distance properties of latent root and vector methods used in multivariate analysis. Biometrika 53: 325–328.
23. Quantum GIS Development Team (2012) Quantum GIS Geographic In-formation System. Open Source Geospatial Foundation. Available: http://qgis. osgeo.org.
24. Barbosa AM, Segovia JM, Vargas JM, Torres J, Real R, et al. (2005) Predictors of red fox (Vulpes vulpes) helminth parasite diversity in the Provinces of Spain. Wildl Biol Pract 1: 3–14.
25. Barbosa AM, Real R (2010) Favourable areas for expansion and reintroduction of Iberian lynx accounting for distribution trends and genetic variation of the wild rabbit. Wildl Biol Pract 6: 34–47. Available: http://socpvs.org/journals/ index.php/wbp/article/view/10.2461-wbp.lynx.3. Accessed 31 July 2012. 26. Real R, Barbosa AM, Rodrı´guez A, Garcı´a FJ, Vargas JM, et al. (2009)
Conservation biogeography of ecologically interacting species: the case of the Iberian lynx and the European rabbit. Divers Distrib 15: 390–400. Available: http://blackwell-synergy.com/doi/abs/10.1111/j.1472-4642.2008.00546.x. Accessed 31 July 2012.
27. Arneberg P (2002) Host population density and body mass as determinants of species richness in parasite communities: comparative analyses of directly transmitted nematodes of mammals. Ecography 25: 88–94. Available: http:// www.blackwell-synergy.com/links/doi/10.1034/j.1600-0587.2002.250110.x. Accessed 3 August 2012.
28. Frati F, Hartl GB, Lovari S, Delibes M, Markov G (1998) Quaternary radiation and genetic structure of the red fox Vulpes vulpes in the Mediterranean Basin, as revealed by allozymes and mitochondrial DNA. J Zool 245: 43–51. Available: http://doi.wiley.com/10.1111/j.1469-7998.1998.tb00070.x. Accessed 5 Sep-tember 2012.
29. Teacher AGF, Thomas J a, Barnes I (2011) Modern and ancient red fox (Vulpes vulpes) in Europe show an unusual lack of geographical and temporal structuring, and differing responses within the carnivores to historical climatic change. BMC Evol Biol 11: 214. Available: http://www.pubmedcentral.nih. gov/articlerender.fcgi?artid = 3154186&tool = pmcentrez&rendertype = ab-stract. Accessed 30 July 2012.
30. Suarez AV, Tsutsui ND (2004) The value of museum collections for research and society. BioScience 54: 66. Available: http://www.jstor.org/stable/ 1314587.
31. Pyke GH, Ehrlich PR (2010) Biological collections and ecological/environmen-tal research: a review, some observations and a look to the future. Biol Rev Camb Philos Soc 85: 247–266. Available: http://www.ncbi.nlm.nih.gov/ pubmed/19961469. Accessed 16 October 2012.
32. Nieberding CM, Olivieri I (2007) Parasites: proxies for host genealogy and ecology? Trends Ecol Evol 22: 156–165. Available: http://www.ncbi.nlm.nih. gov/pubmed/17157954. Accessed 20 July 2012.
33. Criscione CD, Blouin MS (2007) Parasite phylogeographical congruence with salmon host evolutionarily significant units: implications for salmon conserva-tion. Mol Ecol 16: 993–1005. Available: http://www.ncbi.nlm.nih.gov/ pubmed/17305856. Accessed 20 July 2012.