Economic Analysis in Health Care Regulation
E
co
n
o
m
ic
A
n
a
ly
si
s
in
H
e
a
lt
h
C
a
re
R
e
g
u
la
ti
o
n
Three essays
Filipa de Aragão Figueiredo Barbosa Pombeiro
Dissertation Submitted for the Degree of Doctor of Philosophy in Public Health
Health Economics Specialty
Lisbon, 2011
Support for this research has been provided by Fundação para a Ciência e Tecnologia, Programa POCTI - Formar e Qualificar - Medida 1.1., grant Praxis XXI/BD/19954/99
Advisors:
Professor João Pereira and Professor Cesaltina Pires
2011 Lisbon
P
o
m
b
e
ir
o
F
il
ip
3
ABSTRACT
It is the purpose of the present thesis to emphasize, through a series of examples, the need and value of appropriate pre-analysis of the impact of health care regulation. Specifically, the thesis presents three papers on the theme of regulation in different aspects of health care provision and financing. The first two consist of economic analyses of the impact of health care regulation and the third comprises the creation of an instrument for supporting economic analysis of health care regulation, namely in the field of evaluation of health care programs.
The first paper develops a model of health plan competition and pricing in order to understand the dynamics of health plan entry and exit in the presence of switching costs and alternative health premium payment systems. We build an explicit model of death spirals, in which profit-maximizing competing health plans find it optimal to adopt a pattern of increasing relative prices culminating in health plan exit. We find the steady-state numerical solution for the price sequence and the plan’s optimal length of life through simulation and do some comparative statics. This allows us to show that using risk adjusted premiums and imposing price floors are effective at reducing death spirals and switching costs, while having employees pay a fixed share of the premium enhances death spirals and increases switching costs.
Price regulation of pharmaceuticals is one of the cost control measures adopted by the Portuguese government, as in many European countries. When such regulation decreases the products’ real price over time, it may create an incentive for product turnover.
Using panel data for the period of 1997 through 2003 on drug packages sold in Portuguese pharmacies, the second paper addresses the question of whether price control policies create an incentive for product withdrawal. Our work builds the product survival literature by accounting for unobservable product characteristics and heterogeneity among consumers when constructing quality, price control and competition indexes. These indexes are then used as covariates in a Cox proportional hazard model. We find that, indeed, price control measures increase the probability of exit, and that such effect is not verified in OTC market where no such price regulation measures exist. We also find quality to have a significant positive impact on product survival.
4 with respect to the previous MSDEMs is that distributions of time to event depend on individuals’ characteristics and past history. Time to event was modeled using parametric survival analysis. Events modeled include: viral suppression, regimen switch due virological failure, regimen switch due to other reasons, resistance development, hospitalization, AIDS events, and death. Disease progression is structured according to therapy lines and the model is parameterized with cohort Portuguese observational data.
5
Acknowledgments
6 I would like to begin by thanking my dissertation supervisors: Professor João Pereira and Professor Cesaltina Pires.
I deeply thank Professor João Pereira for believing in me, for understanding and supporting me when I needed; and I thank him just as much for being demanding and intransigent when required. Most of all, I thank him for his wise guidance in the research path that led to the present thesis.
I deeply thank Professor Cesaltina for teaching me the fun of doing research, and for embedding in me the importance of performing it rigorously. Mostly, I thank her for pushing me forward at the right moments.
In this journey, Professor Pedro Pita Barros and Professor Randall Ellis also had a decisive role. I will always be thankful to Pedro Pita Barros for introducing me to health economics and, most of all, for teaching me to look at problems through the eyes of an economist. I thank Professor Randall Ellis for taking the first steps with me, for guiding me when I most needed, and for watching me at a distance when I started to walk on my own.
I am deeply indebted to Jorge Félix for both his teachings and the working hours he dispensed and I thank Tânia Furtado for believing in the work done and supporting its continuity and improvement.
I would also like to thank Steven Dunn for bugging me enough to make me complete my work. I thank two great friends in their area of expertise: my sister Maria for all the help in
“landscaping” the final document and Samir Noorali for technological support over the years.
I also would like to thank Dr. José Vera, Dr. Ricardo Camacho, Dr. Eugénio Teófilo, Drª Fátima Candoso, Drª Ana Margarida Oliveira, Drª Manuela Vinagre, Drª Andreia Pinto Ferreira, and all the entities that made this project possible, by providing me with the data I needed. In this regard, I specially thank Professor Teresa Paixão, whose good will made it possible for me to access the Communicable Diseases and Epidemiological Surveillance Center database. She was an enthusiast of the project and of the future utilization of the database to develop an epidemiological model.
I thank my boyfriend, Jorge, for bearing with me and for supporting me, even though he neither understood what I was doing nor saw any point in it, besides the fact that it was important for me.
7
Table of Contents
Acknowledgments 5
1. Introduction 15
2. Death Spirals, Switching Costs, and Health Premium Payment Systems 23
2.1. Introduction 26
2.2. Motivating Evidence 30
2.2.1. Premium Patterns 30
2.3. Model 34
2.3.1. Employers 35
2.3.2. Employees 36
2.3.3. Health Plans 37
2.4. Results 38
2.4.1. The Social Optimum 39
2.4.2. Competitive Solution 39
2.4.3. The Optimal Price Sequence 40
2.4.4. The Optimal Vector of First Period Enrollees 43
2.4.5. The Determination of the Optimal Life Span 44
2.4.6. The Steady-State Competitive Equilibrium 45
2.5. Premium Payment Systems 45
2.5.1. Base Case 46
2.5.2. Cost Sharing 47
2.5.3. Risk Adjustment 47
2.5.4. Price Floor 48
2.6. Simulation Results 48
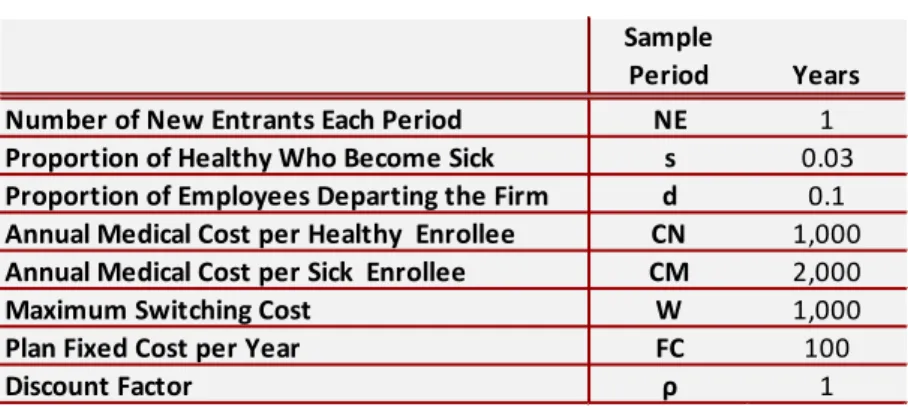
2.6.1. Starting Values 49
2.6.2. Competitive Equilibrium Simulation Results 50
2.6.3. Determination of the optimal life span 50
8 2.6.5. Competitive Equilibrium Simulation Results Under Different Premium Payment Systems 55
2.7. Sensitivity Analysis 60
2.8. Discussion 65
3. Price Regulation and Product Survival in the Portuguese Pharmaceutical Market 69
3.1. Introduction 72
3.2. Literature Review 75
3.3. The Database 78
3.3.1. Product characteristics 83
3.4. Consumer Preferences 85
3.4.1. Estimation framework and results 86
3.5. The Survival Model 93
3.5.1. Explanatory Variables 93
3.5.2. Estimation framework 96
3.6. Results 97
3.7. Discussion 103
4. A Framework for Cost-Effectiveness Analysis of HIV Treatment in Portugal 107
4.1. Introduction 110
4.2. The Human Immunodeficiency Virus (HIV) Infection 112
4.2.1. Natural Evolution of HIV Infection 112
4.2.2. Evolution of HIV Infection with Antiretroviral Therapy 113
4.3. Literature Review 115
4.4. The Microsimulation Discrete Events Model 118
4.5. Model inputs 120
4.5.1. Characteristics at ART Initiation 121
4.5.2. Evolving State Variables 123
4.5.3. Clinical Events 127
9
4.5.5. Costs 159
4.5.6. Summary of sources for model input parameters 166
4.6. Model outputs in the context of an application 167
4.6.1. Input data 168
4.6.2. Microsimulation Results 171
4.6.3. Probabilistic Analysis 176
4.7. Discussion 178
5. Overall conclusion 189
Death Spirals, Switching Costs, and Health Premium Payment Systems 191
Price Regulation and Product Survival in the Portuguese Pharmaceutical Market 192
A Framework for Cost-Effectiveness Analysis of HIV Treatment in Portugal 195
References 199
Appendix I 215
Appendix II 223
Appendix III 227
The databases 227
CHC - Centro Hospitalar de Cascais 227
CD4 and Viral load Over Time – graphical analysis. 229
Regimen switches in the CHC sample versus the Swiss cohort. 230
LVHEM - Laboratório de Virologia do Hospital Egas Moniz 231
CVEDT - Centro de Vigilância Epidemiológica de Doenças Transmissíveis 234
ACSS - Administração Central do Sistema de Saúde 240
INE - Instituto Nacional de Estatística 242
Appendix IV 245
Baseline Individual Characteristics Distributions 245
Fitted distributions 248
Appendix V 251
10
Appendix VI 255
The Mixed Logit Model 255
The WHOQoLHIV and WHOQoL-BREF – a comparison 257
11
Table of Tables
Table 1: Key Descriptive Statistics ... 30
Table 2: Simulation Parameters ... 49
Table 3: Determination of 𝑻𝑻U ... 51
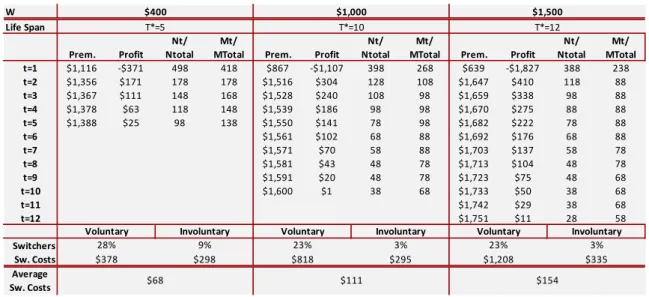
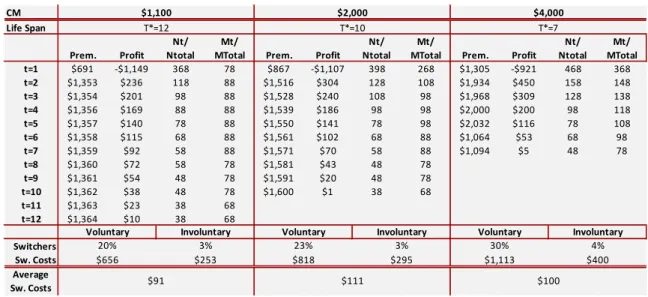
Table 4: Equilibrium Solution under Different Premium Payment Systems ... 54
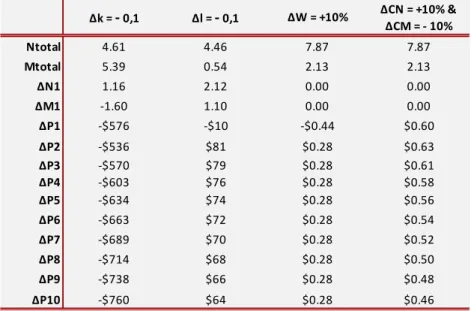
Table 5: Analysis of the Impact of the Parameters on the Equilibrium Values... 55
Table 6: Comparing Switchers, Switching Costs, Premiums and Profits for Different Payment Systems ... 59
Table 7: Equilibrium Results under Different Fixed Costs Values ... 61
Table 8: Equilibrium Results under Different Probabilities of Becoming Sick ... 62
Table 9: Equilibrium Results under Different Probabilities of Leaving the Firm ... 63
Table 10: Equilibrium Results under Different maximum Switching Costs Values ... 64
Table 11: Equilibrium Results under Different Cost of Healthy Enrollees ... 64
Table 12: Equilibrium Results under Different Cost of Sick Enrollees ... 65
Table 13: Product Turnover in the Portuguese Pharmaceutical Market ... 79
Table 14: Entry and Exit, Branded Versus Generics ... 80
Table 15: Entry and Exit, Prescription Versus OTC ... 81
Table 16: Real Price Variation ... 82
Table 17: Competitive Indicators at the ATC3 Level ... 82
Table 18: Descriptive Statistics of Product Characteristics ... 85
Table 19: Summary statistics and OLS coefficients ... 91
Table 20: Descriptive statistics of covariates in the survival parametric analysis ... 98
Table 21: Test of Proportional Hazard Assumption ... 99
Table 22: Stratified Cox Regression Results ... 101
Table 23: Comparison of OTC Versus Prescription Drug Market ... 103
Table 24: Characteristics at ART initiation ... 123
Table 25: Monthly Variation of CD4+ and Viral Load, by Therapy Line ... 124
Table 26: Regression Model for the Probability of Adherence to ART ... 126
Table 27: Estimated Marginal Effects on Median Time to Event Occurrence and Adherence Level. ... 129
Table 28: Attributes and Levels Included in the Questionnaire ... 148
Table 29: Conditional Logit Regression ... 153
Table 30: Mixed Logit Model... 153
12
Table 32: Quality Weights for Quality of Life Index (QoLIndex) ... 156
Table 33: Quality of Life Index (QoLIndex) ... 158
Table 34: Regression Model for Monthly Regimen Cost in Suppressive Therapy ... 161
Table 35: Regression Model for Outpatient Non-ART Cost ... 163
Table 36: Cost of Antiretroviral Therapy Initiation ... 164
Table 37: Cost of Hospitalization and AIDS Event ... 166
Table 38: Summary of Sources for Model Input Parameters... 167
Table 39: Third Agent Recommendations for Initial ART treatment ... 168
Table 40: Initial Characteristics of the 2NRTI+NNRTI and 2NRTI+PI/r Groups ... 169
Table 41: Observed Monthly Costs in the 2NRTI+NNRTI and 2NRTI+PI/r Groups ... 171
Table 42: Clinical outcomes ... 173
Table 43: Costs and Life Years Microsimulation Results ... 175
Table 44: Discrete time Proportional Hazard Model Estimation Results ... 226
Table 45: Descriptive Statistics of CHC Sample ... 228
Table 46: Antiretroviral Drugs Used in the CHC Sample. ... 228
Table 47: Descriptive Statistics of Naive Sample in the CHC Database ... 229
Table 48: Descriptive Statistics of the LVHEM Sample ... 233
Table 49: Descriptive Statistics of the CVEDT Database ... 235
Table 50: Descriptive Statistics of the ACSS Database ... 240
Table 51: Cost of Inpatient Care in the ACSS Database ... 241
Table 52: First Line Resistance Level in the CHC and LVHEM Samples ... 247
Table 53: Regression Model for Time to Viral Suppression ... 251
Table 54: Regression Model for Time to Virological Failure in Line 1 and 2 ... 251
Table 55: Regression Model for Time to Virological Failure in Line 3 ... 252
Table 56: Regression Model for Time to Regimen Switch without Virological Failure ... 252
Table 57: Regression Model for Time to First Resistance ... 253
Table 58: Regression Model for Time to Resistance Class Switch ... 253
Table 59: Regression Model for Time to Hospitalization ... 254
Table 60: Time to Death among HIV Infected Individuals ... 254
Table 61: Average WHOQOL-HIV and WHOQOL-BREF Scores in Portugal ... 257
13
Table of Figures
Figure 1: Boston University Average Single Premiums 1987-2001 ... 31
Figure 2: Boston University Average (95% CI) Single Premiums ... 32
Figure 3: Minnesota Relative Single Premiums 1984-95 ... 33
Figure 4: California Relative Single Premiums 1984-95 ... 34
Figure 5: Timing ... 34
Figure 6: First Period Premium, Number of Healthy and Number of Sick Enrollees for Different Life Spans ... 52
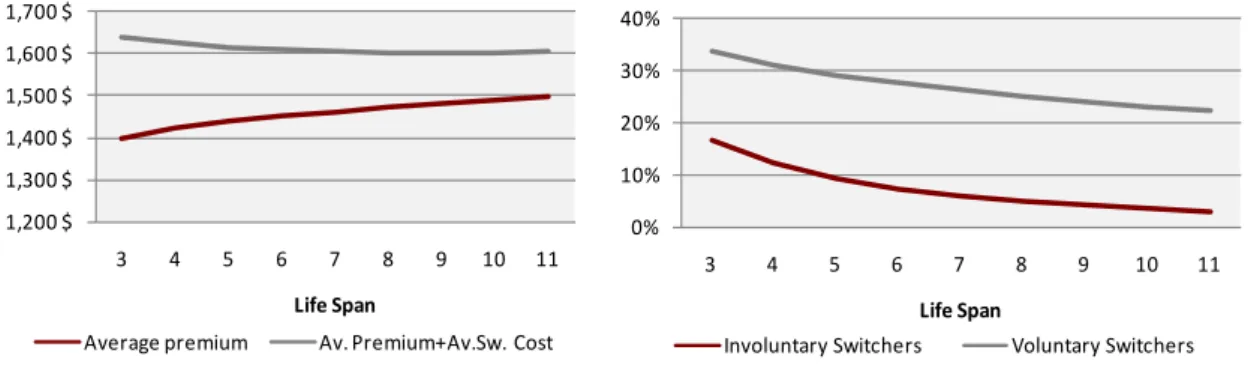
Figure 7: Average Premium, Average Total Cost to Consumers and Percentage of Switchers, for Different Life Spans ... 53
Figure 8: Optimal Price Sequences under Different Payment Systems ... 56
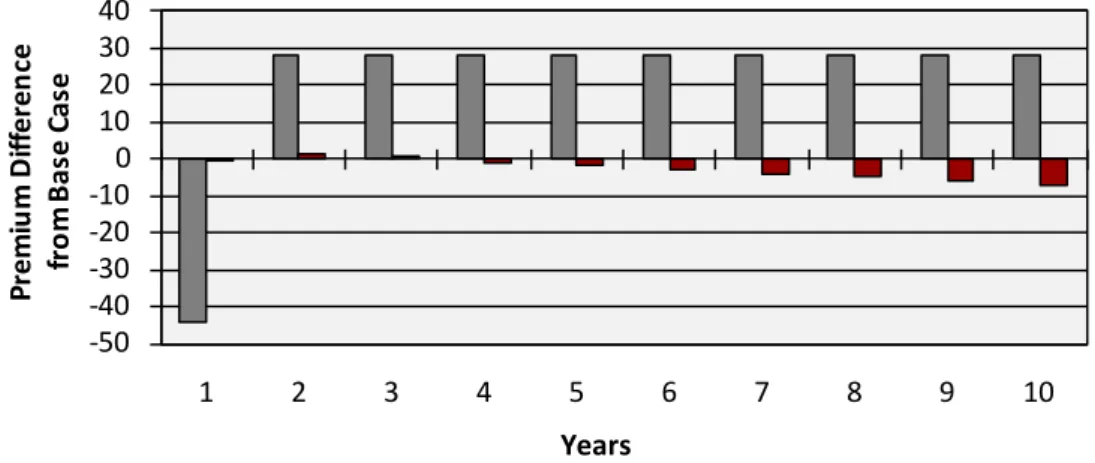
Figure 9: Premium Difference Cost Sharing and Risk Adjustment ... 57
Figure 10: Ratio of Healthy to Sick for Four Premium Payment Systems ... 60
Figure 11: Histogram of normalized residuals from the local linear kernel regression ... 88
Figure 12: After-Taxes Income Distribution, per Equivalent Adult, in the General Population .... 89
Figure 13: Willingness-to-pay for characteristics ... 92
Figure 14: Kaplan-Meier Survival Estimates ... 98
Figure 15: KM Versus Cox Null Model Stratified by ATC3 ... 99
Figure 16: Testing for Goodness of Fit with Cumulative Hazard of Cox-Snell Residuals ... 100
Figure 17: Natural Evolution of HIV Infection (Source: Pantaleo et al. 1993) ... 112
Figure 18: Therapy Line, CD4+ Cell Count and Viral Load over Time ... 114
Figure 19: Discrete Events Microsimulation Model Designed in TreeAge ProSuite® 2009 ... 118
Figure 20: Discrete Event Microsimulation Process ... 120
Figure 21: Kaplan Meier Time Estimates in the NNRTI and PI/r groups, (a) Time to Viral Suppression, (b) Time to Regimen Switch due to Virological, (c) Time to First Increase in Resistance and (d) Time to Regimen Switch without Virological Failure ... 170
Figure 22: Average CD4+ over time in the 2NRTI+NNRTI and 2NRTI+PI/r Groups ... 170
Figure 23: CE Plane of 2NRTI+NNRTI versus 2NRTI+PI/r (Discounted) ... 177
Figure 24: Probabilistic sensitivity analysis: cost-effectiveness acceptability curve for 2NRTI+NNRTI compared with 2NRTI+IPr as initial antiretroviral therapy ... 177
Figure 25: Graphic Analysis of Proportional Hazard Assumption ... 223
Figure 26: Functional Form Graphic Evaluation using Martingale Residuals ... 224
Figure 27: Graphical Analysis of Outliers Using Score Residuals ... 225
14
Figure 29: Average Monthly Variation in Log10VL, by Line. ... 230
Figure 30: K-M Estimate of Time to First Resistance Development in the CHC and LVHEM Samples ... 233
Figure 31: Median Age at Diagnosis in the CVEDT Sample ... 235
Figure 32: Proportion of Diagnosis by Transmission Group ... 236
Figure 33: Kaplan Meier Estimates of Time to Death by Mode of Transmission ... 236
Figure 34: Kaplan Meier Estimate of Time to Death By Year of Diagnosis ... 237
Figure 35: Deaths over Time, by Source of Information ... 237
Figure 36: Distribution of Age of Death due to HIV and all Causes. Source: INE Data ... 238
Figure 37: Kaplan-Meier Survival Curve among HIV Infected Individuals ... 239
Figure 38: Survival in the General Population. Source: INE 2009. ... 239
Figure 39: Age of Death According to HIV Status and Gender ... 242
Figure 40: Average Age of Death among HIV Infected Individuals versus General Population .. 242
Figure 41: Age at ART Initiation ... 245
Figure 42: Distribution of CD4+ and Log10VL at ART Initiation ... 245
Figure 43: Number of PIs, per Therapy Line... 246
Figure 44: Fit Comparison for Log10HIV RNA at rebound ... 248
Figure 45: Fit Comparison for log10HIV RNA at rebound in non-suppressive therapy ... 248
Figure 46: Fit Comparison of Resistance level in Non-suppressive Therapy ... 249
15
1.
Introduction
The field of Health Economics developed as a branch of Economic Analysis due to the specificities of the health sector. These specificities include not only the right to health protection (established in Article 64 of the Portuguese Constitution) but also the presence of multiple market failures deriving from uncertainty, externalities and incomplete information.
The unique and aggravated combination of such specificities has justified public intervention in health. Public Intervention in healthcare systems assumes many roles, namely those of insurance provider, healthcare provider and regulator.
The exact degree of governmental intervention in health care differs between countries. Portugal, like many other European countries, has opted for a National Health Service type system while the United States has traditionally favored a private sector approach.
Regardless of the level of intervention desired by each society, few argue with the regulatory role played by the State in the health sector. As a regulator, the State issues norms and establishes the rules of the game which condition the activities of those in this sector. As a regulator, it is up to the State to create, through adequate public policies, an environment that promotes equity and efficiency.
In order to reach this objective, it is essential that health care policies be analyzed in the light of economic theory, which is where Health Economics plays a predominant role. Therefore, it is the purpose of the present thesis to attest the need and value of appropriate analysis of the impact of health care regulation. It is also important to emphasize that such analysis should be performed in the specific context of its application, since, in terms of social welfare, the outcome of the actions of the regulator will depend on the context in which such regulation is performed.
16 The three articles deal with different health sub-sectors: the health insurance market, the pharmaceutical market and the provision of treatment for HIV infection. The choice of distinct subject matter serves to emphasize the broadness of the theme in question and, thus, highlight the need for a correct pre-analysis of the impact of health care regulation that is not limited to one specific area but must, in fact, be applicable to all problems that regulation tries to minimize.
The themes selected reflect premises of major relevance for health policies. Obviously, many other topics of equal or greater importance exist, but the chosen examples are especially appropriate for the purpose of the thesis. The first two examples evaluate the impact of the same regulatory issue (price regulation) with evidence suggesting opposite effects in terms of the impact on welfare. The first article focuses on an example where price control reduces switching costs while the second provides evidence of increased switching costs due to price control regulation. As such, these two papers demonstrate the need and value of context
specific economic evaluation of health regulation. The third article emerges naturally as a
response to such need by providing an instrument that will precisely contribute to such context specific economic evaluation of health regulation.
The aim of the first paper is to understand the dynamics of health plan entry, exit and pricing in the presence of switching costs and biased selection. Moreover, we aim at understanding how these dynamics are affected by alternative price regulation strategies.
The existing insurance market literature has, generally, modeled equilibrium patterns of adverse selection without trying to model the dynamics of health plan entry and exit, while in the non-health literature, a variety of models examine dynamic pricing strategies with switching costs. Consequently, we build on the existing insurance market literature by developing a new model of health plan competition and pricing, specifically accounting for the dynamics of health plan entry and exit in the presence of switching costs. In order to understand the impact of regulation we simulate the equilibrium under alternative health premium payment systems.
17 only once a year. We find it to be important enough to justify the additional computational requirement resulting from the absence of an explicit terminal condition.
The theoretical model explains the economic rationale behind the insurance provider’s strategy of offering heath plans with extremely aggressive prices in the first years, followed by sharp increases in subsequent years. This strategy leads to eventual market exit, once the prices, despite the switching costs, are no longer competitive.
This phenomenon named “churning” 1
Among our most interesting findings is the possibility that, a first period price floor strategy, can potentially be welfare improving. By reducing competition, the imposition of a price floor, depriving health plans of aggressive entrance, substantially reduces average switching costs plus average premium, and softens death spirals at the same time, as it yields health plans positive intertemporal profits. We also find that in the presence of switching costs, cost sharing is welfare reducing while, on the other hand, risk adjustment yields lower total costs (switching costs plus premium costs) to consumers.
has been widely referred to in the health policy literature [1, 2]. In an attempt to minimize its impact some States, in the United States of America have opted to administratively establish an upper limit to price increases. More often than not, such policy leads the insurance companies to anticipate product removal from the market, thereby generating elevated switching costs to consumers.
While true that, in Portugal, the health sector is mainly financed by public health insurance, given the growing share of employer-provided private health insurance, the analysis to be performed and the conclusions to be drawn in the first article are also of relevance in the national context, as they may guide future regulatory action in that sector.
The topic for the second article arises from the assertion that the phenomenon observed in the Unites States (U.S) health insurance market, where decreasing profits lead to the eventual product exit, could be the origin of the observed significant turnover rate of products in the pharmaceutical market in Portugal.
In the U.S. health care insurance plan market analyzed in the first article, there are no restrictions to the increase of prices upon entry into the market; nonetheless, the rise of costs
1
18 leads to a decrease in profit throughout the life of the product. In the Portuguese pharmaceutical market, once the initial price is set, subsequent price increases are rarely allowed and reductions may be mandated. Posterior price variations are determined by the annual pharmaceutical price revision, announced by the Government. These annual pharmaceutical price revisions set the maximum allowed price increase as a function of the previous year’s inflation rate, and are usually set below the inflation rate, which means that the real price decreases over time as the product ages. Although the decrease in the actual price does not go hand in hand with the decrease in profit throughout the life of a product, reality dictates that the decrease of the actual price can imply that the maximization of profits be obtained through the re-introduction of the product in the market.
Thus, one way to regain control over the price is to replace the existing product by a “renewed version” of the same. Although, the price of the new product will still be set under the general rules, which, in essence, take the average price of that of a similar product from four reference countries, a price negotiation takes place once again. The renewed version may be reflected in something as simple as new packaging.
The aim of the second paper is, therefore, to understand whether price regulation of the Portuguese pharmaceutical market creates an incentive for product turnover. The research question is addressed by empirically evaluating, in a reduced-form model, the determinants of product life-cycle in the pharmaceutical market.
In line with analysis performed in other markets, we construct indices of competition, differentiation, price control and quality which are used as explanatory variables in survival analysis. If, indeed, price regulation does create an incentive for product turnover, a significant coefficient on the price control index is expected.
Methodologically, we build on the existing product survival literature by introducing in this literature methods developed in the Industrial Organization literature. While proxies for unobserved product quality have previously been considered as a determinant of exit, we apply a more flexible non-parametric method to the estimation of the unobservable component then obtain consumer preferences for both observable and unobservable characteristics and use those to build an index of product quality. To our knowledge, the methodology followed had not previously been applied in the product survival literature.
19 environment, we find the proposed methodology, which is considerably more straightforward, to be most adequate as a first approach to examine whether the issue deserves future research.
We find that price control measures do, in fact, influence the decision of product withdrawal and, consequently, have an impact on turnover rates in the pharmaceutical market. While novel product introductions are expected to have a positive welfare impact due to therapeutic improvements, replacement of existing products carries costs to society (switching costs, marketing costs and licensing costs) with little or no benefit to consumers.
The development of the first two articles highlights the importance of context specific economic analysis of regulation in health care. In fact, in the matter of health insurance, examined in the first article, we find price regulation (namely, regulation of entry price in the market) to be potentially welfare improving while, in the pharmaceutical market, considered in the second article, the analysis suggests that price regulation, in its current form, may be welfare reducing.
Considering the need to perform economic analysis on a case-by-case basis, the third article aims to contribute to the process of economic analysis, by creating a support instrument for health care regulation. The instrument consists of a framework of economic evaluation for a broad range of measures aimed at combating a specific disease. Economic evaluation allows for the resources to be given opportunity cost value, thereby contributing to the efficient allocation of resources.
The instrument focuses on the area of Human Immunodeficiency Virus (HIV) infection – one of the priority intervention areas, according to the strategic orientation defined by the government’s National Health Plan for 2004-2010. In line with such strategic orientation, the Health Ministry delegated the National Coordination for HIV/AIDS Infection, of the Office of the High Commissioner for Health, the responsibility to create a National Plan of HIV/AIDS Prevention and Infection Control – 2007-2010. The instrument aims to be a support tool for resource allocation decisions in the context of health strategies defined in that Program or others defined by the government in the HIV/AIDS field.
20
The framework contributes to the existing Portuguese literature, given that no other model,
parameterized with Portuguese cohort data, is available for economic evaluation of a broad range of HIV treatment related decisions. It should be noted that, due to the requirement of economic evaluation studies in applications for drug reimbursement, several economic evaluation models of HIV treatment have, obviously, been developed or at least adapted in Portugal. These models were nevertheless built to compare specific antiretroviral drugs, parameterized with international data taken from the international literature. Since economic evaluation models provided to National Authority of Medicines and Health Products, IP (INFARMED), in the context of reimbursement applications, are not publicly available direct comparison is not possible.
A discrete event microsimulation model is designed to fit the disease progression from start of antiretroviral treatment (ART) to death. The model is parameterized to reflect characteristics of HIV infected individuals at ART initiation in Portugal, as well as the country’s clinical practice. Given the unavailability of a national database complete enough for estimation of all parameters of interest, several databases are used.
The work also contributes to the existing literature, in that the methodology applied, namely, microsimulation discrete events model has not, to our knowledge, been previously applied to cost-effectiveness of HIV treatment. Discrete events simulation (DES) has been applied in a variety of settings. Of particular similarity to our model is the one developed by Barton et al.
[3]- The Birmingham Rheumatoid Arthritis Model (BRAM). We expand on their work by modeling the parameters of the Weibull distributions from which time to event is sampled as a function of patient characteristics and history. Such modeling allows for a better fit to the observed data.
DES is selected for three reasons. First, microsimulation (individual simulation) models have been reported to perform better than a Markov model in isolating long-term implications of small, but important, differences in crucial input data [4, 5]. Second, in DES event occurrences determine time advances so random draws are never performed for patients to remain in the same state.Moreover, they do not limit event occurrences to cycle length2
2
The shorter the cycle, the more computationally demanding the model will become.
21 not modeled in the present framework, the framework was designed to allow for its future integration in an epidemiological model.
Given the fact that the model developed is a framework for analysis, we have a priori no empirical findings to report. Nonetheless, while a model is, by definition, a simplification of reality, its usefulness depends on its ability to reproduce the main aspects under consideration. Overall, the model predicts values close to those observed in the Centro Hospitalar de Cascais (CHC) sample, from which the model was (for the most part) parameterized. Individual parameter values predicted by the model (such as, CD4+ cell count growth, % reaching viral suppression, first line duration, etc.) are also close to those published in the literature, when it is possible to perform such comparisons. It should, however, be noted that validation also requires the ability to reproduce results from different samples and such a step has not yet been performed due to lack of available data.
Even though the model developed is a framework for analysis, we do include an application of the model consisting of a cost-effectiveness analysis of two Nucleoside Reverse Transcriptase Inhibitor (NRTI) plus one Non-nucleoside Reverse Transcriptase Inhibitor (NNRTI) versus two NRTI plus one boosted protease inhibitor (PI/r) as a first line antiretroviral therapy regimen [6] and the results obtained are in line with those obtained by equivalent analysis in other countries [7, 8]. All three analysis reinforce the British HIV Association 2008 [9] recommendations to select NNRTIs as the third agent of choice in treating naïve patients, unless impeditive clinical factors exist.
23
2.
Death Spirals, Switching Costs, and Health Premium Payment
24
Death Spirals, Switching Costs, and Health Premium Payment Systems
Filipa Aragão*
Escola Nacional de Saúde Pública, Universidade Nova de Lisboa
Randall Ellis
+Department of Economics, Boston University
ABSTRACT
This paper develops a model of health plan competition and pricing in order to understand the dynamics of health plan entry and exit, in the presence of switching costs and alternative health premium payment systems. We build an explicit model of death spirals, in which profit-maximizing competing health plans find it optimal to adopt a pattern of increasing relative prices culminating in health plan exit.
We find the steady-state numerical solution for the price sequence and the plan’s optimal length of life through simulation and do some comparative statics. This allows us to show that using risk adjusted premiums and imposing price floors are effective at reducing death spirals and switching costs, while having employees pay a fixed share of the premium enhances death spirals and increases switching costs.
JEL Classification: I18, I11
Keywords: health insurance, switching costs, premiums payment systems, biased selection
*Support for this research has been provided by Fundação para a Ciência e Tecnologia, Programa POCTI - Formar e Qualificar - Medida 1.1., grant Praxis XXI/BD/19954/99
+
Support for this research has been provided by the Agency for HealthCare Research and Quality (AHRQ), grant number R01-HS10620-01A
25
Abbreviations and notation
Abbreviations and notation Description
hat notation Competitor defined value
star notation Optimal values
AP Average premium
ASWC Average switching cost
AVCt Average cost in period t
BU Boston University
CM Annual costs of enrolling a sick person
CN Annual costs of enrolling a healthy person
d Rate at which employees leave the firm per year
FC Annual fixed costs
ft Probability of not switching from a plan aged t
Ft Cumulative probability of not switching from a plan aged t
HPPC Hea l th pl a n pa rti ci pa ti on cons tra i nt
IHS Involuntary healthy switchers
IS Involuntary switchers
ISS Involuntary sick switchers
k (1-s)
l (1-d)
Mt Number of sick individuals
NE New employees
Nt Number of healthy individuals
Pmin Lowest premium charged by any competitor
Pt premium charged by a plan aged t
s Rate at which healthy employees become sick per year
SWt Expected number of people switching out of a t year old plan
T Health plan´s life span
THC Total health costs of the firm's employees
VHS Voluntary healthy switchers
VS Voluntary switchers
VSS Voluntary sick switchers
Vt Cumul a ti ve di s counted profi ts from peri od t onwa rds
w Switching cost
W Maximum switching cost
α Risk adjustment factor
Δ Variation
λ Proportion of premium payed by the employee under cost sharing
ρ Discount factor
Ψ Total number of plans offered by the employer
26
2.1.
Introduction
This paper is inspired in part by the history of health plan entry, exit and pricing in the Boston area. Both Boston University (BU) and Harvard University experienced rapid rates of premium escalation during the 1990's, culminating in numerous health plans being canceled by employers or plan providers. The Harvard University Experience is analyzed in Cutler and Reber [10], while the BU Experience is discussed further below.
We develop a model of health plan competition and pricing in order to understand the dynamics of health plan entry and exit, in the presence of switching costs and alternative health premium payment systems. Switching costs are defined as costs incurred by the enrollee of a health plan if and when he decides to change his health plan. These costs may result, among others, from required paper work, change in health care provider or information gathering. We build an explicit model of death spirals, defined as a pattern of increasing relative prices culminating in health plan exit, in which profit-maximizing competing health plans find it optimal to adopt such a pattern. Plans may be forced to enter such death spirals, because of the introduction of new plans that charge low premiums, thereby attracting the employees with lower switching costs.
In order to focus attention on pricing dynamics and plan switching, we construct a model in which all of the plans are ex ante identical. We fully appreciate that product differentiation is one factor in recent plan entry and exit, among various types of managed care plans. However, we believe that emphasis on these differences clouds the understanding of some of the basic forces driving pricing, entry and exit. Regardless of whether plans are identical or differentiated, entry of new plans creates an important asymmetry, changing the mixture of healthy and sick enrollees in each health plan. Plan entry and exit permits a recurring cycle of pricing, in which the costs of enrollees in existing plans are always increasing. Rather than product differentiation, our focus on identical plans emphasizes this process as a rationale for plan entry.
27 decisions. Keeler, Carter and Newhouse [18] develop a model of consumer choice among differentiated health plans, and use a dynamic process to understand equilibrium enrollments, premiums and social costs, however they do not attempt to model health plan entry and exit. Vistnes, Cooper and Vistnes [19] use a two period game in which health plans first compete to be selected by employers and, if selected, compete to be chosen by consumers, but it does not explore the dynamics of pricing or exit per se. Ellis and Ma [20] consider a related issue by analyzing the impact of employer provided health insurance on job turnover. The authors focus on the firms’ insurance offer decision, while we focus on the health plans’ offer decision.
In the non-health literature, a variety of models examine dynamic pricing strategies with switching costs. Our model shares some features with that of Beggs and Klemperer [21]3, but
their framework focuses on two infinitely lived firms, and does not support death spirals in which plan prices increase as market share shrinks, to the point where a firm decides to exit. Gale and Rosenthal [22] develop a model of firms whose quality is only imperfectly observed4.The model in this paper differs from theirs in that it focus on biased selection5
Switching costs introduce the potential for biased enrollment, if they differ across enrollees and are correlated with health costs [10, 16]. Strombom et al. [23], examine switching among employees of the University of California system during the mid 1990's. They find that, under a fixed contribution scenario, consumers price elasticity ranges from −1.8 to −10 indicating considerable price sensitivity but also a significant heterogeneity among consumers
rather than adverse selection.
6. This
finding, together with the fact that new employees are, on average, much healthier than existing enrollees, lays the basis for potentially severe biased selection7
Grönqvist [24] empirically analyses the biased selection problem, arguing that this can explain the limited empirical evidence for adverse selection in insurance markets in the literature, and presents a model of insurance choice focusing on the decision of whether to purchase
.
3 Beggs andKlemplerer examine the implications of switching costs in an infinite period market in which new consumers arrive each
period that are not yet attached to a seller.
4 In that model firms enter at a high quality and high price. Once they have established themselves to have this high quality and
before exiting, firms switch to low quality, in order to take advantage of the greater profitability of charging high prices with low quality.
5
Biased selection includes both favorable selection (which plans want) and adverse selection (which enrollees want individually).
6 The analysis suggests that the healthiest enrollees may be four times as responsive to price differences as the sickest group of
employees. This difference increases nine fold when they also allow for variation in age and employment tenure. Age and tenure are shown to significantly (and negatively) affect price sensitivity.
7 Mean annual premiums in the Strombom
28 insurance, which is a complement to our analysis. Most recently, Cutler et al. [25] estimate the determinants of health plan switching (adverse selection, adverse retention, aging, demographics and the level of cost-sharing) and incorporate these in a simulation model to predict the long-term dynamics. Their analysis focuses on the determinants of switching between two different types of plans while we abstract from plan differences and focus instead on entry, exit and dynamic pricing behavior.
Several published empirical papers support the idea of death spiral and biased selection in the health insurance market [26-29]. Pauly et al. [30], on the other hand, argue that the phenomenon interpreted as death spiral may instead be an adjustment towards more preferred products which would have occurred even in the absence of adverse selection8. Our
model provides a rational for death spirals even in the presence of identical plans.
Of direct relevance to our theoretical framework is the recently published article by Handle [31] who builds a structural model to empirically investigate consumer switching costs in the context of health insurance markets, accounting for potential adverse selection. The author estimates an average switching cost of $1,570 (75% of the average employee premium).
Fixed costs for health plans prevent plans from continuing to exist with minimal enrollments at very high prices, and are plausible given that certain transaction and administrative costs are independent of the number of plan enrollees. Biased selection and fixed costs are, thus, the driving forces of the health plan death spirals modeled here.
Death spirals are a consequence of how contracts are written between health plan providers and employers, not a characteristic of the plans themselves. Therefore, we model entry and exit of health plans to a given employer, not entry and exit of health plans overall. So, the same health plan can be a new entrant with one employer, while being a long time incumbent with other employers. Glazer and McGuire [32] have documented that health plans in the Boston area routinely charge different premiums for identical plans. Once plans are allowed to price discriminate between different employers, death spirals can occur, even when health plans are profitable.
Our model generates many insights. Plan deaths impose much higher switching costs than voluntary switches, since higher prices induce the lowest switching cost enrollees to switch
8 Their conclusions are drawn from the fact that “implementing a significant risk adjustment had no discernable effect on adverse
29 plans, while plan deaths force those with the highest switching costs to involuntarily change plans. We use the model to simulate how premium cost sharing schemes, risk-adjustment policies and the imposition of price floors, affect entry and exit, as well as health plan pricing and enrollee choice patterns.
Among our most interesting findings is the possibility that a first period price floor strategy can potentially be welfare improving. By reducing competition, the imposition of a price floor deprives health plans of aggressive loss leading entry. A price floor can potentially reduce the sum of switching costs plus premiums and soften death spirals at the same time, as it yields health plans positive intertemporal profits.
We also find that, in the presence of switching costs, cost sharing is welfare reducing, while, in contrast, risk adjustment yields lower total costs (switching costs plus premium costs) to consumers.
While the analysis has been inspired by the dynamics of entry and exit of health plans in the United States, lessons to be learned from this analysis are relevant to other countries, such as Portugal, where the employer-provided private insurance market is growing [33]. A proper health policy environment will minimize phenomena’s such as “churning”9
The remainder of the paper is organized into four sections. In Section
and death spirals observed in countries where health care is extensively financed through private health insurance.
2.2, a motivating example drawing upon empirical results from three markets in the United States is presented. Sections 2.3 and 2.4 describe the analytical model and discuss the attainable analytical results in a model with no closed-form solution. In Section 2.5 the four premium payment systems under consideration are presented in the context of the analytical model. In Section 2.6 we summarize the steady-state equilibrium solutions to our model under different premium payment systems and perform some sensitivity analysis. We conclude the paper with a discussion of the implications and limitations of our model.
9
30
2.2.
Motivating Evidence
Death spirals are not occurring in all employers or in all parts of the United States, but they do appear to be occurring under some contracts, and Boston University seems to be an example of this. Results in Cutler and Reber [10] and Yu, Ellis and Ash [34] suggest that the problems facing Boston University are similar to those experienced by other large employers in Massachusetts.
We present the evolution of total premiums for non-retired single employees at Boston University and compare it to two other markets: Minnesota and California premiums for state employees. A health plan is here defined as any separately, independently named and marketed insurance product for which a separate premium is charged. In many cases, the same insurance company offers multiple health plans.
2.2.1. Premium Patterns
Table 1 presents data on health plan entries (births) and exits (deaths) from the available portfolio of three employer markets (Boston University, Minnesota and California). The table reveals that the three employer markets have very different rates of entry and exit over time. Boston University has had the highest rates of entry and exit. California, despite having the largest number of health plans offered to its state employees, has the lowest rate of exit, and Minnesota lies in between the two.
Table 1: Key Descriptive Statistics
Changes in premium cost sharing occurring in each region during the sample periods are shown on the top of Figure 1 to Figure 4. The figures suggest that those changes may have a significant impact on premiums dispersion and exit rates.
2.2.1.1. Boston University
Boston University has offered fifteen different health plans over the 14 year period from 1987-2001. There were eleven new plans offered, and nine plan deaths. The overall number of plans
Sample Period Years
Plan Births
Plan Deaths
Average Number of Plans
Average Plan Births
per Year
Average Plan Deaths per
Year
Average Percentage of Plans Dying each
Year Boston University 1987-2001 14 11 9 6.10 0.79 0.64 10.5%
Minnesota 1984-1995 12 3 6 8.00 0.25 0.50 6.3%
31 has remained relatively constant at five or six per year, implying a plan death rate of about 10.5 percent per year.
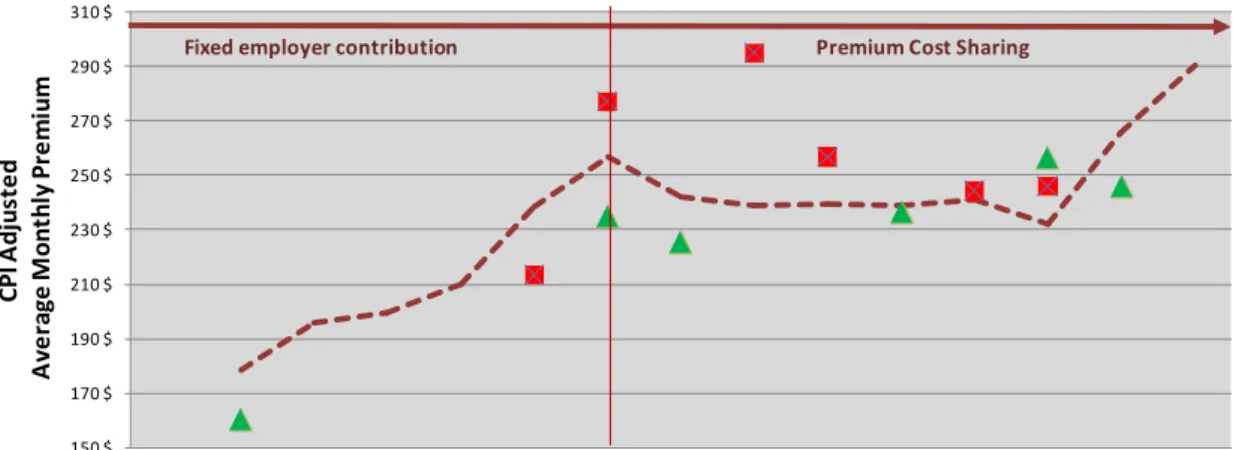
Figure 1 illustrates the three primary features that we model:
1. New plan entrants are generally priced lower than existing plans10 2. Existing plans tend to increase their premiums relative to the average
.
3. Higher premium plans have a greater probability of exiting than low premium plans.
Indeed, except in 199211, average premiums among exiting plans were always above average premium of those not exiting.
Figure 1:Boston University Average Single Premiums 1987-2001
From 1987 to 1992, BU made level premium contributions towards the six health plans that were offered at that time. As a result, employees faced the full cost burden of premium differences across plans. In 1993, BU changed its premium cost sharing so that, instead of level contributions, BU paid a fixed percentage of all premiums12
Figure 2
. Greater dispersion in premiums across plans in their real costs in 2001 is evident in .
10 The only entrance above average occurred in 1999 with a plan which was offered for a single year.
11 This was the average of two plan deaths, only one of which was priced below the average premium of exiting plans.
12
BU also adopted a strategy of freezing enrollment in two health plans, the highest cost FFS plan (BCBS Comprehensive) and the highest cost HMO (Tufts). Except for those already enrolled in these plans, employees are not allowed to join them. BU also decided to enter the market in 2000 with its own plan, the BU Medical Center Preferred HMO. We do not try to model these alternative employer strategies.
150 $ 170 $ 190 $ 210 $ 230 $ 250 $ 270 $ 290 $ 310 $
1987 1988 1989 1990 1991 1992 1993 1994 1995 1996 1997 1998 1999 2000 2001
CP I A d ju st e d A v e ra g e M o n th ly P re mi u m Year
Among existing plans Among entering plans Among exiting plans
32
Figure 2: Boston University Average (95% CI) Single Premiums
2.2.1.2. Minnesota
Minnesota offered twelve different health plans to its state employees over the sample period ranging from 1984 to 1995. There were only three plan births versus six plan deaths13
Figure 3 implying a plan death rate of 6.3 percent per year, and suggesting some evidence of death spirals. However, the most evident plan deaths occurring above the average premium happened in 1989. This was a year after Minnesota changed its health premium payment system, moving from a price floor system to a level premium contribution. Under the new system, employer contributions are calculated as equal to the premium of the lowest cost plan. shows premiums tracking together very closely from 1984-1988, at which point an enormous change in the dispersion of premiums occurred, quickly resulting in three plan deaths (marked with stars). This increased dispersion is plausible due to Minnesota switching from a price floor regimen to a fixed employer contribution.
13
Several of which reflect mergers rather than true plan exits.
150 $ 170 $ 190 $ 210 $ 230 $ 250 $ 270 $ 290 $ 310 $ 330 $ 350 $ C P I A d ju st e d A v er a g e ( 9 5 % C I) P rem iu m s Year Fixed employer
33
Figure 3: Minnesota Relative Single Premiums 1984-95
2.2.1.3. California
California offered 26 plans over the twelve years for which we have premium data. There were six plan births and two plan deaths, implying an annual plan death rate of only 0.7 percent. There is no evidence of death spirals in the California sample: the (only) two plan deaths in our sample period were at average rather than high premiums.
California had consistently maintained a system where the state's contribution is not tied to the lowest cost premium. California premiums contributions are such that employees pay no premium for all but the top four of its twenty three plans in 1996. This fact may be linked to the striking pattern shown in Figure 4: the high number of premiums clustered at the price floor imposed by the state. Moreover, even plans charging premiums higher than the price floor seem to survive for many years rather than dying, as was the case in Massachusetts and Minnesota.
0.5 0.6 0.7 0.8 0.9 1 1.1 1.2 1.3 1.4 1.5
1984 1985 1986 1987 1988 1989 1990 1991 1992 1993 1994 1995
R
el
a
ti
v
e
M
o
n
th
ly P
re
m
iu
m
s
Year
34
Figure 4: California Relative Single Premiums 1984-95
With no intention of generalizing based on only three markets, the premium patterns above suggest four patterns. First, death spirals do occur under some circumstances. Second, proportional premium cost sharing is associated with increases in the dispersion of premiums across plans. Third, maintaining a price floor is associated with lower rates of plan exit and slower rates of premium growth. Fourth, years in which the premium payment system is changed causes enormous turmoil in health plan pricing, entry and exit.
2.3.
Model
Figure 5: Timing
0.6 0.7 0.8 0.9 1 1.1 1.2 1.3 1.4 1.5 1.6
1984 1985 1986 1987 1988 1989 1990 1991 1992 1993 1994 1995
M
o
n
th
ly
A
v
e
ra
g
e
P
re
m
iu
m
Year
Employer chooses premium
payment system
Health plans announce next period premiums
Employer chooses plans to offer
Employees select plans Plan bears cost of
enrollees Enrollees become
35 We model the process as a repeated game, as represented by Figure 5. At time 0, the employer chooses a premium payment system, which is to say a mechanism for making payments to health plans and charging premiums to employees. This decision is made only once, at the beginning of the process, and we model how plans and consumers respond to this premium payment system in equilibrium, without trying to model how agents would react to changes in the premium payment system.
In each period thereafter, there are five stages. During the first stage both potential new entrants and incumbent health plans simultaneously announce their premiums. Existing plans, which are unable to find a price yielding a nonnegative expected sum of future profits, exit.
In the next stage, the employer chooses which plans to offer. Since all plans are, a priori, alike, the main reason for the employer to offer a new plan is to enable price competition among plans and keep premiums down. Among several potential new plans, the employer chooses one new entrant each period - the entrant announcing the lowest first period premium. If several plans offer the same lowest price, the employer randomly picks one.
In the third stage of the process, each employee selects one of the offered health plans. Since all plans offer identical benefits, the only information employees use when choosing plans is the premium they will have to pay for each plan and the switching costs they will have to incur, should they switch plans.
Once employees have made their choice, the next step is for plans to bear the costs of treating health care needs according to health status of their enrollees. The fifth, and final stage, occurs after costs are borne by the plans but before the prices are chosen for the next period. Chance determines whether a healthy consumer becomes sick and/or departs the firm, and whether a sick enrollee leaves the employer. The five stages are repeated in each subsequent period.
2.3.1. Employers
The employers are assumed to care about the sum of total premium payments plus total switching costs. Even though employers do not directly bear the burden of switching costs, they should care about the value of the health plan benefits for their employees. The employer is assumed not to care about switching costs borne by employees leaving the firm.
36 lowest first period premium. This will avoid duplication of fixed costs and induce Bertrand competition among potential new entrants14
2.3.2. Employees
.
There are only two types of employees: low cost (healthy) and high cost (sick). By sick employees, we mean chronically ill patients. All other employees are considered healthy. All new employees are assumed to be healthy and we normalize the number of new employees to be one. Each employee has single coverage: family contracts are not modeled. Healthy employees become sick at the rate 𝑠𝑠 per year, while sick employees never recover to become healthy again. All employees leave the firm at the rate 𝑑𝑑 per year, for reasons that are independent of their health status15
From the consumer's point of view, all plans offer the same coverage and give the consumer the same utility, except that consumers bear a switching cost when changing from their current plan to another. Consequently, when switching, consumers always choose the health plan charging the lowest premium. If, the optimal price sequence is increasing in time, the health plan charging the lowest premium will always be the youngest plan.
. Employees leave the firm for reasons that are exogenous and independent of plan prices and enrollee switching costs.
A more general model would consider heterogeneity in switching costs. For the time being, we assume that each time an employee, either healthy or sick, abandons a health plan and joins a new one, she is assigned a switching cost 𝑤𝑤, where 𝑤𝑤 is uniformly distributed over the interval
[0,𝑊𝑊].
The structure we have just described implies that we can take expectations across all individuals in a health plan and represent the expected number of individuals in the plan at time 𝑡𝑡 as the vector {𝑀𝑀𝑡𝑡,𝑁𝑁𝑡𝑡}, where 𝑁𝑁𝑡𝑡 is the number of healthy individuals, and 𝑀𝑀𝑡𝑡 is the number of sick individuals.
In the absence of any plan switching, the stochastic process can be represented by the following stationary transition matrix A:
14 Not offering a new plan each year is never optimal since existing firms will raise premiums even more. We do not model the
optimal length of a period.
15 We have also experimented with departure rates that are correlated with health states. This added complexity with few new
37
�𝑁𝑁
𝑀𝑀
𝑡𝑡𝑡𝑡
�
=
𝐴𝐴 �𝑁𝑁
𝑡𝑡−1
𝑀𝑀
𝑡𝑡−1�
where, 𝐴𝐴=�(1− 𝑠𝑠)(1− 𝑑𝑑) 0
𝑠𝑠(1− 𝑑𝑑) (1− 𝑑𝑑)�. With plan switching, the transition matrix is no longer
stationary. In this case, the transition matrix, 𝐴𝐴𝑡𝑡, will be:
𝐴𝐴
𝑡𝑡=
𝑓𝑓
𝑡𝑡𝐴𝐴
where 𝑓𝑓𝑡𝑡 is the probability of a current enrollee not switching from a plan of age 𝑡𝑡. The complete specification of this probability depends on the premium payment system as described in Section 2.5. The expected number of people switching out of a 𝑡𝑡year old health plan, 𝑆𝑆𝑊𝑊𝑡𝑡, can be written as:
𝑆𝑆𝑊𝑊
𝑡𝑡= [
𝐴𝐴 − 𝐴𝐴
𝑡𝑡−1]
�𝑁𝑁
𝑀𝑀
𝑡𝑡−1𝑡𝑡−1
�
Equation 1: Expected number of people switching out of a 𝒕𝒕 year old plan
2.3.3. Health Plans
Every year, many potential new entrant health plans compete à lá Bertrand to gain access to the market. Since only one new health plan is selected each year, as long as there are at least two potential new entrants, first period premiums are bid down to the point where the sum of discounted profits over the life span of the plan is exactly zero; unless a first period price floor is set by the employer.
Insurance companies are assumed not to be allowed by employers to charge different premiums to different individuals in the same plan. However, because of switching costs, plans are not perfect substitutes and, consequently, each plan faces a downward sloping demand curve. Insurance companies are thus price setters, and each year they choose the premium to charge all enrollees from a given employer.
Health plan profits in period 𝑡𝑡(∏𝑡𝑡) can be written as:
38 where 𝑃𝑃𝑡𝑡 is the premium charged by a plan aged 𝑡𝑡, 𝐹𝐹𝐶𝐶 are the fixed costs, and 𝐶𝐶𝑁𝑁 and 𝐶𝐶𝑀𝑀 are the one year costs of enrolling a healthy person and a sick person, respectively. Cumulative discounted profits from period 𝑡𝑡 onwards, 𝑉𝑉𝑡𝑡, is given by:
𝑉𝑉
𝑡𝑡=
� 𝜌𝜌
𝑖𝑖−𝑡𝑡∏
𝑖𝑖𝑇𝑇
𝑖𝑖=𝑡𝑡
where 𝜌𝜌 is the discount factor and 𝑇𝑇 is the health plan´s optimally chosen life span.
At any age 𝑡𝑡, if 𝑉𝑉𝑡𝑡 is negative, it is optimal for the plan to exit. Consequently, in order for the plan to remain active at age 𝑡𝑡, the following health plan participation constraint (HPPC) has to be satisfied:
𝐻𝐻𝑃𝑃𝑃𝑃𝐶𝐶
:
𝑉𝑉
𝑡𝑡≥
0
2.4.
Results
Given the structure of our model, with one unit of healthy new employees arriving each period, the proportion 𝑠𝑠of existing healthy employees becoming sick each period, and the proportion 𝑑𝑑 of existing healthy employees departing each period, then the steady-state total number of healthy enrollees, (𝑁𝑁), that will be choosing among all of the health plans is:
𝑁𝑁
=
1
(1
− 𝑘𝑘𝑘𝑘
)
Equation 2: Steady-state total number of healthy enrollees
where, 𝑘𝑘= (1− 𝑠𝑠) and 𝑘𝑘= (1− 𝑑𝑑). Similarly, since a proportion 𝑠𝑠 of healthy workers are becoming sick each period, and a proportion 𝑑𝑑 of both newly sick and previously sick are departing the firm, then the steady-state total number of sick employees in the firm at any moment, (𝑀𝑀), must be:
𝑀𝑀
=
𝑘𝑘
(1
− 𝑘𝑘
)
−
𝑘𝑘𝑘𝑘
(1
− 𝑘𝑘𝑘𝑘
)
39 Regardless of how workers distribute themselves among the total number of plans offered by the employer (Ψ), total health costs (𝑇𝑇𝐻𝐻𝐶𝐶) of the firm's employees will be:
𝑇𝑇𝑇𝑇𝑡𝑡𝑇𝑇𝑘𝑘
𝐻𝐻𝐻𝐻𝑇𝑇𝑘𝑘𝑡𝑡ℎ
𝐶𝐶𝑇𝑇𝑠𝑠𝑡𝑡𝑠𝑠
=
1
(1
− 𝑘𝑘𝑘𝑘
)
∗ 𝐶𝐶
𝑁𝑁+
�
𝑘𝑘
(1
− 𝑘𝑘
)
−
𝑘𝑘𝑘𝑘
(1
− 𝑘𝑘𝑘𝑘
)
� ∗ 𝐶𝐶
𝑀𝑀+
Ψ ∗ 𝐹𝐹𝐶𝐶
2.4.1. The Social Optimum
It is straightforward to see that the social optimum would have only one plan (and hence plan lifetime, 𝑇𝑇 , will be infinite), and it would charge a constant premium over time. Having a constant premium guarantees that consumers have no incentive to switch plans, thereby minimizing switching costs. From Equation 1 it can be seen that switching costs would be zero. Having a single health plan also minimizes the fixed costs. Hence we have:
𝑃𝑃
𝐹𝐹𝐹𝐹=
1
(1
− 𝑘𝑘𝑘𝑘
)
∗ 𝐶𝐶
𝑁𝑁+
� 𝑘𝑘
(1
− 𝑘𝑘
)
−
(1
− 𝑘𝑘𝑘𝑘
𝑘𝑘𝑘𝑘
)
� ∗ 𝐶𝐶
𝑀𝑀+
𝐹𝐹𝐶𝐶
1
1
− 𝑘𝑘
𝑇𝑇
𝐹𝐹𝐹𝐹=
∞
2.4.2. Competitive Solution
As described in Section 2.3.3, in the absence of a price floor, competition among potential entrants reduces overall discounted profits to zero. The first period price (𝑃𝑃₁) is thus implicitly defined by:
(
𝑃𝑃
₁
− 𝐶𝐶
𝑁𝑁)
𝑁𝑁
1+ (
𝑃𝑃
₁
− 𝐶𝐶
𝑀𝑀)
𝑀𝑀
1− 𝐹𝐹𝐶𝐶
+
� 𝜌𝜌
𝑖𝑖−𝑡𝑡𝑇𝑇
𝑡𝑡=2
∏
𝑡𝑡= 0
Equation 4: Lifetime profit
In order to solve Equation 4, three preliminary steps are required: The first is the specification of the optimal sequence of prices and profits, given T; the second is the definition of the vector
40
2.4.3. The Optimal Price Sequence
The optimal price sequence is the solution to the following optimization problem:
We assume Bertrand pricing behavior. Let the hat notation define variables set by competitors
and let P@=>? be the lowest premium charged by any competitor. As shown in Appendix I, the
number of healthy and sick enrollee at any moment in time is a function of the parameters
P@=>?, PA, and P , and of N , M . NA and MA , are independent of any other past premiums charged by the plan.
Claim:
D ≡ = & 2 & 2 1₁ + [1 − 1 ] ₁₁
Equation 5: Number of healthy and sick employees in a given plan at time t
where the cumulative probability of not switching up to period G & ≡ ∏*, * =H IJKI@LMN
H .
Proof: See Appendix I.
This result implies that the premium charged by the health plan at any moment will have no
impact on future profits. Consequently, the optimization problem can be solved one period at a
time through -- 1 problems of the form:
5P IJ (! − "#) + (! − "%) − &"
. . Q Π! , ,A≥ 0≥ 0S
Problem 1: Maximization problem for period t
This problem is solved by assuming that all restrictions are met, and then verifying if they are
indeed met. By solving Problem 1, we obtain the equation defining ! , ∀ = 2, . . , -.
P
1,...,
P
TMax
V
t
s.t. HPPC