Analyses of Shallow Convection over the Amazon Coastal Region
Using Satellite Images, Data Observations and Modeling
Luciana Bassi Marinho Pires
1, Kay Suselj
2, Luciana Rossato
3, João Teixeira
2,4 1World Environmental Conservancy, Atlanta, USA.
2
Jet Propulsion Laboratory, California Institute of Technology, Pasadena, California, USA.
3
Barcelona Expert Center, Polytechnic University of Catalonia, Barcelona, Spain.
4
Joint Institute for Regional Earth System Science and Engineering, University of California,
Los Angeles, USA.
Received: April 14, 2016 – Accepted: July 09, 2017
Abstract
The Belem region of the state of Para, which is located in northern of Brazil and part of the Amazon biome is character-ized by high temperatures, strong convection, unstable air conditions and high humidity favoring the formation of con-vective clouds. Shallow convection and deep convection are among the main components of the local energy balance. Typically a deep convection over the continents is preceded by a shallow convection. An analysis of the performance of the Jet Propulsion Laboratory / National Aeronautics and Space Administration (JPL/NASA) model of shallow convec-tion parameterizaconvec-tion in a framework of the single column model (SCM), in relaconvec-tion to the cluster of cumulus clouds formed in the coastal region of the Amazon forest due to squall lines, is provided. To achieve this purpose enhanced sat-ellite images and infrared images from channels 2 and 4 from the GOES-12 satsat-ellite, and data obtained by the “Cloud processes of tHe main precipitation systems in Brazil: A contribUtion to cloud resolVing modeling and to the GPM (GlobAl Precipitation Measurement)” - CHUVA - campaign, during the month of June of 2011, were used. During that period, clusters of cumulus clouds penetrated the interior of the Amazon, causing heavy rains. Results demonstrated that the parameterizations performed well in the case where only a core of clouds was observed, such as at 18:00h on 14 June. This period of the day also presents the smallest bias and root mean square error (rmse) values for the relative humidity. For the potential temperature the smallest value of bias is at 12:00h on June 7th(0.18 K), the largest one is on June 11th
(-2.32 K) and the rmse ranges from 0.59 to 2.99 K.
Keywords:convective parameterizations, Single Column Model (SCM), CHUVA experiments, infrared images.
Análise da Convecção Rasa sobre a Região Costeira Amazônica Usando
Imagens de Satélite, Dados Observacionais e Modelagem
Resumo
A região de Belém, no estado do Pará, localizada na região norte do Brasil e parte do bioma da Amazônia, é caracterizada por altas temperaturas, forte convecção, alta umidade e instabilidade atmosférica, favorecendo a formação de nuvens convectivas. As convecções rasa e profunda estão entre os componentes principais do balanço de energia local. A convecção profunda sobre os continentes é tipicamente precedida pela convecção rasa. Uma análise do desempenho das parametrizações para convecção rasa do Modelo de Coluna Única (MCU) do Laboratório de Propulsão à Jato / Administração Nacional Aeronáutica e Espacial (sigla em inglês JPL/NASA) em relação ao aglomerado de nuvens cúmulus formado na região costeira da Amazônia devido às linhas de instabilidade foi realizada. Para alcançar este propósito foram usadas imagens classificadas e dos canais infravermelhos 2 e 4 do satélite GOES-12 e dados obtidos na campanha CHUVA “Cloud processes of tHe main precipitation systems in Brazil: A contribUtion to cloud resolVing modeling and to the GPM (GlobAl Precipitation Measurement)”, durante o mês de junho de 2011. Durante aquele período, aglomerados de nuvens cúmulus penetram o interior da Amazônia, causando chuvas fortes. Resultados demonstraram que as parametrizações apresentaram bom desempenho para o caso onde somente um núcleo de nuvens Artigo
foi observado, tal como o ocorrido em 14 de junho às 18:00h. Este período do dia apresentou os menores valores de viés e erro médio quadrático (EMQ) para a umidade relativa do ar. Para a temperatura potencial, o menor valor de viés foi às 12:00h do dia 7 de junho (0,18 K), o maior valor foi em 11 de junho (-2,32 K) e o EMQ variou de 0,59 à 2,99 K. Palavras-chave: parametrizações convectivas, Modelo de Coluna Única (MCU), campanha CHUVA, imagens infravermelhas.
1. Introduction
The largest forest of the world, the Amazon, presents an interesting and very complex system-mixing forests, various topographies, sites of deforestation, cities, and re-gions close and far from the coast, which influence the
cli-matology of the region (Garstanget al., 1990 and 1994;
Grecoet al., 1990 and 1994; Cohenet al., 1995; Fuet al.,
1999; Petersenet al., 2002 and 2006). Grecoet al.(1990)
classify the Amazon convection in three systems: Coast Occurring Systems (COS), Basin Occurring Systems (BOS) and Locally Occurring Systems (LOS) (see Adams
et al., 2009 for a review). This study was focused in the re-gion of Belem which is considered the rainiest rere-gion in the eastern Amazon with precipitation around 2000 mm/year (Figueroa and Nobre, 1990) and is localized approximately 120 km from Atlantic Ocean.
The Belem region in Brazil is characterized by high temperatures, strong convection, unstable atmospheric conditions and high humidity, favoring the formation of convective clouds. High temperatures are associated with high intensity of incident solar radiation, although most of the energy is converted into latent heat of evaporation and the remainder converted into sensible heat. The strong con-vection, instability and high humidity favor the formation of convective clouds, giving rise to a high incidence of rain-fall in the form of showers, mainly in the afternoon, a situa-tion characteristic of a type of continental rain system
(Nechet, 1997), also found by Negriet al.(2000) whose
ar-ticle about the 10 years of climatology of Amazonian rain-fall shows a persistent local rainrain-fall maximum at 18:00 LST on the northern coast of South America, which due to inter-actions between sea-breeze and the squall line formation moved inland at 21:00 LST. According to Nechet (1997) frequent formation of cumulonimbus clouds over Belem also favors the occurrence of various types of thunder-storms, the occurrence of which average around 165 days
annually. Camposet al.(2014) describe the socioeconomic
impacts of the extreme precipitation in Belem and linked years with the El Niño phenomena with the smaller in-stances of precipitation and the La Niña phenomena with
the larger instances (Cutrim et al., 2000; Ribeiro et al.,
2014). Shallow convection (no precipitation, following the traditional division of convective parameterization) and deep convection (precipitation) are among the main
com-ponents of the local energy balance (Adamset al., 2009;
Tavares and Mota, 2012).
The main mechanisms that explain the rainfall pat-terns within the context of global scale are the result of
combining the predominant role of the Intertropical Con-vergence Zone (ITCZ), which is characterized by weak winds and intense rainfall (Vianello and Alves, 1991; Mou-ra and Vitorino, 2012) resulting from the convergence of the trade winds from the northeast and southeast, the sea breezes, the penetration of frontal systems from the south of the continent and the vapor source represented by the
vege-tation of the region. In 2015, Ferreira et al. (2015)
em-ployed Empirical Orthogonal Functions (EOF) to study the ocean atmosphere patterns over the Atlantic Ocean to iden-tify the impacts of the ITCZ on the spatial distribution of rainfall in the eastern Amazon, the ITCZ again was con-firmed as the main rainfall producing system in that region, while Gille and Da Mota (2014) in their thermodynamic study determined the ITCZ as the source of dynamic forc-ing in the rainy season and, in the dry season, the squall line is the source of dynamic forcing. Within the more local context, it can be said that rainfall in Belem is the result of the following scenarios (Vianello and Alves, 1991): i) December to May (Tavares and Mota, 2012; Figueroa
and Nobre, 1990), rainiest season, rainfall is caused by the ITCZ and by the effects of mesoscale such as the squall lines formed in the Atlantic coast of Guyana and Para which propagate westward as a line of cumu-lonimbus clouds. These lines originate in association with the sea breezes and form in the afternoon. ii) from June to August, during the end of the rainy season,
the rain being caused by local effects, such as land and sea breezes and by easterly waves encountering cur-rents of trade winds, usually from the southeast. These waves are phenomena that form in the field of atmo-spheric pressure over the trade winds in the tropical zone of the globe, moving from east to west.
Accord-ing to Garstanget al.(1994) and Cohenet al.(1995)
the end of the wet season, in June, also present the maximum squall line frequency. In the preliminary analyses of the CHUVA project presented in Machado
et al.(2014), an interesting multi-scale nature feature of the squall lines was noted. Successively smaller scale propagating rainfall cell lines were noted
sur-rounded by the large cloud deck. Cohenet al.(1995)
described the squall lines formed along the coast and sea breeze front, propagating inland over the
Amazo-nian rainforest. In addition, Machadoet al.(2014)
no-ticed several of the squall lines initiated at the semi-arid region of the east of Belem and along the bound-ary of the rainforest.
An simplified definition of Belem’s season is
pro-posed by Figueroa and Nobre (1990), Marengoet al.
(2001), and De Souza and Ambrizzi (2002) who de-fine Belem’s seasons as rainy (December to May) and less rainy (June to November). According to Marengo and Hastenrath (1993) large-scale climate phenomena such as the Southern Oscillation and the Inter-hemispheric Thermal Gradient also cause variability in the duration and intensity of the rainy season in the Amazon. A review describing the systems that act on the South American continent including the more rele-vant atmospheric systems responsible for the rainfall
in the Amazon region can be found at Cohen et al.
(2009).
For decades, relating the local nature of convection and its interaction with the atmosphere on a large scale has been one of the main challenges of the assessment of
tropi-cal meteorology of the Amazon region (Adams et al.,
2009). Although the centers of Brazilian meteorology show generally good accuracy in predicting the weather through the use of Atmospheric General Circulation Models (AGCMs) or Regional Forecast Models (see Chou and
Nobre (2015) and also Nobreet al.(2013) for the complete
evaluation of these models) they still experience some dif-ficulty in prediction in the Amazon, considered a peculiar region, with complex interactions and various convective regimes where those models do not have an accurate para-meterization to represent the atmospheric mechanisms that
cause precipitation over that region (Moraeset al., 2013;
Bechtoldet al., 2004). Convection parameterization relates
unresolved convective properties and its associated
trans-port to the resolved large scale. Linet al.(2000), Yang and
Slingo (2001), Cavalcantiet al.(2002), and Adamset al.
(2009 and 2015), call attention to the problem of the con-vective parameterizations (see Kain (2004), Arakawa (2004) and Lopez (2007) for a review of convective para-meterizations) used in large-scale models and the difficul-ties in simulating the effects of convective processes in all tropical regions, particularly in representing the diurnal cy-cle.
Despite shallow cumulus clouds receiving less
atten-tion in numerical models (Souzaet al., 2009), they play an
important role in maintaining the structure of the earth-atmosphere system, resulting in various mechanisms of retro-feed as found in Stull (1985). Typically a deep vection over the continents is preceded by a shallow con-vection. Shallow convection and boundary layer processes precondition the atmosphere for a deep convection. This transition is a key element for an accurate representation of the diurnal cycle of precipitation (Khairoutdinov and
Ran-dall, 2003; Grabowskiet al., 2006 and Souzaet al., 2009).
The absence of interaction processes between shallow con-vection and radiation causes the surface energy balance of
the surface to be overestimated in models (Adamset al.,
2009).
Souzaet al.(2009) studying the effect of shallow
con-vection in the diurnal cycle of the surface energy balance of the Amazon, implemented the BRAMS (Brazilian develop-ments on the Regional Atmospheric Modeling System) and showed a good agreement between the interaction of shal-low convection and radiation at noon and early afternoon and a qualitative deficiency of the model to represent these flows during the morning portion of the diurnal cycle.
Lopeset al.(2012) used the BRAMS model to investigate
the relationship between soil moisture and cloud cover in the shallow cumulus energy balance of the Amazon, find-ing interactions among shallow convection and radiation.
Chagnonet al.(2004) reported a significant climatic shift in
shallow cloudiness patterns associated with deforestation in the Amazon in 2004, using shallow cumulus cloud maps derived from geostationary satellite imager data, obtained from GOES-8.
With the foregoing background, the primary goal of this article is to analyze the performance of the Jet Propul-sion Laboratory / NASA (JPL/NASA) model of shallow convection parameterization in the framework of the single
column model (SCM) (Suselj et al., 2012; 2013) for the
Amazon coastal region and, as a secondary objective, the generation of the profiles by the SCM of turbulent fluxes in order to increase the formal literature data available on the Amazon coastal region. This will be done after validation between the observational data and the parameterizations, and several steps will be necessary:
i) Due to the known complexity of simulation of the Ama-zon region, we started from a synoptic analysis of clas-sification of images obtained from GOES-12 satellite, which provided the essential information to select the days which were more significant for the study be-cause of the presence of shallow cumulus clouds; ii) Study and analysis of the observational data available
from the “Cloud processes of tHe main precipitation systems in Brazil: A contribUtion to cloud resolVing modeling and to the GPM (GlobAl Precipitation Mea-surement)” - CHUVA - campaign in the region of Belem, Brazil, that would match with selected days from the satellite images and that would fit the exigen-cies for initial conditions for the SCM model; iii) Implementation of the SCM and feed with the CHUVA
campaign data for the selected days.
The next topic will detail the methodology used as well as the region of study.
2. Material and Methods
The methodology is composed of four parts: the study region, satellite images, observational data, and model de-scription.
2.1. The study region
area of about 1,059.458 km2, a population of 1,393,399 in
2010, and an estimated population in 2016 of 1,446,042 in-habitants (the most densely populated region of the north
part of Brazil 1,315.26 inh/km2) (IBGE, 2010), with 26% of
the area of the Brazilian Amazon and having 49% of its nat-ural attractions, according to the Organization of American States (Organização dos Estados Americanos - OEA). Fig-ure 1 shows a demarcation of Amazon and the location of the city of Belem.
The Belem region is situated on the banks of Guajará Bay, at the confluence with the Rio Guamá, approximately
120 km from Atlantic Ocean, with an area of 719 km2, and
an average elevation of 12 m. Its main physiographic char-acteristic is numerous small bodies of water, known region-ally as holes and creeks, which associated with low latitude, influence the region to a hot and humid climatic
environ-ment (Bastoset al., 2002).
2.2. Satellite data
For this study data were used from GOES-12 satellite available at the Satellite Division and Environmental Sys-tems (Divisão de Satélites e Sistemas Ambientais - DSA) from the Center for Weather Forecasting and Climate Studies (Centro de Previsão do Tempo e Estudos Climáticos -CPTEC) at the National Institute for Space Research (Ins-tituto Nacional de Pesquisas Espaciais - INPE) of Brazil. The Geostationary Operational Environmental Satellite
(GOES) is positioned over the Equator at a height of 35,800 km. The objective of GOES is to monitor the severe weather conditions such as hurricanes and storms. The GOES-12 is at 60° of west longitude and it is dedicated to the monitoring of South America and adjacent oceans pro-viding images every 15 min. For the enhancement of the scenes during the daytime, the factorial analysis shows that of 10 data sets obtained from the five channels of the GOES satellite (reflectance in channel 1 and temperature of brightness in the other channels, plus their textures), only four of them (those associated to channels 1 and 4) provide non-redundant minimal information about a given pixel (Ceballos e Bottino, 1998).
A method was developed to enhance targets on GOES-8 images, based on using three variables: reflec-tance (channel 1), temperature of brightness (channel 4), and their textures (local variance). The principle of this method is to classify each pixel according with the smallest Euclidean distance to a set of reference decentroides in a multidimensional space. The method is iterative, so that the centroids are defined by successive processes of
classifica-tion until a stability criterion is reached (Bottino et al.,
2004). Based on this method, the enhanced infrared satel-lite images of clouds used in this article were obtained from the GOES-12 satellite.
The images derived from the products of cloud image enhancement from CPTEC/INPE were used to analyze the
period of June 07th, 10th, 11th, 14th, and 15thof 2011
corre-sponding to the same period of the CHUVA campaign in Belem. The enhanced images from the GOES-12 satellite at 12:00 UTC showing the cloud cover over Brazil were ana-lyzed for the days and times when the presence of shallow cumulus clouds was significant. Moreover, GOES-12 Sat-ellite images in the infrared channels 2 and 4 from Brazil and the Para state were used for analysis of the active sys-tems for the same period in June in the local hours of 00:00, 06:00, 12:00 and 18:00.
2.3. Observational data
The data used to evaluate the SCM are obtained from the CHUVA project. The CHUVA project was created to describe the cloud processes of the main precipitating sys-tem in Brazil and give support to the GPM constellation program which launched the GPM Core Observatory on
February 27th, 2014 at 1:37 pm EST from launch pad 1 of
the Space Center of Tanegashima, Japan (GPM, 2014). This project is carrying out field experiments at seven sites to investigate the different precipitation patterns in Brazil. More details about the CHUVA project can be found at Machado (2014). Experiments conducted around the city of Belem were chosen for this paper. The CHUVA campaign was conducted in June 2011 representing the end of the wet season period. The measurements started on June
1thand were completed on June 30th. This region is
charac-terized by formation of squall lines in the coastal part of the
continent causing large clusters of cumulonimbus clouds. According to the information available at CHUVA project webpage (CHUVA, 2011), these clusters of cumulus clouds penetrate the interior of the Amazon, causing heavy rains during that time of year. These rains, though critical to the climate of the Amazon rainforest, cause recurrent seri-ous flood damage to the towns and cities in the region. Therefore it is useful for the General Circulations Model (GCM) be enhanced to realistically predict these types of events by improved accuracy of the parameterizations.
2.3.1. Equipment description
Micro radar data was used in the analysis of height of clouds. Surface flux data was utilized for the analysis of temperature, winds (3D), humidity, momentum, sensible and latent heat fluxes and time series of the fluxes; the radiossonde data provided the wind profiles, temperature and humidity for analysis of the atmospheric boundary layer profiles.
The micro radar and the surface data were measured at the site of Outeiros (01°16’03” S - 48°25’56” W). The ra-diosondes were released from the airport (1°22’45” S, 48°28’35” W) which is located at 21 km distance from the Outeiros site. Figure 2 shows the infrastructure in both sites.
The equipment has the following configuration:
• Micro Rain Radar - Vertical pointing micro Doppler rain
radar Keplel - 24.1 GHz, Instantaneous or average
drop-let spectral profile, reflectivity and rain rate, vertical pointing, every 10 seconds.
• Surface station - 3D Sonic Anemometer (Scientific) and
Li-COR IRGA from Campbell with a sample tax of 20 Hz and the flux were calculated online.
• Radiosondes - Digicora III (RS 92) from Vaisala.
2.4. Model description
To understand how well the shallow convection may be represented by the atmospheric models, the idealized single-column-model (SCM) has been used to simulate the development of the boundary layer for selected days. The
SCM used here is fully described in Suseljet al. (2012,
2013). In short, the SCM solves the equations for moist
conserved variables (liquid water potential temperature,qL;
and total water mixing ratioqt) and horizontal wind
compo-nents (uandv). Atmospheric turbulence and convection are
assumed to be subgrid scale processes and are parame-terized with a unified eddy-diffusivity/mass-flux (EDMF) scheme. In the EDMF framework, turbulent fluxes are writ-ten as a sum of eddy-diffusivity contribution and a mass-flux contribution as:
¢ ¢ = - +
-=
å
w K
z a w
m i i i
i I
j ¶j
¶ 1 (j j)
(1)
wherej={ , , , }qL q u vt .
The first term of the Eq. (1) denotes the eddy-diffu-sivity part of the turbulent flux. The eddy-diffueddy-diffu-sivity
coeffi-cient (Km) is a function of the turbulent-kinetic-energy, for
which a prognostic equation is solved. The second term on the right hand side of Eq. (1) denotes the mass flux contri-bution. The mass flux part of the parameterization model
steady state laterally entraining convective thermals. In
Eq. (1)wi,aiandjiare the vertical velocity, relative area
and the value of the moist conserved variable or wind
com-ponent in thei-th thermal. The thermals can be either dry
(with no condensed water) or moist (containing condensed water). To obtain the properties of the thermals, a set of steady state equations for each of the thermals is solved. The key component of the mass-flux model is the treatment of entrainment. In this model, the entrainment is para-meterized as a discrete stochastic event, which eventually allows for the realistic representation of turbulent fluxes in cumulus-dominated boundary layer.
The initial conditions for SCM are the profiles of po-tential temperature, relative humidity and the components of the wind speed taken at 00 UTC from the CHUVA cam-paign measurements. We initialize the model early in the morning before the onset of the convection to allow the convection to form in the model. The model is forced with a
time-varying surface latent, sensible and momentum
flu-xes, also obtained from the measurements. We do not force the model with a horizontal advection of moist conserved variables, since those data is not readily available. As a re-sult of this, the model’s free tropospheric values might drift
from the measurements. However, the boundary layer pro-perties do not seem to be highly influenced by the advec-tion. The wind speed is relaxed toward the initial values with a relaxation time of 2 h.
3. Result and Discussions
The days of June 07th, 10th, 11th, 14thand 15th, with
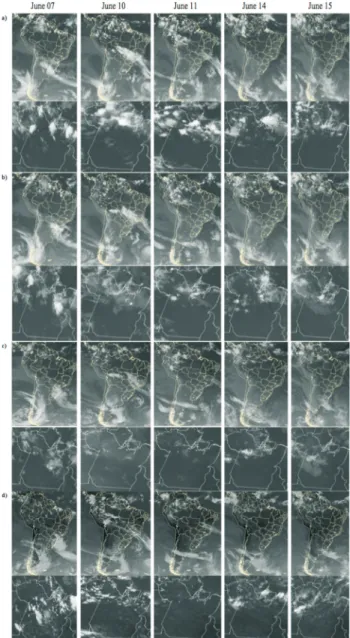
strong presence of cumulus clouds over the north of the country and daytime data without the presence of rain were selected by color enhanced infrared satellite images of cloud cover type under Brazil (Fig. 3) aiming to represent the shallow convection. Their synoptic characteristics were analyzed and explained hereafter separately for each day followed by the validation of the parameterization and the turbulent fluxes generated for the SCM results to vertical resolution.
The satellite images of June 07th(Fig. 3a) show some
cumulus and stratus cloud cover holdover at 12:00 h over the north and center of the Para state. Figure 4 presents detail of infrared satellite images at different hours of the day, where some cumulus clouds are visible toward the northern and coastal areas of the Para state moving southward at the be-ginning of the day (00:00-06:00 local time). At 18:00 h it is possible to see many convective cores and the formation of the squall lines. The propagation of squall lines to the interior of the continent can be noted. The CHUVA’s report (CHU-VA, 2011) registered convection around 20:00 h at Belem city (Outeiros site) and after 21:00 h, convection for almost all the Amazonian State; the Intertropical Convergence Zone (ITCZ) was in the north of Brazil, and the south and south-east regions of Brazil were covered by an extra-tropical cy-clone. According to Machado (2014) on that day, more than twenty rain events crossed the experimental region; the rain
rate at the 99th percentile (corresponding to 1380 J kg-1) was
122 mm h-1. The CAPE was also very high and a cloud top of
approximately 13 km at 22:00 UTC was found.
Like the day before, June 10th(Figs. 4a-b) started with
clouds over the north of the state and close to the coast. At noon (Fig. 3b) the cloud cover of Para shows some cumulus and stratus clouds over the northern inland area but the coast is clear. At 18:00 h (Fig. 4d), the presence of many convective cores in the north and along the coast was no-ticed. According to CHUVA’s report (CHUVA, 2011), at 21:00 h local convection was noted under the entire Para state. It was an extra-tropical cyclone under the Brazilian southeast region (Fig.4a-d) that influenced the amazon south region. Also the presence of easterly waves arriving in the east coast of Brazilian northeast was noted.
At June 11ththe systems on the Para state seem to be
associated with the local convection that was formed in the coast. The ITCZ was in the north. In the satellite images (Fig. 4a-d) we can see clouds in the north and close to the ocean during the entire morning. The cloud cover at noon (Fig. 3c) shows the predominance of cumulus clouds over the north of the state. According to CHUVA’s report (CHUVA, 2011) in that day the squall lines were formed in the Maranhão coast until Amapa, not showing in the satel-lite images.
On June 14ththe satellite images showed that the day
started with more clouds at the coast and convective cores in the north and center of the Para state; at noon we have a predominance of cover of the cumulus and multilayer clouds over the northern inland area; at 18:00 local time the formation of convective cores began, perhaps because of the interaction between the sea breeze circulation and ITCZ. It is noted (Fig. 4d) that the squall line system was formed at the Para coast and followed toward the continent. Note that there are well formed convective cores at 6:00 and 18:00 h.
At 00:00 GMT on June 15th(Fig. 4a) the dissipation
of the convective system in the northeast of Para can be
Figure 3- Enhanced infrared satellite images from the GOES-12 satellite at 12:00 UTC showing the cloud cover over Brazil on June 07th, 10th, 11th,
noted, causing weak and isolated rains; instability areas at the western Amazon are starting to be formed. At noon no-tice the predominance of cumulus cloud cover in the north-ern of the Para state (Fig.3e). At 18:00, the presence of shallow and stratiform clouds along the northern part of the state is noted. According to CHUVA’s report (CHUVA, 2011) the ITCZ was in its position further north and at 21:00h the convective cell was in the mature and dissipa-tion phase.
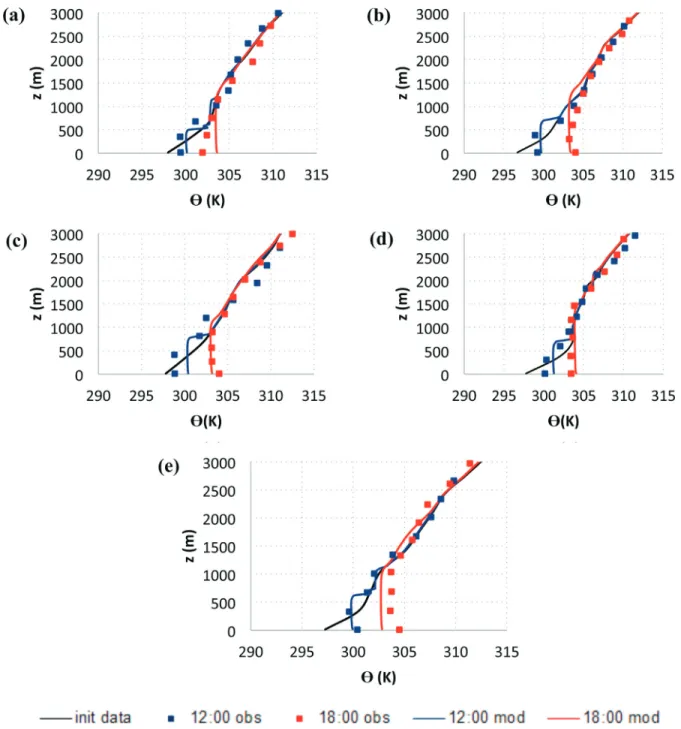
Figure 5 shows the comparison between the observa-tional data and the SCM for the potential temperature and Fig. 6 shows the relative humidity comparison between the SCM and the observational data for the selected days. Table 1 shows the bias (the difference between the simulated and observed values) and the root mean square error (rmse) for
the potential temperature and relative humidity profiles. Notice that for the potential temperature the smallest value
is at 12:00 h on June 7th(0.18 K) and the biggest one is at
June 11th(-2.32 K) and the rmse ranges from 0.59 to 2.99 K.
For Relative Humidity Table 1 shows a substantial differ-ence on the relative humidity between the days with the bias ranging from 3.06% to 16.11% and rmse ranging from
8.08% to 24.14%. Gochiset al.(2001) in his study about
the sensitivity of the modeled North American monsoon to convective parameterization showed significant differ-ences between mean biases, at the 95% level, of the mod-eled and observed temperature, specific humidity and equi-valent potential temperature at seven stations.
At June 7th(Fig. 5a), although the negative potential
temperature bias at 18:00 was shown as -0.67 K (Table 1), the profile was represented very well. The potential
temper-ature for the day June 10th(Fig. 5b) shows a good
compari-son between the SCM and observational data, also despite of the negative potential temperature bias at noon (Table 1) but the relative humidity (Fig.6b) shows only a similar ten-dency between the observational data and the model in the
first few meters of height. June 11thshows a negative bias
during noon of -2.32 K (Table 1), but at 18:00 h the poten-tial temperature showed a very good accord between the observational and model data (Fig. 5c). This might be due to the presence of clouds on that day without any precipita-tion. The tendency of relative humidity agreed somewhat better on this day than on the days before; the model seems to have coherency until 1300 m of height (Fig. 6c). At June
14thnote that the relative humidity at 18:00 (Fig. 6d) is
gen-erally similar between the observational and model data un-til approximately 1300 m. This period of the day also presents the smallest bias and rmse values for the relative humidity (Table 1). The potential temperature (Fig. 5d) shows a good agreement also, especially at 18:00 h. June
15thshowed a good agreement of potential temperature at
12:00 h (Fig. 5e); at this time we note clouds (Fig. 4c) to-wards the interior of the state and no tendency was shown for the relative humidity at the same time (Fig. 6e). At least there is tendency at 18:00 h (Fig. 6e), but with an rmse of 18.50% in the relative humidity, shown in Table 1.
The observational hourly turbulent flows data (Figs. 7, 8 and 9) was used as input to analyze the vertical motions of energy in the atmosphere through the both latent and sensible heat generated by the SCM in the vertical reso-lution of the turbulent flows at 6:00, 12:00 and 18:00 local
time of the days June 7th, 10th, 11th, 14thand 15th(Fig. 10). It
is noteworthy that the number of studies related exclusively with turbulent flows of the atmosphere eastward from the Amazon is still limited in the formal literature, making a comparison between the results inadequate. However, cita-tions about the articles and their results in the neighboring regions of Belem will be shown.
The surface friction velocity (u*) cycle (Fig. 7)
present significant values until 13:00 h for all days;
Table 1- Bias and Rmse statistics for the potential temperature profiles of June 07th, 10th, 11th, 14thand 15that 12:00 and 18:00 h.
Potential temperature (q) Relative humidity
Bias (K) Rmse (K) Bias (K) Rmse (K) Bias (%) Rmse (%) Bias (%) Rmse (%)
Days 12:00 18:00 12:00 18:00
June 7th 0.18 0.70 -0.67 1.16 10.63 16.39 12.48 15.46
June 10th -0.64 0.99 1.29 2.22 11.60 14.16 14.82 15.90
June 11th -2.32 2.99 0.68 0.93 14.65 24.14 16.11 21.68
June 14th 0.78 1.23 0.64 0.94 11.04 19.04 5.56 8.08
June 15th 0.41 0.59 1.41 2.29 3.06 11.31 11.82 18.50
Figure 5- Potential temperature for June 7th(a), June 10th(b), June 11th(c), June 14th(d) and June 15th(e). The initial data in black solid line, dashed line
ter that, there are disparities between 13:00 and 16:00 h
on June 7thand 14th, and between 14:00 and 16:00 h on
June 10th, where the values increase to 0.5 ms-1.
Roballo, 2007, analyzed values of u*at the Maranhão
coast of Brazil during the dry and rain periods of 1995-1999 year, finding values between 0.48 and 0.38 for the June month according with 3.3 m movement in the zero plane d.
Figures 8 and 9 shows the Latent (LE) and sensible
Heat Fluxes (H) for the days June 7th, 10th, 11th, 14thand
15th. Note that the biggest values at 12:00 h for LE are
be-tween 300 and 400 W m-2 and the H is between 80 and
200 W m-2. June 7thpresents the smallest mean of LE with
its maximum value around 300 W m-2at noon. At 14:00 and
16:00 h on June 10th, negative peaks of LE are shown and
June 15th presents a peak value at 20:00h. Studies
per-Figure 6- Relative humidity for June 7th(a), June 10th(b), June 11th(c), June 14th(d) and June 15th(e). The initial data in black solid line, dashed lines for
the observational data, red at 12:00 and blue at 18:00. Colored solid lines for model results in red 12:00 and blue 18:00 local time.
formed during rain periods in the Caxiuana forest (Belem region) for Souza Filho (2002) present the values of
307.7 W m-2(LE) and 105.4 W m-2(H); in periods of less
rain the values were 431.62 W m-2(LE) and 162.9 W m-2
(H) at 12:00 h. Da Rochaet al.(2004) in his study about the
seasonality of water and heat fluxes over a tropical forest in the eastern Amazon, made in the Tapajós National Forest, 83 km from Santarém, state of Pará, which analyses were divided into 15 July to 14 December as the dry season and the remaining period as the wet season for the year of 2000-2001, found the values of LE for the wet season
around 300 W m-2(LE) and 80 W m-2(H) and for the dry
season around 350 W m-2 (LE) and 100 W m-2 (H) at
12:00h. Souzaet al.(2009) in their studies about shallow
convection and radiation in the diurnal cycle using the BRAMS (Brazilian developments on the Regional Atmo-spheric Modelling System) and validating with Rondonia site experiments in the month of February found values
around 100 W m-2(H) and about 340 W m-2(LE) at noon
for the west wind regime and around 180 W m-2(H) and
320 W m-2for the east wind regime in the case of the
inter-action between the radiation and the shallow convection. Figure10 shows the vertical turbulent fluxes obtained
by the SCM for 6:00, 12:00 and 18:00 h of at June 7th, 10th,
11th, 14thand 15th. We note that the largest profiles of LE
and H occur at June7thgoing until 3500m. June 10th
pres-ents values of H higher than 350 W m-2. June 14th, which
showed the smallest % of bias and rmse related with the rel-ative humidity at 18:00 (Table 1), as illustrated in Fig. 10, peaks close to 2000 m at 18:00 h where the value of LE goes
to approximately -10 W m-2 and H to approximately
60 W m-2.
4. Conclusions
To keep the work consistent, a synoptic study using satellite images was carried out to identify the optimal days and physical conditions to obtain better approximations for the results of the SCM and the CHUVA data campaign. It was noted that the potential temperature was overall pre-dicted very well by the model. Regarding relative humidity,
Figure 8- Latent heat fluxes cycle for the CHUVA experiment on June 7th, 10th, 11th, 14thand 15th.
Figure 10- Turbulent fluxes generated from the SCM at 6:00, 12:00 and 18:00 local time on June 7th(a), June 10th(b), June 11th(c), June 14th(d) and June
the model follows a tendency in the first meters of height
and in some cases such as on June 14that 18:00 h, when the
core of clouds was very consistent under Belem, the agree-ment between the model and the observational data are
rea-sonably good. For a day such as June 11that 18:00 h the
model was also quite precise in the modeling of the relative humidity; on this day clouds were present without any pre-cipitation.
It is important to note that the SCM used in this article assumes horizontal homogeneity and cannot simulate sea-breeze conditions. Another factor to be considered is that the horizontal advection of moist conserved variables were not forced into the model, causing a drift of the model’s predictions for the free tropospheric values from the actual measurements. The general profile of potential temperature structure was reproduced well, although negative potential temperature bias is identified for two days at noon and for one day in the afternoon (18:00 h). Considering that June is the end of the rainy station in Belem, it was noticed that the Latent (LE) and sensible Heat Fluxes (H) generated by the SCM agreed with the values available in the literature from the observational studies made in the Caxiuana forest in the Belem region and the Tapajós National Forest in the Pará state.
This initial study about the Jet Propulsion Laboratory / NASA model of shallow convection parameterization in a framework of the single column model for the Amazon coastal region demonstrated a good starting point but much more still needs to be done for that particular region. The work of parameterization of the Amazon region in all of its complexity, in addition to the problem of tropical convec-tion parameterizaconvec-tion generally, remains a challenge. It is a consensus among the experts that more attention needs to be given to convective parameterizations and that shallow convection parameterization plays a key role in the accu-racy of global models, because it affects vertical structures. However, the number of studies focused solely on convec-tive parameterization in large-scale models in the Amazon, also is quite limited in the formal literature. There are even fewer publications available regarding the areas east of the Amazon, restricting opportunities for meaningful compari-sons.
These analyses were our first step in parameterization of the model of the Amazon region. Future studies in differ-ent regions of the Amazon are being planned to test the ac-curacy and sensibility of the SCM model in different scenarios.
Acknowledgments
We acknowledge the support provided by the Chuva Project FAPESP 2009/15235-8 and by the National Insti-tute for Space Research in Brazil. Part of this research was carried out at the Jet Propulsion Laboratory of the National Aeronautics and Space Administration at California Insti-tute of Technology. We thank the editor and two
anony-mous reviewers for their constructive comments, which helped us to improve the manuscript.
References
ADAMS, D.K.; SOUZA, E.P.; COSTA, A.R. Convecção úmida na Amazônia: Implicações para a modelagem numérica. Revista Brasileira de Meteorologia, v. 24, n. 2, p. 168-178, 2009.
ADAMS, D.K.; FERNANDES, R.M.S.; HOLUB, K.L.; GUT-MAN, S.I.; BARBOSA, H.M.J.et al.The Amazon Dense GNSS Meteorological Network: A New Approach for Ex-amining Water Vapor and Deep Convection Interactions in the Tropics.Bulletin of the American Meteorological So-ciety, v. 96, p. 2151-2165, 2015.
ARAKAWA, A. The Cumulus Parameterization Problem: Past, Present, and Future. Journal of Climate, v. 17, n. 13, p. 2493-2525, 2004.
BASTOS, T.X.; PACHECO, N.A.; NECHET, D.; ABREU SÁ, T.D. Aspectos Climaticos de Belém nos Ultimos Cem Anos, EMBRAPA, Empresa Brasileira de Pesquisa Agropecuária, Pesquisa Agroflorestal da Amazônia Oriental, Ministerio da Agricultura, Pecuaria e Abastecimento, 31 p., ISSN 1517-2201, Fevereiro, 2002.
BECHTOLD, P.; CHABOUREAU, J.P.; BALJAARS, A.; BET-TS, A.K.; KöHLER, M.;et al.The Simulation of the Diurnal Cycle of Convective Precipitation over Land in a Global Model.Quarterly Journal of the Royal Meteorological Society, v. 130, p. 3119-3137, 2004.
BOTTINO, M.J.; CEBALLOS, J.C.; LIMA, W.F.A. Classifi-cação de Nuvens em Imagens Multiespectrais GOES-8 na Região Amazônica: Comparação com Radiossondagens. Third LBA Scientific conference, 2004, Anais...Brasília, Brasil.
CAMPOS, T.L.O.B.; MOTA, M.A.S.; SANTOS, S.R.Q. Eventos Extremos de Precipitação em Belém-PA: Uma Revisão de Notícias Históricas de Jornais.Revista Ambiente & Água, v. 10, n.1, p. 182-194, 2015.
CAVALCANTI, I.F.A.; MARENGO, J.A.; SATYAMURTY, P.; NOBRE, C.A.; TROSNIKOV, I.;et al.Global Climatologi-cal Features in a Simulation Using the CPTEC-COLA AGCM.Journal of Climate, v. 15, n. 21, p. 2965-2988, 2002.
CEBALLOS, J.C.; BOTTINO, M.J. Classificação Automática de Cenas: Uma Análise da Informação Mínima Contida em Imagens GOES-8 Multiespectrais. X Congresso Brasileiro de Meteorologia, 1998, Anais... Brasília, Brasil (COMPACT DISK ART. MS98032).
CHAGNON, F.J.F.; BRAS, R.L.; WANG, J. Climatic Shift in Patterns of Shallow Clouds over the Amazon.Geophysical Research Letters, v.31, Issue 24, L24212, 2004.
CHOU, S.C.; NOBRE, P. Avaliação de Modelos Globais e Regio-nais Climáticos. In: AMBRIZZI, T.; ARAUJO, M. Base Científica das Mudanças Climáticas. Rio de Janeiro: COPPE, v. 1, p. 278-319, 2015.
COHEN, J.C.P.; DIAS, M.A.F.S; NOBRE, C.A. Environmental Conditions Associated with Amazonian Squall Lines: A Case Study.Monthly Weather Review, v. 123, Issue 11, p. 3163-3174, 1995.
CAVALCANTI, I.F.A.; FERREIRA, N.J.; SILVA, M.G.A.J.; DIAS, M.A.F.S. (Orgs.). Tempo e Clima no Brasil. São Paulo: Oficina de Texto. p. 75-92, 2009. CUTRIM, E.M.; MOLION, L.C.B.; NECHET, D.: Chuvas na
Amazônia durante o século XX, XI CONGRESSO BRASI-LEIRO DE METEOROLOGIA, 2000,Anais...Rio de Ja-neiro, Brasil.
DA ROCHA, H.R.; GOULDEN, M.L.; MILLER, S.D.; MEN-TON, M.C.; PINTO, L.D.V.O.;et al.Seasonality of Water and Heat Fluxes over a Tropical Forest in Eastern Ama-zonia,Ecological Applications,v. 14, p. 22-32, 2004. DE SOUZA, E.B.; AMBRIZZI, T. ENSO Impacts on the South
American Rainfall during 1980s: Hadley and Walker circu-lation.Atmósfera, v. 15, n. 2, p. 105-120, 2002.
FERREIRA, D.B.S.; DE SOUZA, E.B.; MORAES, B.C.; MEI-RA FILHO, L.G. Spatial and Temporal Variability of Rain-fall in Eastern Amazon during the Rainy Season,The Scien-tific World Journal, v. 2015, p. 1-9, 2015.
FIGUEROA, S.N.; NOBRE, C.A. Precipitations Distribution over Central and Western Tropical South America. manálise - Boletim de Monitoramento e Análise Cli-mática, v. 5, n. 6, p. 36-45, 1990.
FU, R.; ZHU, B.; DICKINSON, R. How do Atmosphere and Land Surface Influence Seasonal Changes of Convection in the Tropical Amazon.Journal of Climate, v. 12, p. 1306-1321, 1999.
GARSTANG, M.; GRECO, S.; SCALA, J.; SWAP, R.; ULANS-KI, S.; et al. The Amazon Boundary Layer Experiment
(ABLE 2B): A Meteorological Perspective.Bulletin of the American Meteorological Society, v. 71, p. 19-32, 1990. GARSTANG, M.; MASSIE Jr., H.L.; HALVERSON, J.;
GRE-CO, S.; SCALA, J. Amazon Coastal Squall Lines. Part I: Structure and Kinematics. Monthly Weather Review, v. 122, p. 608-622, 1994.
GILLE, F.S.S.; MOTA, M.A.S. Importância das Condições Ter-modinâmicas nos Eventos Extremos de Precipitação na Ci-dade de Belém e Região Metropolitana.Revista Brasileira de Meteorologia, v. 29, n. esp., p. 73-82, 2014.
GOCHIS, D.J.; SHUTTLEWORTH, W.J.; YANG, Z.L. Sensitiv-ity of the Modeled North American Monsoon Regional Cli-mate to Convective Parameterization. Monthly Weather Review, v. 130, p. 1282-1298, 2001.
GRABOWSKI, W.W.; BECHTOLD, P.; CHENG, A.; FORBES, R.; HALLIWELL,C.;et al.Daytime Convective Develop-ment over Land: A model Intercomparison based on LBA Observations.Quarterly Journal of the Royal Meteoro-logical Society, v. 132, p. 317-344, 2006.
GRECO, S.; SWAP, R.; GARSTANG, M.; ULANSKI, S.; SHIPHAM, M.;et al.Rainfall and Surface Kinematic Con-ditions over Central Amazonia During ABLE 2B.Journal of the Geophysical Research, v. 95, p. 17001-17014, 1990. GRECO, S.; SCALA, J.; HALVERSON, J.; MASSIE, H.L.;
TAO, W.K.;et al.Amazon Coastal Squall Lines. Part II:
Heat and Moisture Transports.Monthly Weather Review, v. 122, p. 623-635, 1994.
KAIN, J.S. The Kain-Fritsch Convective Parameterization: An Update. Journal of Applied Meteorology, v. 43, p. 170-181, 2004.
KHAIROUTDINOV, M.F.; RANDALL, D.A. Cloud Resolving Modeling of the ARM Summer 1997 IOP: Model
Formula-tion, Results, Uncertainties, and Sensitivities. Journal of the Atmospheric Sciences, v. 60, p. 607-625, 2003. LIN, X.; RANDALL, D.A.; FOWLER, L.D. Diurnal Variability
of the Hydrological Cycle and Radiative Fluxes: Compari-sons between Observations and a GCM. Journal of Cli-mate, v. 13, p. 4159-4179, 2000.
LOPES, Z.F.; DE SOUZA, E.P.; GALVÍNCIO, J.D. Estudo Numérico da Interação entre Convecção Rasa e Radiação com ênfase no Ciclo Diurno do Balanço de Energia à Superfície: Comparação entre duas Simulações.Revista de Geografia (UFPE), v. 29, n. 1, p. 193-208, 2012.
LOPEZ, P. Cloud and Precipitation Parameterizations in Mo-deling and Variational Data Assimilation: A Review. Jour-nal of the Atmospheric Sciences, v. 64, p. 3766-3784, 2007.
MACHADO, L.A.T.; DIAS, M.A.F.S.; MORALES, C.; FISCH, G.; VILA, D.;et al.The CHUVA Project - How does
Con-vection vary across Brazil?Bulletin of the American Me-teorological Society, v.95, p. 1365-1380, 2014.
MARENGO, J.A.; HASTENRATH, S. Case Studies of Extreme Climatic Events in the Amazon Basin.Journal of Climate, v. 6, p. 617-627, 1993.
MARENGO J.A.; LIEBMANN, B.; KOUSKY, V.E.; FILIZO-LA, N.P.; WAINER, I.C. Onset and End of the Rainy Sea-son in Brazilian Amazon Basin.Journal of Climate, v. 14, p. 833-852, 2001.
MORAES, B.C.; FERREIRA, D.B.S.; FILHO, L.G.M.; OLI-VEIRA, J.V.; SOUZA, E.B.;et al.Comparative Skill of
Nu-merical Weather Forecasts in Eastern Amazonia. Atmo-spheric and Climate Sciences, v. 3, p. 355-363, 2013. MOURA, M.N.; VITORINO, M.I. Variabilidade da Precipitação
em Tempo e Espaço associada à Zona de Convergência Intertropical. Revista Brasileira de Meteorologia, v. 27, n. 4, p. 475 - 483, 2012.
NECHET, D. Variabilidade Diurna de Precipitação em Belém-PA: Aplicação em Planejamentos a Médio e Longo Prazo. Boletim Climatológico dos Anais do II Simpósio Bra-sileiro de Climatologia Geográfica. Presidente Prudente, SP, v. 2, n. 3, p. 223-227, 1997.
NEGRI, A.J.; ANAGNOSTOU, E.N.; ADLER, R.F. A 10-yr Cli-matology of Amazonian Rainfall Derived from Passive Mi-crowave Satellite Observations.Journal of Applied Mete-orology, v. 39, p. 42-56, 2000.
NOBRE, P.; SIQUEIRA, L.S.P.; ALMEIDA, R.A.F.; MALA-GUTTI, M.; GIAROLLA, E.;et al.Climate Simulation and Change in the Brazilian Climate Model.Journal of Cli-mate, v. 26, p. 6716-6732. 2013.
PETERSEN, W.A.; NESBITT, S.W.; BLAKESLEE, R.J.; CIFELLI, R.; HEIN, P.; et al. TRMM Observations of
Intraseasonal Variability in Convective Regimes over the Amazon.Journal of Climate, v. 15, p. 1278-1294, 2002. PETERSEN, W.A.; FU, R.; CHEN, M.; BLAKESLEE, R.
Intra-seasonal Forcing of Convection and Lightning Activity in the Southern Amazon as a Function of Cross-Equatorial Flow.Journal of Climate, v. 19, p. 3180-3196, 2006. RIBEIRO, W.M.N.; SOUZA, J.R.S.; LOPES, M.N.G.;
ROBALLO, S. T.Estudo do Escoamento Atmosférico na CLA, através de Medidas em Torre Anemométrica e em Túnel de Vento. Dissertação de Mestrado em Meteorologia, Insti-tuto Nacional de Pesquisas Espaciais (INPE), São José dos Campos, 2007.
SOUZA, E.P.; LOPES, Z.F.; ARAUJO, T.L. Estudo numérico da interação entre convecção rasa e radiação com ênfase no ciclo diurno do balance de energia a superfície na Amazônia. Revista Brasileira de Meteorologia, v. 24, n. 2, p. 158-167, 2009.
SOUZA FILHO, J.D.C.Variação Sazonal dos Componentes do Balanço de Radiação e Energia sobre a floresta de Ca-xiuanã. Tese de Doutorado em Meteorologia, Universidade Federal de Viçosa, Viçosa, 2002.
STULL, R.B. A Fair-Weather Cumulus Cloud Classification Scheme for Mixed-Layer Studies.Journal of Climate and Applied Meteorology, v. 24, p. 49-56, 1985.
SUŠELJ, K.; TEIXEIRA, J.; MATHEOU, G. Eddy Diffusivity/Mass Flux and Shallow Cumulus Boundary Layer: An Updraft PDF Multiple Mass Flux Scheme. Jour-nal of Atmospheric Sciences, v. 69, p. 1513-1533, 2012. SUŠELJ, K.; TEIXEIRA, J.; CHUNG, D. A Unified Model for
Moist Convective Boundary Layers Based on a Stochastic Eddy-Diffusivity/Mass-Flux Parameterization. Journal of Atmospheric Sciences, v. 70, p. 1929-1953, 2013. TAVARES, J.P.N.; MOTA, M.A.S. Condições termodinâmicas
de eventos de precipitação extrema em Belém - PA durante
estação chuvosa. Revista Brasileira de Meteorologia, v. 27, n. 2, p. 207-218, 2012.
VIANELLO, R.L.; ALVES, A.R.Meteorologia básica e Apli-cações. Viçosa (MG): Imprensa Universitária, 449 p., 1991. YANG, G.Y.; SLINGO, J. The Diurnal Cycle in the Tropics.
Monthly Weather Review, v. 129, p. 784-801, 2001.
Internet Resources
CHUVA Project, 2011. Campanha de Belém. Available at: http://chuvaproject.cptec.inpe.br/portal/belem/br/in-dex.html. Accessed August 28, 2014.
DSA, Divisão de Satélites e Sistemas Ambientais, Centro de Previsão do Tempo e Estudos Climáticos, Instituto Nacional de Pesquisas Espaciais. Available at: http://satelite.cptec.inpe.br/informacao/orbitas.jsp. Ac-cessed March 19, 2016.
GPM, Global Precipitation Measurement, National Aeronautics and Space Administration, Goddard Space Flight Center, 2014. Available at: http://pmm.nasa.gov/node/243. Ac-cessed March 19, 2016.
IBGE, Instituto Brasileiro de Geografia e Estatística, Censo
De-mográfico 2010. Available at:
http://cidades.ibge.gov.br/xtras/perfil.php?lang=&codmun = 150140&search=para belem.Accessed March 19, 2016.