APPLYING THE ACTIVITY-BASED COSTING (ABC)
MODEL IN A CONSULTING COMPANY:
AN IMPROVEMENT OF THE MODEL
Mafalda Cristina Parracho Neto
Project submitted as partial requirement for the conferral of Master of Science in Business Administration
Supervisor:
Prof. Doutor Leandro Pereira, Prof. Auxiliar Convidado, ISCTE Business School, Departamento de Marketing, Operações e Gestão Geral
APPLYING THE ACTIVITY-BASED COSTING (ABC)
MODEL IN A CONSULTING COMPANY:
Acknowledgements
As I believe that the most important thing in life, in order to be successful in everything, are the people we choose to have by our side, I would like to make reference and thank: - My supervisor, for giving me the opportunity to develop this project in Winning while making, at the same time, an internship that had enriched me in so much ways; for his availability and receptivity to all my doubts and concerns; and for enduring my insistencies throughout these twelve months of work;
- Everyone that had positively contributed to this project’s evolution, namely the employees of Winning that had provided me all the data I needed;
- The special friends I’ve met at Banco Popular: Ana Lopes, João Dias, José Veiga, Pedro Vieira, Pedro Costa and Carlos Correia, for making my internship’s working days so easy to handle, and for giving me the funniest support in the development of this project; - My best friends: Giselle, for always knowing the kind of support I need (despite being
across the world) and for being the proof that distance doesn’t matter when we like someone; and Agrati, for giving me all the advices I need, at any time of the day, any day of the week. Your ability of simplifying things has helped me a lot during this journey;
- My boyfriend Nuno Miranda, who has helped me more than ever, for all the support and all the patience that he has demonstrated towards me; for all the cries and times of stress and desperation he has withstood. And of course, for sparing his free time on reading my project when he had his to do. You are the best and I love you!;
- My closest family (Dad, Mom and Sister), for listening to all my fears and concerns, and still guiding and helping me on finding always the best way for me, and for helping me on everything I ask them; to my grandma Esmeralda, for being always so proud and praising me for my accomplishments to the others; and to my grandpa João, for being always so thoughtful with me, and a huge sorry for my absence;
- Last but not the least, I would like to thank to one shinny little star that always comes with me, my grandpa Manuel Parracho. I am absolutely sure that your help and support while I was still a kid, had the most important role on defining the type of person I’ve become, namely on the persistence on finishing things, which had helped me on the development of this project. I would be thankful if I had half of your skills. I will forever love you.
Resumo
Em ambientes instáveis e de constante mudança, de que é exemplo o atual mundo das organizações, é notória a necessidade sentida pelas empresas, de conseguirem superar os seus concorrentes, tanto ao nível da estratégia, como ao nível de ferramentas utilizadas. Neste sentido, são cada vez mais as ferramentas disponibilizadas às empresas, que as auxiliam no processo de tomada de decisão, bem como no alcance de uma maior eficiência em todos os seus processos internos. É, também, por este motivo, que existe uma evidente necessidade de estar constantemente a inovar estas ferramentas, de modo a que as organizações consigam estar sempre um passo à frente dos seus concorrentes. O tema deste projeto surge, então, no seguimento da referida necessidade, tendo como objetivo adaptar uma ferramenta (já existente no mercado) – o modelo de custeio
Activity-Based Costing – a uma empresa de Consultoria de Gestão, a Winning Management
Consulting. Esta aplicação pretende, assim, provar a adaptabilidade deste modelo à Consultoria, uma vez que são diversos os benefícios que uma empresa pode alcançar com a sua utilização, nomeadamente no auxílio da tomada de decisão e também na gestão de custos.
Em paralelo, o projeto contemplará, ainda, uma análise secundária (em complemento ao modelo aplicado), que permitirá à empresa atuar, não só sobre os processos principais (que foram alvo de análise no modelo de custeio ABC), mas também sobre todos os processos secundários, que permitem o correto funcionamento da empresa. Pretende-se então, com esta análise, contribuir positivamente para uma melhoria do modelo.
Palavras-Chave: Activity-Based Costing | ABC | Ferramentas de Gestão | Gestão de
Custos
Abstract
In unstable and constant changing environments, as it is the current organizational world, it is notable the real need felt by companies on trying to overcome their competitors, in both employed strategy and auxiliary tools. In this way, there is an increase in the available tools in the market, which aim to help companies in their decision-making process and in the achievement of higher efficiency in the running of all their internal processes. Due to this, the necessity on being constantly innovating these tools outstands significantly in companies, in order to these to be always one step in front of their competitors.
From this necessity arises the subject of this project, as it pretends to adapt an existing tool – the costing model “Activity-Based Costing” – to a management consulting company, named Winning Management Consulting. This application aims to prove the adaptability of this model to the Consulting sector, as there are so many benefits that a company may achieve from its application, namely in the assistance to the decision-making process and to the cost management.
In parallel, the project will also contemplate a secondary analysis (a complement to the ABC model), which will allow the company to act not only upon the main processes (that were analyzed in the ABC), but also upon all the secondary processes, without which would not be possible the correct running of the business. In conclusion, this analysis aims to positively contribute to the model’s improvement.
Keywords: Activity-Based Costing | ABC | Management Tools | Cost Management JEL Classification System: M10
Table of Contents
Executive Summary ... xi
Chapter 1 - Definition of the Problem Context ... 1
Chapter 2 - Literature Review ... 3
2.1. Activity-Based Costing ... 3
2.2. Benefits Management ... 8
Chapter 3 - Research Methodology ... 11
Chapter 4 - Data Collection and Analysis ... 17
4.1. Winning’s Brief Presentation ... 17
4.2. Application of the Model ... 19
4.3. Complementary Analysis ... 30
Chapter 5 - Implementation Proposal ... 59
5.1. Assumptions and Constraints ... 59
5.2. Information Update ... 60
5.3. Development of an Appropriate Excel Template ... 60
5.4. Application of the Model and its Complementary Analysis ... 63
5.5. Implementation and Verification ... 65
Chapter 6 - Project Conclusions and Contributions ... 67
6.1. Project Conclusions and Contributions ... 67
6.2. Limitations of the Project ... 69
Chapter 7 - References ... 71
Chapter 8 - Annexes ... 73
Annex A - Costs incurred by each supporting area, categorized by cost source and month (October, November and December)... 73
Annex B - Percentage of time dedicated to each supporting area (by employee) ... 75
Annex D - Total Training Revenues in October, November and December ... 75
Annex E - Staff Costs of each Competency Center in October, November and December ... 76
Annex F - Other Direct Costs incurred by each Competency Center in October, November and December ... 76
Annex G - BDO’s costs distribution and benefits classification ... 76
Annex H - FIN’s costs distribution and impact/benefits classification ... 77
Annex I - GM’s costs distribution and benefits classification ... 77
Annex J - HCO’s costs distribution and benefits classification ... 78
Annex K - ICT’s costs distribution and benefits classification ... 79
Annex L - MS’ costs distribution and benefits classification ... 79
Annex M - OM’s costs distribution and benefits classification ... 80
Annex N - PMO’s costs distribution and benefits classification ... 81
Annex O - MKO’s costs distribution and benefits classification ... 81
Annex P - QCO’s costs distribution and benefits classification ... 81
Annex Q - Excel Templates (for the ABC Application) ... 83
Annex R - Excel Templates (for the cost distribution and benefits classification), to provide to each supporting area ... 88
List of Figures
Figure 1 - General Structure of the ABC model ... 4 Figure 2 - The adaptation of ABC Model to a consulting company after the
elimination of the identified gaps ... 12 Figure 3 - Winning's Organizational Breakdown Structure ... 18 Figure 4 - Total Costs incurred by each Competency Center, in absolute values ... 28 Figure 5 - Contribution of each Competency Center for the Total Incurred Costs,
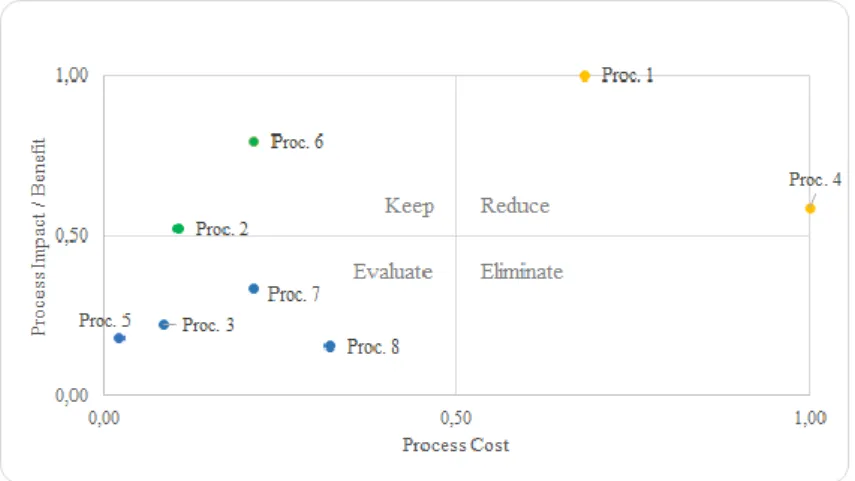
in percentage ... 28 Figure 6 - Categorization of each BDO’s process according to its cost norm scale
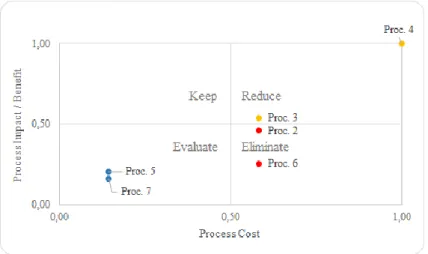
and impact norm scale ... 34 Figure 7 - Categorization of each FIN's process according to its cost norm scale
and impact norm scale ... 36 Figure 8 - Categorization of each GM's process according to its cost norm scale
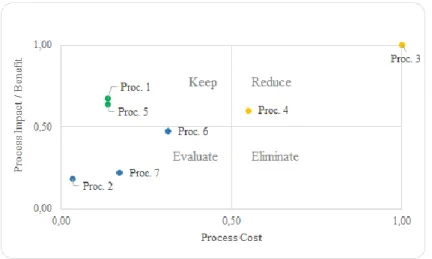
and impact norm scale ... 38 Figure 9 - Categorization of each HCO's process according to its cost norm scale
and impact norm scale ... 40 Figure 10 - Categorization of each ICT's process according to its cost norm scale
and impact norm scale ... 42 Figure 11 - Categorization of each MS' process according to its cost norm scale and
impact norm scale ... 44 Figure 12 - Categorization of each OM's process according to its cost norm scale
and impact norm scale ... 46 Figure 13 - Categorization of each PMO's process according to its cost norm scale
and impact norm scale ... 49 Figure 14 - Categorization of each MKO's process according to its cost norm scale
and impact norm scale ... 51 Figure 15 - Categorization of each QCO's process according to its cost norm scale
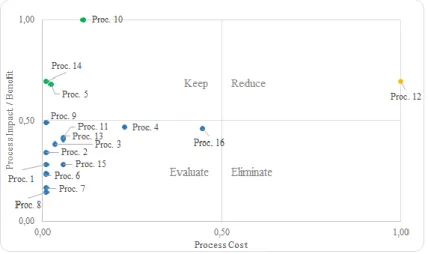
and impact norm scale ... 53 Figure 16 - Overall Process Categorization... 54 Figure 17 - The Most Expensive vs. The Most Impacting Processes ... 57 Figure 18 - Excel Template (Sheet 5) to be used for the final application of
ABC Model ... 87 Figure 19 - Template of the Output Graph ... 88
List of Tables
Table 1 - Monthly Costs per Supporting Process and Cost Source ... 21
Table 2 - Cost Allocation (among the three main Competency Centers) of the Processes that use the number of employees as its cost driver ... 24
Table 3 - Cost Allocation (among the three main Competency Centers) of the Processes that use the global revenues as its cost driver ... 25
Table 4 - Cost Allocation (among the three main Competency Centers) of the Processes that use the training revenues as its cost driver ... 26
Table 5 - Staff Costs directly related to each Competency Center ... 27
Table 6 - Other Direct Costs directly related to each Competency Center ... 27
Table 7 - Description of the processes that are executed by each supporting area ... 31
Table 8 - Cost and Impact Ranks, regarding BDO area ... 33
Table 9 - Cost and Impact Ranks, regarding FIN area ... 35
Table 10 - Cost and Impact Ranks, regarding GM area ... 37
Table 11 - Cost and Impact Ranks, regarding HCO area ... 39
Table 12 - Cost and Impact Ranks, regarding ICT area ... 41
Table 13 - Cost and Impact Ranks, regarding MS area ... 43
Table 14 - Cost and Impact Ranks, regarding OM area ... 45
Table 15 - Cost and Impact Ranks, regarding PMO area ... 47
Table 16 - Cost and Impact Ranks, regarding MKO area ... 50
Table 17 - Cost and Impact Ranks, regarding QCO area ... 52
Table 18 - Processes classified in the "Evaluate" Category ... 55
Table 19 - Processes classified in the "Keep" Category ... 55
Table 20 - Processes classified in the "Reduce" Category ... 56
Table 21 - Processes classified in the "Eliminate" Category ... 56
Table 22 - Most Expensive Processes vs. The Most Impacting Ones ... 58
Table 23 - BDO’s Costs in October, November and December ... 73
Table 24 - FIN’s Costs in October, November and December ... 73
Table 25 - GM’s Costs in October, November and December ... 73
Table 26 - HCO’s Costs in October, November and December ... 73
Table 27 - ICT’s Costs in October, November and December ... 73
Table 28 - MS’ Costs in October, November and December ... 74
Table 30 - PMO’s Costs in October, November and December ... 74
Table 31 - MKO’s Costs in October, November and December ... 74
Table 32 - QCO’s Costs in October, November and December ... 74
Table 33 - Percentage of time dedicated to each supporting area (by employee) ... 75
Table 34 - Global Revenues incurred by each Competency Center in October, November and December, and its respective monthly average and relative weight (in %) ... 75
Table 35 - Total Training Revenues incurred by each Competency Center in October, November and December, and its respective monthly average and relative weight (in %)... 75
Table 36 - Staff Costs incurred by each Competency Center in October, November and December (includes wages, cost of computers per month and cost of cellphones per month) ... 76
Table 37 - Other Direct Cost incurred by each Competency Center in October, November and December ... 76
Table 38 - BDO's Cost Distribution per each secondary process ... 76
Table 39 - Impact classification of each BDO's secondary process ... 76
Table 40 - FIN's Cost Distribution per each secondary process ... 77
Table 41 - Impact classification of each FIN's secondary process ... 77
Table 42 - GM's Cost Distribution per each secondary process ... 77
Table 43 - Impact classification of each GM's secondary process ... 77
Table 44 - HCO's Cost Distribution per each secondary process ... 78
Table 45 - Impact classification of each HCO's specific process ... 78
Table 46 - ICT's Cost Distribution per each specific process ... 79
Table 47 - Impact classification of each ICT's secondary process ... 79
Table 48 - MS' Cost Distribution per each secondary process ... 79
Table 49 - Impact classification of each MS' secondary process ... 80
Table 50 - OM's Cost Distribution per each secondary process ... 80
Table 51 - Impact classification of each OM's secondary process ... 80
Table 52 - PMO's Cost Distribution per each secondary process ... 81
Table 53 - Impact classification of each PMO's secondary process ... 81
Table 54 - MKO's Cost Distribution per each secondary process ... 81
Table 55 - Impact classification of each MKO's secondary process ... 81
Table 57 - Impact classification of each QCO's secondary process ... 82 Table 58 - Excel Template (Sheet 1) to be used for the collection of data regarding
staff costs ... 83 Table 59 - Excel Template (Sheet 2) to be used for the collection of data regarding
other direct costs incurred by each Competency Center ... 84 Table 60 - Excel Template (Sheet 3) to be used for the collection of data regarding
overhead/indirect costs ... 85 Table 61 - Excel Template to be used for the collection of data regarding revenues ... 86 Table 62 - Excel Template to be used for the collection of data regarding each
List of Abbreviations
BACC Business Analysis Competency Center BDO Business Development Office
BMCC Benefits Management Competency Center
CC Competency Center
FIN Finance (Office)
GM General Management (Office)
HCO Human Capital Office
ICT Information and Communication Technologies (Office)
MKO Marketing Office
MS Management School (Office)
OBS Organizational Breakdown Structure
OM Office Management
PMCC Project Management Competency Center PMO Project Management Office
Executive Summary
O mundo organizacional enfrenta, cada vez mais, uma realidade de constante mudança. É certo que, qualquer organização que não seja capaz de se adaptar às mudanças do mercado, dificilmente conseguirá sobreviver nele. O ambiente revela-se extremamente competitivo e as empresas vêem-se obrigadas a adaptar as suas estratégias e ferramentas, àquilo que consideram ser a resposta às lacunas que o mercado apresenta.
Nesta conjuntura de alta competitividade, é exigido às organizações que estas se tornem cada vez mais eficientes, de modo a conseguirem tornar-se mais lucrativas. Desta forma, deparam-se com a extrema necessidade de conseguirem reduzir os seus custos e de aumentarem o valor que proporcionam aos seus clientes. Torna-se, assim, necessária uma compreensão clara do valor real que cada produto gera para a sua empresa.
É neste sentido, e com o objetivo de conseguir trazer uma mais-valia ao mundo organizacional, no que toca a ferramentas que auxiliem a gestão de custos, que surge o tema deste projeto: aplicação do modelo de custeio Activity-Based Costing numa empresa de serviços (mais concretamente, de consultoria), e consequente análise complementar. Todo este projeto será então desenvolvido com base numa empresa piloto, Winning Management Consulting, que servirá de suporte à análise efetuada, bem como de ajuda à identificação de pontos de melhorias do modelo.
Após estudo intensivo da empresa em questão, o modelo de custeio em análise foi adaptado, de modo a se enquadrar no contexto real da Consultora, seguindo-se a sua respetiva aplicação.
Primeiramente, foram definidos os reais “produtos” da empresa, de modo a conseguir alocar todos os custos existentes (Diretos e Indiretos) a cada um deles. Ficaram assim definidos, como produtos, os Centros de Competência nos quais a empresa estava dividida, durante o período de análise: Project Management Competency Center,
Business Analysis Competency Center e Benefits Management Competency Center. Todo
o tipo de serviço facultado pela empresa encontra-se sempre enquadrado num destes três Centros, motivo pelo qual foram assim definidos.
No que toca à identificação dos custos indiretos incorridos pela empresa, e uma vez que estamos perante uma empresa de serviços, foram considerados todos os inerentes aos processos de “suporte”, que são transversais à atividade da empresa, e que permitem o
funcionamento da mesma. Estes processos são dez, e traduzem-se nas principais áreas de suporte da Consultora. São: o Business Development Office, o Finance Office, o General
Management Office, o Human Capital Office, o Information and Communication Technologies Office, o Management School Office, o Office Management, o Marketing Office, o Project Management Office e o Quality and Compliance Office.
Estando todos estes processos devidamente identificados, procedeu-se à respetiva alocação de custos aos “produtos” finais. A estes, foram somados todos os custos diretos relacionados com cada um dos três produtos, o que permitiu, posteriormente, o apuramento do verdadeiro custo de cada um, e o peso que estes detêm nos custos totais da Winning.
Concluiu-se então que, o Centro de Competência que possui o maior peso nos custos totais da empresa é o Project Management Competency Center, que incorre em 131.541,44 € mensais, o que corresponde a 59,0% dos custos totais. A este, segue-se o
Business Analysis Competency Center, com 79.855,33 € mensais, correspondente a
35,8% dos custos totais. Por fim, o Centro de Competência com menores custos é o de
Benefits Management Competency Center, com apenas 11.521,11 € mensais, o
correspondente a 5,2% dos custos totais.
Com isto, e contrabalançando com as receitas obtidas em cada um destes Centros de Competência, foi possível perceber qual é o verdadeiro retorno de cada um deles (através do Benefit-Cost Ratio – BCR).
As conclusões obtidas, nesta análise, revelaram não ser tão lineares quanto as obtidas na análise anterior dos custos. O Benefits Management Competency Center é o Centro de Competência que maior retorno proporciona à empresa, uma vez que, por cada euro investido neste Centro, são gerados 1,31 euros (o que se traduz num lucro de 31 cêntimos por cada euro investido; BCR=1,31). De seguida, encontra-se o Centro de Project
Management, que proporciona um retorno de 30 cêntimos, por cada euro investido
(BCR=1,30). Em último lugar, encontra-se o Business Analysis Competency Center, que provoca um retorno negativo à empresa, dado que, por cada euro investido, este centro recupera apenas 0,98 cêntimos (BCR=0,98, o que corresponde a um retorno de -2 cêntimos por cada euro investido).
Em paralelo, foi ainda conduzida uma segunda análise, complementar ao modelo ABC, de forma a conseguir entender o retorno, não só dos principais Centros de Competência,
mas sim de todos os processos que suportam toda a atividade da Winning (e assim conseguir atuar sobre os mesmos). Deste modo, cada uma das áreas de suporte foi decomposta em processos menores (já definidos, a priori, pela empresa), o que, posteriormente, permitiu uma atuação mais precisa e direta. Para esta análise, foram então apurados os custos de cada um destes processos, bem como o impacto que cada um tem no running of the business da empresa. Após contrabalançar, novamente, cada custo com o respetivo impacto (ou benefício), foi possível categorizar cada um destes processos em uma, de quatro categorias: Manter, Eliminar, Reduzir ou Avaliar.
Desta forma, dos noventa e um processos que foram alvo de análise, foi possível concluir que: três processos deverão ser eliminados, uma vez que estão a incorrer em custos demasiados elevados, comparando com o benefício relativo que estão a proporcionar; catorze processos deverão ser alvo de análise, para redução do seu custo; trinta e um processos deverão ser avaliados, para que se tornem mais relevantes e com maior impacto na empresa; e os restantes quarenta e três processos enquadram-se na lista dos que deverão ser mantidos, uma vez que estão a proporcionar um valor relativamente alto (i.e., o impacto que têm na empresa é relativamente elevado), e estão a incorrer em custos relativamente baixos (comparando com os restantes processos da área onde estão inseridos).
Chapter 1 - Definition of the Problem Context
The business world is a market that expands really fast. Theories/models that companies have been applying in their business strategies are constantly being updated as the market evolves. Strong competition and the enormous technology innovation, together with the demanding market that we are facing, lead companies to develop new approaches and drive them to update these new instruments of management (Kaličanin & Knežević, 2013). In order to companies achieve business success in such a competitive environment, the priority should always be the customers’ satisfaction. This implies either having lower total costs (which drives companies to compete against each other for the lowest practiced prices), or providing the customer with an exceptional level of added value, in comparison to the competition (competing for the differentiation of the products). There is also a third alternative that relies on the best combination of these two: lower costs with great level of added value (differentiation), which is known as Best Cost Strategy.
However, whatever the strategy companies consider to be the best for them, there are certain information that should always be studied and taken into account in order to the management to take the right decisions. Inaccurate information, specifically on costs, may outcome in decision-making mistakes and consequently, the loss of the competitive advantage.
According to this, companies have been perceiving that there is a growing need on finding more efficient management techniques, including those to manage costs. One of those methods is the so well-known Activity-Based Costing, which lays down on the type of management that is based on the ongoing activities of a company. Nevertheless, this model is mostly being applied on companies that produce physical goods and that have a well-defined production line. But what about service companies (namely, the Consultancy)? Is it so linear to apply it in this kind of organizations? Does it provide enough information to these companies, in order for them to ascertain about the right decisions to make? Is this analysis enough for this kind of companies?
This project aims to apply ABC model in a consulting organization and also to understand how the adaptability to this kind of companies should be performed, by having Winning Management Consulting as a pilot company.
Chapter 2 - Literature Review
As explained in the previous topic, there is a specific methodology/technique that is focused on managing the company and taking decisions based on cost management – the Activity-Based Costing model. This model is considered to be included in a particular type of management that is based on the ongoing activities of a company. Later on, other management approaches have emerged with the same principles, such as the Activity-Based Management, which was defined as a systematic method of planning, control and improvement of labor and indirect costs, being focused on the concept of "activities consume costs" (Rof & Andreica, 2011). It is also characterized by including a detailed analysis of the company in order to eliminate activities that do not increase the useful value of the product (Kapić, 2014).
The following topics aim to elucidate about the most important points regarding ABC model. In addition, after understanding the critical points of ABC and in order to furthermore improve the model, we will explore another variable that is crucial to take into account today’s changing environment: the benefits.
2.1. Activity-Based Costing Origins & Definition
The Activity-Based Costing method was originated in the U.S., in the paper entitled “The Hidden Factory”, being its authors Jeffrey G. Miller and Thomas E. Vollmann, who stated that to control indirect costs it is necessary to identify the causes that generated these costs (Radu, 2013).
By definition, the ABC is a Costing method that first assigns costs to activities and then assigns them to products based on the products’ consumption of activities (Lanen, Anderson, & Maher, 2011).
Figure 1 – General Structure of the ABC model (Noreen, Brewer, & Garrison, 2011)
The model states, as represented in the chart, that cost objects (such as products and customers) generate activities; such activities consumes resources; and the consumption of resources causes costs (Noreen et al., 2011).
It is then possible to understand that activities have a central role in all this process. It is crucial, for each product, to draw not only the list of directly consuming activities but also those generated by these activities (Rof & Andreica, 2011).
To sum up, Activity-Based Costing attempts to trace through these relationships in order to identify how products and customers affect costs (Noreen et al., 2011).
Designing an Activity-Based Costing System Successfully
According to Noreen, Brewer, & Garrison (2011), in order to successfully implement an Activity-Based Costing system, there are three essential characteristics that companies must follow: first, top managers must strongly support the model implementation, as their leadership has an active role in motivating all employees to embrace and understand the need of change. Then, the management should ensure that ABC data is linked to the evaluation and remuneration of the employees, because if they continue to be evaluated and rewarded through a non-ABC cost data, the message they will retain is that ABC is not important and they will quickly leave it. Last but not least, the company should create a cross-functional team so that it can design and properly implement the ABC system. This cross-functionality should be achieved by including representatives from each area that will be in touch with ABC data. This is an important issue as each one of these cross-functional employees own a very deep and specific knowledge of the different operations of the organization, which proves to be a critical factor for designing an effective ABC system.
Cost objects Activities
Consumption of resources Cost
Benefits & Advantages
Regarding ABC’s benefits and advantages, according to Maher (1997) this method allows companies to determine the informational basis for taking action, in order to reduce resource consumption, without compromising quality and performance characteristics of the product. It also allows companies to strengthen its overall competitive advantage by providing a very reliable and accurate information to the management (Kapić, 2014). From the perspective of Rof & Andreica (2011), it is possible to perceive another kind of benefit, as it helps on: identifying the causes of low and negative performance; eliminating the damage limits of the cost of product by separating the productive from the unproductive components of the company; identifying the real players in the overall performance of the entity; identifying the contribution of each component to the entity’s business.
In conclusion, ABC can be seen as a sophisticated way of allocation overhead costs to cost objects in the sense that it is consistent with the principle of causality. This means that general costs are allocated to activities over the causes of costs (named cost drivers). Thereafter, in order to obtain accurate information from the ABC application, it is extremely important to identify, define and classify very clearly every single activity, as these represent the components of the entire business process.
Application of the Model
The application of the model requires the company to follow five (main) steps (according to Noreen, Brewer, & Garrison (2011)). These are as follows:
a. Define activities, activity cost pools, and activity measures
As said previously, activities play a central role in ABC model. As such, and because these will be the foundation of the system, the definition of activities proves to be the major step in implementing an ABC system. An activity is then defined by being "a set of complementary basic tasks facing an end”(Rof & Andreica, 2011: 88) or, in other words, it is any discrete task that an organization undertakes to make or deliver a product or service (Lanen et al., 2011).
Since defining activities can be a difficult and complex process, a common procedure that is followed in order to define them is making interviews in overhead departments in order to ask people to describe their major activities. As this technique may lead to a huge list of
activities, what happens is that they are usually aggregated according to their similarities (highly correlated activities are often combined).
Another concept that also needs to be defined is the Activity Cost Pool. A cost pool is defined by being the type of cost we want to assign to the cost objects (which can be products or services) (Lanen et al., 2011).
Regarding the Activity Measures, these are also known as Cost Drivers, as they are the factor that explains the cost variation, by being the activity’s reference size, used for the allocation of indirect costs (Radu, 2013).
b. Assign overhead costs to activity cost pools.
In order to assign and allocate overhead costs to the activities cost pools obtained in the previous phase, it is necessary to use a technique named first-stage allocation. This tool is defined as the process of assigning functionally organized overhead costs derived from a company’s general ledger to the activity cost pools.
This allocation is usually based on the results of the interviews with employees that are constantly in touch with the activities. However, it is also important to speak with the management, as it can help the ABC team on the understanding about how some indirect costs should be distributed across the activity cost pools.
c. Calculate activity rates
For this step, the ABC team should identify the total activity, for each cost pool, that would be necessary for the company to present its products or services to its customers.
Activity rates are then computed by dividing the total cost by the total activity, for every single activity.
However, there may be some outliers on the sample of activities, as to some of them may not be possible to compute its activity rate. These outliers consist of organization-sustaining costs and costs of idle capacity that should not be allocated to products/services and customers.
d. Assign overhead costs to cost objects using the activity rates and activity measures This phase is also known as the second-stage allocation. In this step, activity rates are used to distribute the overhead costs to products/services and/or customers. Therefore, for each activity, the rate is then multiplied by the respective activity’s value.
Here, there may be found some incoherence in the data, as the total amount of overhead costs assigned to products may not match the total amount of overhead costs in the ABC system. If this happens, it shall be due to the previously explained occurrence: outlier activities for which is not possible to compute activity rates, as they are not caused by products.
e. Prepare management reports
It is important to obtain reports from the ABC application, as they may be a useful tool for the management when making decisions. The most common reports are related to the product/service and customer profitability. With this kind of report, companies may channel their resources to their most profitable growth opportunities and, at the same time, highlighting products and customers that drain profits.
In practice, and in order to correctly develop this reports, it is necessary to obtain the product/service margin, which is a function of the product’s sales and the direct and indirect costs caused by the product. Therefore, the company will need to gather each product’s sales and direct costs, in addition to the overhead costs previously computed. One thing that is important to keep in mind is that, for this computation it will not be possible to include the costs that are not caused by products/services. These will only be considered afterwards, in the computation of the company’s net operating income. In addition, the report may include the customers margin, i.e., how much is each customer contributing to the total profitability of the company. Therefore, if the company does this analysis for all its customers, it will be able to cultivate relationships with its most profitable customers, while taking steps to reduce the negative impact of the unprofitable ones.
The Limits of the Model
Now that we know about the steps companies should follow to successfully implement an ABC system, and all the advantages that it can provide to companies, it is wise to acknowledge that every successful model has its limits and there is, at least, one critical factor that may contribute to the failure of its implementation. This refers to the heavy volume of work in collecting the information it requires and the accuracy of the data (Rof & Andreica, 2011), as it was possible to verify from the previous topic.
2.2. Benefits Management Measuring the Benefits
There are several authors that aim to define what a benefit is. According to Bradley (2010: 102), a benefit is an “outcome of change which is perceived as positive by a stakeholder”. From this, it becomes possible to derive the definition of benefits management, which stands for “an approach to identify, plan and manage the delivery of benefits” (Eckartz, Katsma, & Maatman, 2012: 4642).
The need of organizations to focus on these benefits has, in fact, demonstrated to be fundamental to management’s theory and practice, as the benefits management approach complements most of the common project management methodologies (Breese, 2012). However, the majority of these methodologies focus on how to comply with three parameters - time, cost and quality - instead of identifying the positive outcomes and benefits for an organization (Karamitsos, Apostolopoulos, & Bugami, 2010).
In addition, many authors have developed several theories regarding this benefits management approaches. According to Jenner (2011), there are a set of prescriptions for an appropriate benefits management that we must take into account, which are summarized into the following:
1. Ensuring that benefits claims are robust and realizable; 2. Identifying and capturing all forms of value created; 3. Realizing benefits and create value.
Nevertheless, companies do not show much concern regarding this study and proper identification of benefits when making investments, as according to Senturia, Flees, & Maceda (2008), around 70% of business projects still fail.
And it is due to this that developing business cases before making investments are considered such an important tool for companies to use nowadays. Therefore, it can be seen as the first step for developing a proper benefits management, as it allows companies to detect what is the best arrangement for an initiative to potentiate its benefits (Pereira, 2014a).
As such, not using this tool tends to lead companies to fail in the achievement of the desired benefits and consequently the creation of value, as in any investment’s scope it is absolutely necessary to «measure what is relevant» (Pereira, 2014a).
Regarding the identification of benefits, previously defined as the first step for a proper benefits management, this can be analyzed in two different ways: first, qualitatively, and after that, quantitatively.
Regarding the first type, it is important to retain that every time companies decide to start a new project, they are looking for one of the following dimensions, or a combination of them: increase in revenues, cost reduction and efficiency (or sometimes, just to be in legal compliance, but in that case they are just changing their business to be in line with the law) (Pereira, 2014a).
There are several ways to achieve this three (four) benefits, and each one of them depends on the kind of strategy the company decides to follow. Regarding the increase in revenues, it can be achieved through an increase in the number of customers, by exploring new markets, by retaining the actual customers through loyalty programs, or by doing product cross or up selling. In relation to cost reduction, it can be reached either by decreasing the current costs, or by preventing an increase in the future costs. Last but not least, regarding the efficiency increase, it can be achieved by releasing human capital, who will be able to do the same with less effort (Pereira, 2014a).
In relation to the computation of the quantitative benefits, there are three steps that must be followed in order to accurately define them. These are:
The kind of data that is necessary to obtain;
The source of that data – where is it available and who has access to it; The technique that best fits the collection of the data.
Among the several techniques that may exist to collect data, these shall be selected according to the type of data (and accuracy) one wants to obtain. These may include interviews, document analysis, surveys, or any other kind the manager considers to be useful to attain the desired information (Pereira, 2014a).
In conclusion, and as stated by Robert M. Grant (2010), business is about creating value, and so the purpose of business is, in the first place, to create value for customers. After that, it becomes possible to extract some of that customer value in the form of profit,
thereby creating value for the firm. This is why it is so important nowadays to keep changing and growing the business, along with the market evolution.
Achieving the real benefits
Keeping in mind what has just been said, it is worthless to achieve a million of benefits, if to reach those we had to incur in the double of the costs. Therefore, in order to ascertain about the real value of each investment, project, or any other kind of benefits one is measuring, it is necessary to compute the net benefits (comparing those benefits to the costs they had implied).
There are several tools (indicators) that help companies on performing this comparison. The most common ones are ROI (Return on Investment) and BCR (Benefit-cost ratio), Net Present Value (NPV), Payback, among others (Pereira, 2014a). However, as this dissertation does not focus on occasional projects, the most relevant ones are the first two (ROI and BCR).
They both measure this relation between benefits and costs, although they give us results in different perspectives: on the one hand, the Return on Investment (ROI) gives us the real return of an investment/activity, in a relative way (i.e., in percentage), by comparing all the benefits the project has provided, to the investment it had required; on the other hand, the Benefit-Cost Ratio (BCR) aims to provide the real return of an investment/activity, but in absolute values, i.e., for each euro of costs, the real benefit is x euros (Pereira, 2014a).
In conclusion, the major goal for a company is then pretty simple to understand: to increase the benefits and to reduce the costs, so that the company can boost, in the end, the ROI/BCR of its activities and consequently, the company as a whole.
The next topics aim to demonstrate the application of the model in a consulting company, which is supposed to help these kind of companies on its management approaches. As such, this will have the ABC model and the benefits management as its foundation.
Chapter 3 - Research Methodology
From the previous chapter, it was possible to verify about certain points that are still missing at the Activity-Based Costing model, in order to apply it in a consulting company. Regarding this, the main question that arises is: Can we fully apply the model to this kind of companies? The answer is no, because as we are not considering the usual goods company, in which the definition of activities and allocation of overhead costs is more straightforward, the application of the model in the Consultancy may reveal some nuances: 1. First, and regarding step a) from the literature review’s “Application of the Model” (definition of activities), as the overhead costs in the Consultancy tend to represent the supporting processes, we will consider the areas that support the business as our main “processes” (to better adapt to the company’s context, this concept will be used instead of the regular “activities”). Consequently, each main process is composed by other small processes that are related to the tasks that each area is responsible to perform. However, for the application of the ABC, only the high-level processes will be considered (as the small processes are too detailed, and it is easier for the application to consider groups of processes with the same subject).
2. Regarding step c) and d) from the same literature review’s topic (calculate activity rates and assign overhead costs to cost objects, respectively), it also needs to be adapted to this project. As said previously, we will have to consider the company’s supporting areas as our main processes. Therefore, the definition of the activity cost pools will be performed (with the designation of process cost pools), but not used for the application of the model, as it would be extremely difficult to get the total activity for each one of these. For this reason, activity rates will not be computed as well. Instead, the allocation of the overhead cost per “product” (in this case, it will not be a product but instead the groups of services provided by the company) will be performed by applying directly a cost object to the overhead costs (costs of the supporting processes).
Following this line of thought, this project has the main goal of responding to these gaps (by adapting and applying the ABC to a real consulting company). After verifying that this application is in fact possible, we will try to balance the costs obtained from the application of the model, with its respective benefits – from this, it becomes possible to obtain a Benefit-Cost Ratio, which will allow an analysis to the real return of each “product”.
In addition, besides the application of the model, this project also aims to give a significant contribute to it, as it shall provide a complementary analysis that shall be used every time the model is applied to a consulting company.
Therefore, this secondary analysis aims to improve the efficiency of companies, by providing them a tool that will help them on the management of their secondary processes. For this second part, the analysis will encompass the cost allocation and measurement of benefits of each secondary process performed by the company. However, regarding the benefits measurement on this analysis, there is another topic mentioned in the previous chapter that needs to be adapted. This is due to the difficulty that arises on following all the steps in the achievement of the quantitative benefits, specifically mentioned on step number 2 “the source of that data – where is it available and who has access to it”, as the quantitative information of each secondary process is very difficult to obtain (such as what happens on our pilot company, as it is not available/recorded). Therefore, for this analysis we will use qualitative information instead of the quantitative one.
The following figure aims to demonstrate the differences between the Model as it is (today) and how it is meant to be (in this project), after the identified gaps are eliminated.
Figure 2 - The adaptation of ABC Model to a consulting company after the elimination of the identified gaps1
1 Source: Compiled by author
In the Literature Review
Define Activities, Activity Cost Pools and Activity Measures
Assign Overhead Costs to Activity Cost Pools
Compute Activity Rates
Assign Overhead Costs to Cost Objects using Activity Rates and Activity Measures
Prepare Management Reports
In the Applied Project
Define Processes, Process Cost Pools and Process Measures
Assign Overhead Costs to Process Cost Pools
Assign Overhead Costs to the defined Processes using Process Measures
In the further analysis, we will apply the Activity-Based Costing model in a consulting company named Winning Management Consulting. As such, the key data that will be necessary for this application regards all the costs incurred by the company.
As the company has recently changed its Organizational Breakdown Structure (OBS), and considering that there may not be the necessary data by the time this research was developed, all the data that will be used in the research will be based on the previous OBS. As such, the data included in the analysis (namely costs, revenues, number of employees, among others) will have a monthly basis, which in turn will be obtain from the average of the last three months of 2014 – October, November and December.
However, before knowing the effective costs, we shall first define the “products” of the company, as all the costs will be attributed to these.
After this, we will have to study in deep and understand the processes that compose and that cut across the entire company (these are the overhead costs – that are essential for the running of the business and therefore, for the final outputs/products). These processes shall be converted into real costs, which in turn will be assigned to each one of the final products. The attribution of each overhead cost will be held according to proper cost drivers, which in turn will be defined after a discussion with the company’s expert – Winning’s CEO. For the collection of data regarding these kind of costs, and since it is a small company and everything is well-organized, information will be obtained from several interviews with the Financial Office.
Also, in order to make the indirect costs allocation, we need to understand the whole flow of the existing supporting processes. For this, we will study and analyze Winning’s Governance Model. Later on, and after analyzing all the existing techniques, we have considered to use either the interview or the questionnaire, as this data collection is an activity that requires deep understanding of the figures and of the business itself.
In conclusion, we will use a mixture of both techniques, by using the interview to explain the participants the real goal of the research and the information we will need from them, and by using a kind of questionnaire (several templates that will be provided to the participants, asking the required information), so that the participants can fill in the templates with the necessary data without having any influence of external sources. The choice of these techniques is due to the fact that this is a very analytical activity and, as such, we will need to use techniques that shall allow the understanding in deep of the
information provided by each participant. These interviews and forms will then be conducted with people that have the enough awareness and acknowledgement of the processes that will be analyzed in this project. The selected people will be known after discussing it with Winning’s CEO, as he is the person that better knows the company and the experts of every process. As such, we will try to allocate costs in the most effective and accurate way.
After having all the indirect costs (from the supporting processes) assigned to each one of the final products, we shall ascertain about the costs that were directly incurred by each one of the considered products, in order to determine the global costs. Having these last ones defined, another interview with the financial office shall be conducted, in order to obtain data regarding the revenues.
In a second phase (after ABC is applied), we will make an analysis to the detailed processes, in order to turn the company more efficient.
Therefore, for each secondary process there will be a balance between the incurred costs and the real benefit/impact that each one of them has in the company.
For the classification of costs, we will use the information from the interviews and forms applied to each process’ accountable. After ascertaining about the real costs of each secondary process, these shall be compared within themselves (each group of processes shall be analyzed separately) and translated into a scale from 0 to 1 (being 1 the most expensive one).
Regarding the measurement of the benefits, this information will be obtained by using the same methods. As the necessary information shall be qualitative, interviews and forms shall also be the best techniques to use, in order to obtain reliable information regarding the real impact of each process in the company.
This qualitative information can be resumed into a classification, in a scale from 0 to 3 (being 0 “not having any impact at all” and 3 “having a lot of impact”), of each secondary process in each of the three categories of impacts – Business Impact (Loss Margins, Loss Revenues, Loss Clients, Loss Image), Efficiency Impact (More Rework, More Scrap, More Work, More Time), Compliance Impact (Big Penalty, Penalty, Big Incongruence, Incongruence).
After collecting this data, and in order to be able to compare the benefits with the costs, these benefits/impacts shall also be translated into a scale from 0 to 1 (being 1 the most impacting process).
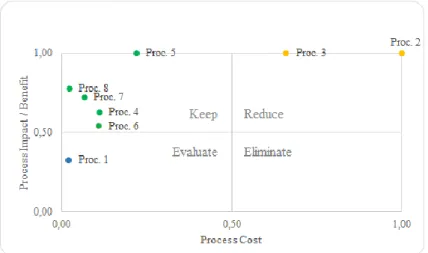
Having the costs and the benefits/impacts in the same unit of measure, these shall be compared, in order to verify what the real cost-benefit ratio is (for a better perception, these values will be placed in a scatter plot).
Chapter 4 - Data Collection and Analysis
4.1. Winning’s Brief Presentation
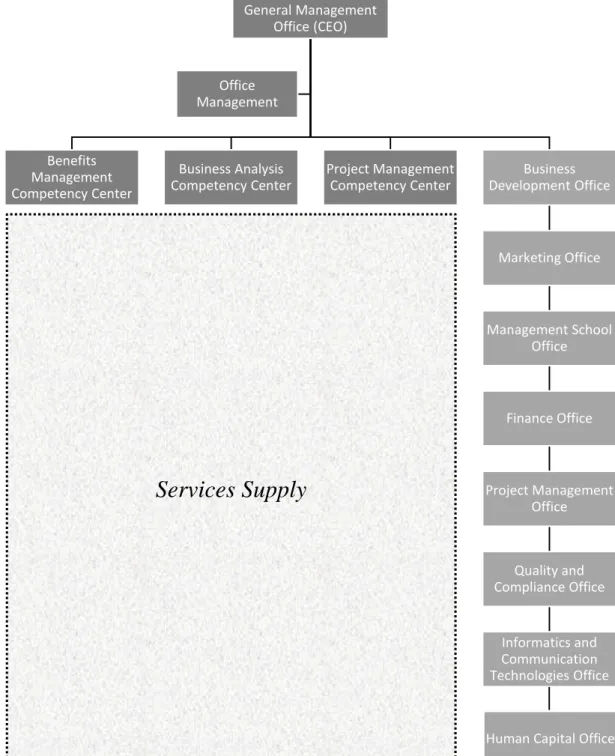
As we are considering a service company, it is crucial to analyze Winning Management Consulting’s Organizational Breakdown Structure in order to fully understand the workflow of the company. It relies on the principle of process’ management, which means that each process has an assigned accountable that assures its good standing. In addition, this does not mean that he/she cannot take part on other processes with different functions and responsibilities (Pereira, 2014b).
Winning’s OBS follows a matrix structure, being the first line of direction and corporative management functional and stable (Pereira, 2014b).
Nevertheless, there are three groups of processes at Winning (Pereira, 2014b):
Core Business Processes, which are the set of processes which main mission is the delivery of value to clients, through the supply of services. The range of services provided by Winning can be translated into the three main competency centers that compose the company: Project Management Competency Center (PMCC), Business Analysis Competency Center (BACC) and Benefits Management Competency Center (BMCC). All the services acquired by clients are always associated to one (or more) of these three.
Support Business Processes, which are the set of processes which main mission is the management of opportunities that exist in the market, in order to assure the business continuity. These processes are translated into a single office that is called Business Development Office (BDO).
Support Organizational Processes, which are the set of processes which main mission is to support, facilitate and provide the necessary conditions for the course of the business. These processes include several offices, such as the Finance Office (FIN), Human Capital Office (HCO), Marketing Office (MKO), Management School Office (MS), Project Management Office (PMO), Quality and Compliance Office (QCO), Office Management (OM) General Management Office (GM) and Informatics and Communication Technologies Office (ICT).
The following figure aims to demonstrate the relation between all the offices, previously described:
Figure 3 - Winning's Organizational Breakdown Structure2
Now that we have a general idea of what the company is and how it is composed, it becomes possible to understand the application of ABC model, such as follows.
2 Source: Compiled by author
General Management Office (CEO) Benefits Management Competency Center Business Analysis Competency Center Project Management Competency Center Business Development Office Marketing Office Management School Office Finance Office Project Management Office Quality and Compliance Office Informatics and Communication Technologies Office
Human Capital Office Office
Management
4.2. Application of the Model
Step 1 - Defining the “Products” of the Company
As we are dealing with services and not with goods, there will be a complexity on unveiling the real outputs of the company, as the projects/services that are supplied to customers are always changing and are inconsistent (and consequently, difficult to define). Having said this, and in order to simplify the complexity of the model, we will consider the three core business processes (PMCC, BACC and BMCC) as the final outputs, which comprehend all the services provided by the company to the customers.
Now, in order to understand the real costs of each Competency Center and consequently, each one’s contribution to the total costs incurred by Winning, it is important to distinguish the direct from the indirect costs. As the direct costs are easier to compute, let us start with the indirect ones, by applying the ABC Model.
Step 2 - Defining the Processes (Activities)
As we already know, besides the core business processes, Winning has the support processes, which are divided into the Support Business Processes and the Support Organizational Processes.
In Winning’s specific scope, these processes are the ones that support and assure the running of the main business. These are transversal to the three main competency centers as they are the ones that support and assure their continuity.
Although these processes are detailed into smaller ones in the governance model, in order to facilitate the application of the model, only the main processes will be considered. These are as follows:
Business Development Office (BDO) – Aims to assure the business continuity, ensuring the customers’ satisfaction;
Finance Office (FIN) – Aims to assure the management of Winning’s financial resources, ensuring the financial capability for the continuity of the business; General Management Office (GM) – Aims to assure the correct management of the
company;
Human Capital Office (HCO) – Aims to assure the performance of all the activities that are related to the human resources of the company;
Informatics and Communication Technology Office (ICT) – Aims to assure the management of all the activities that are related to the technological resources of the company;
Management School Office (MS) – Aims to assure the functioning of the activities that are related to the training Winning provides to its clients and to its own employees;
Office Management (OM) – Aims to assure the management of Winning’s physical spaces (the office);
Project Management Office (PMO) – Aims to assure the management of all the projects that are being performed/services that are being supplied;
Marketing Office (MKO) – Aims to assure the performance of all the activities that are related to marketing;
Quality and Compliance Office (QCO) – Aims to assure the audit of internal procedures, in order to stablish a certain level of quality.
Nevertheless, the detailing of all these activities will be performed furthermore.
Step 3 - Data Collection (Indirect Costs)
In order to successfully allocate the overhead costs incurred by Winning into the main three competency centers, it is necessary to make the already mentioned first-stage allocation.
To do this, and in order to better understand the numbers, these overhead costs were classified into different groups (process cost pools). Having said this, these were divided into the following six cost sources:
Staff Costs, which are translated into the wages of the employees that work for each process. These costs will also include the cost of computers and cellphones, as these are costs that are specifically intended for employees. For the computer, we use will the same depreciation rate used by Winning, which according to the ICT accountable corresponds to 25% a year (which translates into a useful life of 4 years). From this, we can ascertain about the monthly costs (by dividing the entire cost of the computer by 48 months). Regarding the cellphone, every employee are entitled to have one. However, the plafond of each one depends on the role of the employee on the company. These were considered according to the employees that belong to each supporting process;
Material Costs, which are the physical materials that are used/consumed by the supporting processes;
Renting Costs, which are the costs incurred by the supporting processes, in case they have equipment or any other properties that are being rented;
Suppliers Costs, which are translated into the payment to suppliers (from several sources);
Licenses, which are the costs of external authorizations, necessary to the course of the processes;
Other, which are all the other costs that do not fit in the previous groups.
In order to accurately ascertain about the costs of each one of the supporting processes, the collection of data was conducted by gathering the costs of three consecutive months (last three months of 2014 – October, November and December), and then a monthly average was made (for more details, see annex A).
It is also important to refer that, as said previously, employees can take part on different processes at the same time. In Winning’s particular case, this means that some employees that are working on projects may also work on specific supporting processes. In fact, this means that staff costs collected for these processes will depend on the time each employee dedicates to these supporting processes. These values were obtained after knowing the employees that work for each process, and then discussing with them the percentage of his/her time spent with these processes, per month. After knowing these percentages, each wage was assigned to the respective process, in the indicated proportion. These percentages can be found in annex B.
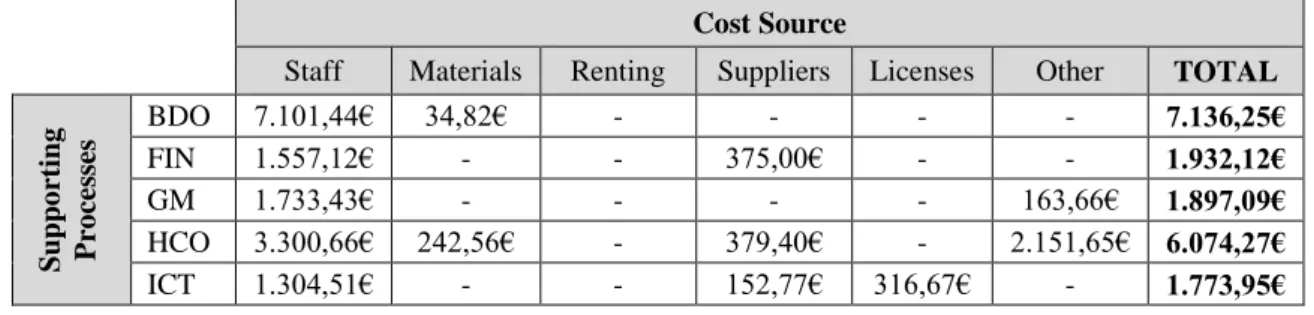
Having said this, and after collecting the remaining data along with the finance office, all this information was organized, in order to demonstrate the average costs incurred by each one of the previously described processes. The information was organized as displayed next:
Table 1 - Monthly Costs per Supporting Process and Cost Source
Cost Source
Staff Materials Renting Suppliers Licenses Other TOTAL
Su pp o rt ing P ro ce ss es BDO 7.101,44€ 34,82€ - - - - 7.136,25€ FIN 1.557,12€ - - 375,00€ - - 1.932,12€ GM 1.733,43€ - - - - 163,66€ 1.897,09€ HCO 3.300,66€ 242,56€ - 379,40€ - 2.151,65€ 6.074,27€ ICT 1.304,51€ - - 152,77€ 316,67€ - 1.773,95€
MS 1.034,84€ 290,07€ - 7.006,45€ - - 8.331,35€ OM 232,03€ 157,05€ 4.910,17€ 871,04€ - - 6.170,29€
PMO 834,27€ - - - 834,27€
MKO 1.375,04€ 17,41€ - 835,00€ 38,00€ - 2.265,44€
QCO 161,65€ - - - 161,65€
Source: Compiled by author
Step 4 – Choosing a proper cost driver
Having the previous data already well-defined, it is now necessary to properly allocate all these costs to the three main competency centers.
As this is a service analysis, it is very difficult to accurately say how many hours a person or a machine is dedicated to perform an activity. Therefore, the activity rates cannot be computed as it is described in the theory.
In order to distribute all these costs over the main outputs of the company, we will choose a proper cost driver, for each process. These should be directly related to the process and will help on directing the cost to its correct source, in the right proportion.
The cost driver that will be used in each process was discussed with the company’s expert, and it was concluded to be as follows:
- For the Business Development Office, we will use the global revenues, as this process has its main goal of increasing the revenues for each competency center, and so the working hours spent on exploring opportunities for each CC are directly related to the amount of revenues earned by each.
- For the Finance Office, we will use as the global revenues, the working time spent on each CC depends on the number of projects and consequently, the global revenues of each.
- For the General Management Office, we will use the global revenues, as this process involves a constant looking for new market gaps and developing new relationships with clients, and so depending on the spent time on each center the more revenues it will bring to the company.
- For the Human Capital Office, we will use the total number of employees, as the time spent on this process depends on the people that belong to each center. - For the Informatics and Communications Technology Office, we will use the total
number of employees, as the work required on this process is more or less demanding depending on the number of employees on each CC.
- For the Management School Office, we will use the total training revenues, as the work demanded on this process depends directly on the revenues earned by this kind of services on each CC.
- For the Office Management, we will use the total number of employees, as the costs incurred by the company regarding the office are directly related to the people that are not allocated to clients and therefore are working in the headquarters of the company. As the people on the office are constantly changing (depending on the projects that are occurring), we cannot assure about the percentage of people from PMCC, BACC or BMCC that are using the office. Having said this, we will use the total number of employees on each center to make an interpolation.
- For the Project Management Office we will use the total number of employees, as the work demanded on these processes depends directly on the number of employees on each center.
- For the Marketing Office we will use the global revenues, as the costs incurred by these processes have the main goal of increasing the revenues of each center. - For the Quality and Compliance Office we will use the total number of employees,
as these control activities will be more or less demanding, depending on the number of employees on each center.
In conclusion, we will use three different types of cost drivers: total number of employees, global revenues and revenues from training.
Step 5 – Allocating the Indirect Costs to the Main Competency Centers
Having the cost drivers defined for each secondary process, it becomes possible to distribute the total costs of each one of these (described in Step 3) among the three main competency centers of the company.
In order to make this distribution, we will need to know the total number of employees in each center, the global revenues earned by each center, and the training revenues earned by each center.
Regarding the first one (total number of employees), again a previous analysis was made, in which we could verify about the number of employees in each CC for the last three months of 2014. After that, a monthly average was made (rounded to units).
In relation to the number of people in the Benefits Management Competency Center (BMCC), there were three people in October, November and December. Therefore, for the center of Benefits Management there was an average of three people.
In relation to the number of people in the Business Analysis Competency Center (BACC), there were thirty-two people on October and November and thirty-four people on December, which brings us to the rounded average of thirty-three people on this center. In relation to the number of people in the Project Management Competency Center (PMCC), there were forty-four people in October and forty-three people in November and December, which brings us to the rounded average of forty-three people on this center. In conclusion, we will consider further on:
- Three (3) people in the Benefits Management Competency Center - Thirty-three (33) people in the Business Analysis Competency Center - Forty-Three (43) people in the Project Management Competency Center
As we have seen before, the processes that are depending on this cost driver are: Human Capital Office, Informatics and Communications Technologies Office, Office Management, Project Management Office and Quality and Compliance Office.
The cost of each process was then allocated to the three center in different proportions (as one can see in Table 2). For the computation of each one, the following formula was used:
(𝑥) 𝐶𝐶 =𝑇𝑜𝑡𝑎𝑙 𝑃𝑟𝑜𝑐𝑒𝑠𝑠 𝐶𝑜𝑠𝑡∗𝑛𝑟.𝑒𝑚𝑝𝑙𝑜𝑦𝑒𝑒𝑠 𝑖𝑛 𝑡ℎ𝑒 (𝑥) 𝐶𝐶
𝑇𝑜𝑡𝑎𝑙 𝑛𝑟.𝑜𝑓 𝑒𝑚𝑝𝑙𝑜𝑦𝑒𝑒𝑠 (1)
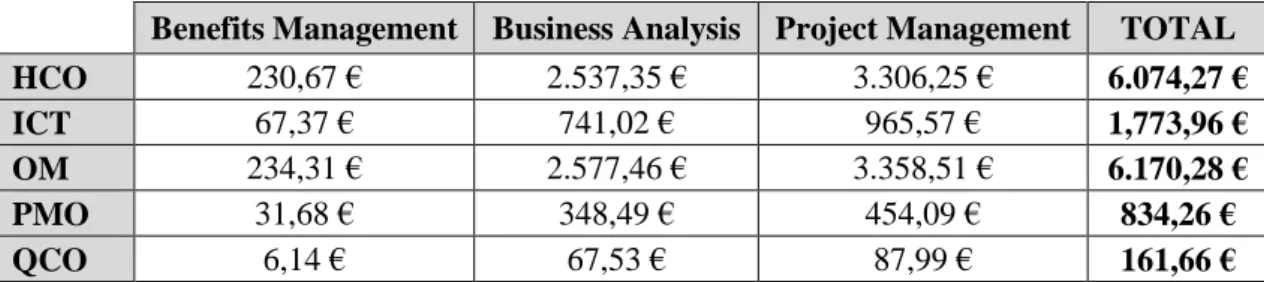
The results for each process were as follows:
Table 2 - Cost Allocation (among the three main Competency Centers) of the Processes that use the number of employees as its cost driver
Benefits Management Business Analysis Project Management TOTAL HCO 230,67 € 2.537,35 € 3.306,25 € 6.074,27 €
ICT 67,37 € 741,02 € 965,57 € 1,773,96 €
OM 234,31 € 2.577,46 € 3.358,51 € 6.170,28 €
PMO 31,68 € 348,49 € 454,09 € 834,26 €
QCO 6,14 € 67,53 € 87,99 € 161,66 €
Source: Compiled by author
Regarding now the second cost driver (global revenues), this information was provided by the Finance Office, which allowed us to understand the global revenues earned by each