Physiology and production of naturally-colored cotton
under irrigation strategies using salinized water
Lauriane Almeida dos Anjos Soares(1), Pedro Dantas Fernandes(1), Geovani Soares de Lima(1),
Marcos Eric Barbosa Brito(2), Ronaldo do Nascimento(1) and Nair Helena Castro Arriel(3)
(1)Universidade Federal de Campina Grande, Campus Campina Grande, Rua Aprígio Veloso, no 882, Bairro Universitário,
CEP 58429-900 Campina Grande, PB, Brazil. E-mail: laurispo.agronomia@gmail.com, pdantas@pq.cnpq.br, geovanisoareslima@gmail.com, ronaldon453@gmail.com (2)Universidade Federal de Sergipe, Campus do Sertão, Rodovia Engenheiro Jorge Neto, Km 3, s/no,
CEP 49680-000 Nossa Senhora da Glória, SE, Brazil. E-mail: marcosericbb@yahoo.com.br (3)Embrapa Algodão, Rua Osvaldo Cruz,
no 1.143, Centenário, CEP 58428-095 Campina Grande, PB, Brazil. E-mail: nair.arriel@embrapa.br
Abstract – The objective of this work was to evaluate the effects of irrigation management strategies, using low (0.8 dS m-1) and high (9.0 dS m-1) salinity water, on the physiological processes, production variables, and fiber productivity of naturally-colored cotton (Gossypium hirsutum) genotypes during different phenological stages. Three naturally-colored cotton cultivars (BRS Rubi, BRS Topázio, and BRS Safira) were subjected to seven irrigation management strategies, in a 3x7 factorial arrangement, in a randomized complete block design with three replicates. Plants were cultivated in pots in a protected environment. Gas exchange, chlorophyll a fluorescence, fiber production, and productivity and yield variables were evaluated. Salt stress causes greater reductions in gas exchange in natural cotton plants during the production stage. Plume cotton production is not compromised by the use of highly salinized water during the initial developmental stages of naturally-colored cotton.
Index terms: Gossypium hirsutum, fiber productivity, quantum yield, salinity.
Fisiologia e produção de algodoeiro naturalmente colorido
submetido a estratégias de irrigação com água salinizada
Resumo – O objetivo deste trabalho foi avaliar os efeitos de estratégias de manejo da irrigação, com água de baixa (0,8 dS m-1) e alta salinidade (9,0 dS m-1), sobre os processos fisiológicos, as variáveis de produção e o rendimento de fibras de genótipos de algodoeiro (Gossypium hirsutum) naturalmente colorido, em diferentes fases fenológicas. Foram avaliadas três cultivares de algodoeiro colorido (BRS Rubi, BRS Topázio e BRS Safira), submetidas a sete estratégias de manejo de irrigação, em arranjo fatorial 3x7, em delineamento de blocos ao acaso, com três repetições. As plantas foram cultivadas em vasos, em ambiente protegido. Foram avaliadas trocas gasosas, fluorescência da clorofila a, e variáveis de produção e de rendimento de fibra. O estresse salino ocasiona maiores reduções nas trocas gasosas do algodoeiro durante a fase de formação da produção. A produção de algodão em pluma não é comprometida pelo uso de água de alta salinidade nas fases iniciais de desenvolvimento do algodoeiro colorido naturalmente.
Termos para indexação: Gossypium hirsutum, rendimento de fibra, eficiência quântica, salinidade.
Introduction
Salinity is considered one of the main limiting factors for agricultural productivity and sustainability, especially in arid and semiarid regions characterized by elevated evapotranspiration demand, reduced rainfall, reduced water availability, and soil resources with variable salt content (Dong et al., 2010). In these regions, it is essential to generate technology that enables the use of water with salinity restrictions
for crop irrigation, taking into account that highly salinized water increases soil salinity due to ion accumulation in the root zone (Letey & Feng, 2007).
to nutritional imbalances, since excessive amounts of Na+ in the soil solution result in absorption disorders
that affect other nutrients, particularly Ca, Mg, and K (Rosales et al., 2012).
Cotton (Gossypium hirsutum L.) plants are capable of adapting to semiarid environments due to their tolerance to salt stress of up to 5.1 dS m-1 for irrigation
water (Ayers & Westcot, 1999; Oliveira et al., 2013). Despite this tolerance, several researchers have reported negative effects of salinity on naturally-colored cotton plants (Santos et al., 2016; Lima et al., 2017; Silva et al., 2017). It should be noted, however, that the level of tolerance to salinity may vary among species and/or genotypes of a species, or even among the phenological stages of a same genotype (Neves et al., 2009).
Previous studies on the use of salinized water for cotton irrigation have evaluated in which developmental stage the physiological processes and, consequently, cotton production were less affected (Chen et al., 2010; Zhang et al., 2013). In white plume cotton plants, different results were obtained according to genotype, soil, and climate conditions; at times, plants were more susceptible during germination and initial plant growth and, at others, during flowering and fructification (Khorsandi & Anagholi, 2009).
However, the effects of salinity during each developmental stage of cotton plants and the reproductive compensation after salt stress exposure are still poorly understood. This shows the importance of studies on the recovery of cotton plants after salt stress during each developmental stage, from germination to production (Ashraf et al., 2008; Shaheen & Shahbaz, 2012). Physiological and production aspects should be considered when selecting new tolerant materials; salt ions, for example, may affect the photosynthetic and production apparatuses, which may be related to cotton fiber productivity.
The objective of this work was to evaluate the effects of irrigation management strategies, using low (0.8 dS m-1) and high (9.0 dS m-1) salinity water,
on the physiological processes, production variables, and fiber productivity of naturally-colored cotton genotypes during different phenological stages.
Materials and Methods
The experiment was conducted in a protected environment of the center of technology and natural
resources of Universidade Federal de Campina Grande, located in the municipality of Campina Grande, in the state of Paraíba, Brazil (07°15'18"S, 35°52'28"W, at an average altitude of 550 m).
Three cotton plant genotypes – BRS Rubi, BRS Topázio, and BRS Safira – were subjected to different irrigation management strategies using salinized water, in the following phenological stages: vegetative (A), from the emission of the first leaf until the anthesis of the first flower; flowering (B), from the first anthesis until the opening of the first boll; and fructification/ production (C), from the opening of the first boll until harvest.
A total of seven irrigation management strategies were applied, using water with two electrical conductivity levels (ECw): low (ECw = 0.8 dS m-1) and high salinity
(9 dS m-1), according to Lima et al. (2016). The different
strategies evaluated were: A1B1C1, irrigation with water
with low ECw during the entire cycle, identified by index 1 in the phenological stages; A2B1C1, salt stress during
the vegetative stage, represented by index 2 during stage A, with plants receiving ECw = 9 dS m-1 water from
16 days after sowing (DAS) until flowering at 37 DAS, followed by irrigation using water with low ECw until the end of cycle; A1B2C1, salt stress during the flowering
stage, i.e., irrigation with water with high ECw from 37 DAS until the beginning of fructification at 59 DAS and with water with low ECw during the remaining stages; A1B1C2, use of water with low ECw during the vegetative
and flowering stages, and with high ECw until the end of the cycle at 113 DAS; A2B1C2, irrigation with water
with high ECw during the vegetative and fructification stages, and without salinity during flowering; A2B2C1,
irrigation with salinized water during the vegetative and flowering stages, and with water with low ECw during fructification; and A1B2C2, water with low ECw during
the vegetative stage and irrigation with water with high ECw during the flowering and production stages. The experimental design was a randomized complete block in a 3×7 factorial arrangement, totaling 21 treatments with three replicates and three plants per plot.
2013), i.e., Entisol, with sandy loam texture, were placed on the screen. The soil physical-hydraulic attributes were: 38.59% total porosity; 11.48 and 2.41 kPa water content at field capacity (33.42 kPa) and permanent wilting point (1,519.5 kPa), respectively; and 1.51 available water. The other chemical and physical attributes are presented in Table 1. The pots were arranged in simple rows spaced at 1.0 m from each other; the spacing within each row was 0.6 m.
Base dressing was performed using N-P-K, according to recommendations for experiments in pots (Novais et al., 1991); a total of 100 mg kg-1
N as ammonium sulfate, 300 mg kg-1 P as single
superphosphate, and 150 mg kg-1 K as potassium
chloride was applied. The base dressing provided the full amount of P, but only 1/3 of N and K; the other 2/3 were applied through irrigation water at 45 and 65 DAS. In addition, 500 g worm castings were added to each pot. Foliar fertilization was done at the beginning of the flowering stage at 45 DAS, in order to improve plant nutrition, using a commercial product containing: 0.05% B, 0.5% Cu, 0.5% Fe, 0.05% Mn, 0.02% Mo, and 0.5% Zn.
The water used for low-salinity irrigation (0.8 dS m-1)
was obtained by diluting the water supplied by the public system of Campina Grande, in the state of Paraíba, Brazil, with rain water; the preparation of the water with high ECw (9.0 dS m-1) and of the irrigation
managements was similar to that described by Lima et al. (2016). Sowing was carried out after soil moisture was elevated to maximum retention in all experimental units, using low-salinity water (0.8 dS m-1) and five
seeds per pot at a 3-cm depth. Thinning was performed at 30 DAS, and only one plant was kept in each pot.
Physiological variables were evaluated at 70 and 93 DAS, when plants reached full fructification and all salinity management strategies could be included in the statistical analysis, since all salinized treatments had already started. The following parameters were assessed on the third leaf from the top of the plant: CO2
assimilation rate (µmol m-2 s-1), transpiration (mmol
H2O m-2 s-1), stomatal conductance (mol H2O m-2 s-1),
and inner CO2 concentration (µmol mol-1) using the
LCpro+ gas exchange meter (ADC Bioscientific Ltd.,
Hoddesdon, United Kingdom). The obtained data were used to estimate the instantaneous water use efficiency (WUE) (CO2 assimilation rate/transpiration)
[(µmol m-2 s-1) (mmol H
2O m-2 s-1)-1] and the intrinsic
carboxylation efficiency (iCE) (CO2 assimilation rate/
inner CO2 concentration ) [(µmol m-2 s-1) (µmol mol-1)-1].
At 93 DAS, the same leaves used for the gas exchange analysis were clipped, and, after adaptation to the dark for 30 min, a chlorophyll was determined. Initial fluorescence (Fo), maximum fluorescence (Fm), variable fluorescence (Fm-Fo), and quantum yield of photosystem II (Fv/Fm) were also obtained using the pulse-modulated fluorometer, model OS5p-Opti Science (Hansatech Instruments Ltd, Norfolk, United Kingdom) (Maxwell & Johnson, 2000; Konrad et al., 2005).
Production was quantified by the harvest of bolls until 113 DAS. Treatments were applied until the end of cycle, and plume mass and plume fiber productivity were determined using the equation described by Albrecht et al. (2009): FP (%) = FM/TM × 100, where FP is fiber productivity, FM is cotton fiber mass (g), and TM is total boll mass (g).
Data were evaluated using the F-test, and, when significant, means were compared by Scott-Knott’s grouping test, at 5% probability, for salinity strategies, and by Tukey’s test, also at 5% probability, for cotton plant genotypes (Ferreira, 2011).
Table 1. Chemical and physical attributes of the soil used in the experiment, before the treatments were applied(1).
Attributes Value
pHsp 5.8
SOM (dag kg-1) 21.20
P (mg kg-1) 45
K+ (cmol
c kg-1) 0.18
Na+ (cmol
c kg-1) 0.37
Ca2+ (cmol
c kg-1) 2.37
Mg2+ (cmol
c kg-1) 3.09
Al3++H+ (cmol
c kg-1) 1.78
ECse (dS m-1) 0.20
Particle size fraction
Sand (g kg-1) 808.6
Silt (g kg-1) 80.5
Clay (g kg-1) 110.9
Textural class Sandy loam
Density (kg dm-3) 1.67
(1)pH
SP, pH of the saturation paste; SOM, soil organic matter determined
by the Walkley-Black wet digestion method; K+ and Na+ extracted using 1
mol L-1 NH
4OAc, pH 7.0; Ca2+ and Mg2+ extracted with 1 mol L-1 KCl, pH
Results and Discussion
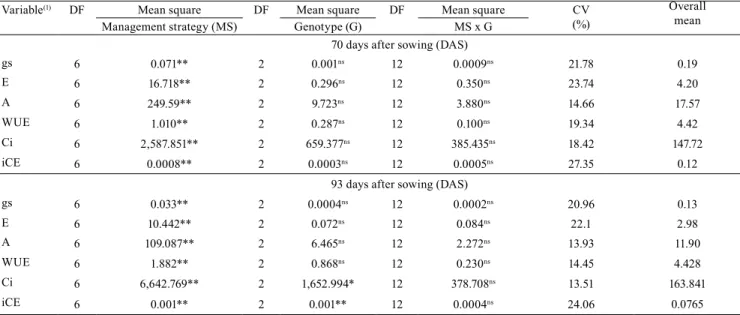
Based on the analysis of variance (Table 2), salinity management strategies had significant effects on stomatal conductance, transpiration, CO2 assimilation
rate, WUE, inner CO2 concentration, and iCE at 70
and 93 DAS, when plants were in full fructification. Among cotton genotypes, only inner CO2 concentration
and iCE differed at 93 DAS. The interaction between factors (management strategies × genotypes) showed no significant effects, i.e., gas exchange did not vary according to the stage in which the genotypes were subjected to salt stress, indicating that the negative effects of irrigation water salinity on cotton plants are significantly more intense during prolonged exposure or exposure during the entire crop cycle (Jafri & Ahmad, 2002).
Stomatal conductance at 70 DAS (Figure 1 A) showed reductions of 61.13, 47.19, and 67.27% in plants irrigated with salinized water in the A1B2C1, A2B2C1,
and A1B2C2 management strategies, respectively,
when compared with plants irrigated with low-salinity water in A1B1C1. However, there was an average
recovery in stomatal conductance of 0.13 and 0.19 mol m-2 s-1, respectively, using the A
1B2C1 and A2B2C1
management strategies at 93 DAS. It should be pointed
out that these plants had already been irrigated with low-salinity water (0.8 dS m-1) during 34 days (Figure
1 A). According to Gratan et al. (2004), the tolerance of plants to salinity usually increases with age, after the vegetative growth stages. Similar results were observed for barley (Hordeum vulgare L.) by Pandya et al. (2005), cowpea [Vigna unguiculata (L.) Walp.] by Neves et al. (2009), and white-plume cotton (Gossypium hirsutum L.) by Zhang et al. (2013).
As a result of partial stomatal closure, when plants were subjected to salt stress, foliar transpiration showed similar reductions (Figure 1 B) of 50, 36.13, and 51.75% for A1B2C1, A2B2C1, and A1B2C2, respectively, at 70
DAS, compared with A1B1C1. At 93 DAS, however,
reductions of 54.15, 58.84, and 43.53% in transpiration were observed for A1B1C2, A2B1C2, and A1B2C2,
respectively. Similarly, Lima et al. (2017) verified that water salinity (9.1 dS m-1) reduced the stomatal
conductance and foliar transpiration of 'BRS Rubi' in 33.20 and 27.72%, respectively, during the production stage, at 83 DAS; the authors also associated these reductions with partial stomatal closure, as well as with osmotic and ionic toxicity effects on the metabolism of plants subjected to salinity conditions.
Table 2. Analysis of variance of the physiological parameters evaluated for naturally-colored cotton (Gossypium hirsutum) at 70 and 93 days after sowing (DAS) according to different salinity management strategies and genotypes.
Variable(1) DF Mean square DF Mean square DF Mean square CV
(%)
Overall mean Management strategy (MS) Genotype (G) MS x G
70 days after sowing (DAS)
gs 6 0.071** 2 0.001ns 12 0.0009ns 21.78 0.19
E 6 16.718** 2 0.296ns 12 0.350ns 23.74 4.20
A 6 249.59** 2 9.723ns 12 3.880ns 14.66 17.57
WUE 6 1.010** 2 0.287ns 12 0.100ns 19.34 4.42
Ci 6 2,587.851** 2 659.377ns 12 385.435ns 18.42 147.72
iCE 6 0.0008** 2 0.0003ns 12 0.0005ns 27.35 0.12
93 days after sowing (DAS)
gs 6 0.033** 2 0.0004ns 12 0.0002ns 20.96 0.13
E 6 10.442** 2 0.072ns 12 0.084ns 22.1 2.98
A 6 109.087** 2 6.465ns 12 2.272ns 13.93 11.90
WUE 6 1.882** 2 0.868ns 12 0.230ns 14.45 4.428
Ci 6 6,642.769** 2 1,652.994* 12 378.708ns 13.51 163.841
iCE 6 0.001** 2 0.001** 12 0.0004ns 24.06 0.0765
(1)gs, stomatal conductance; E, transpiration; A, CO
2 assimilation rate; WUE, instantaneous water use efficiency; Ci, inner CO2 concentration; iCE,
intrinsic carboxylation efficiency; DF, degree of freedom; and CV, coefficient of variation. * and **Significant by the F-test, at 5 and 1% probability,
The CO2 assimilation rate was compromised for
plants irrigated with highly salinized water (9.0 dS m-1),
and the most significant reductions were observed at 93 DAS for the A1B1C2, A2B1C2, and A1B2C2 management
strategies (Figure 1 C). Therefore, when salt stress was applied during fructification, there was an increase in the resistance to CO2 diffusion due to a decrease
in stomatal conductance, as previously discussed.
Figure 1. Means related to: A, stomatal conductance (gs); B, transpiration (E); C, CO2 assimilation rate (A); D, inner CO2 concentration (Ci); E, instant water usage effectiveness (WUE); and F, instant carboxylation efficiency (iCE) in naturally-colored cotton (Gossypium hirsutum) plants at 70 and 93 days after sowing (DAS) under different salinity management strategies. Distinct lowercase letters indicate significant differences among salinity management strategies by Scott-Knott’s test, at 5% probability. Bars represent the standard error of the mean (n=9). 1, A1B1C1; 2, A2B1C1; 3, A1B2C1; 4, A1B1C2; 5,
A2B1C2; 6, A2B2C1; and 7, A1B2C2, where A1, B1, C1 represent no salinity during the vegetative, flowering, and fructification
Desingh & Kanagaraj (2007) also reported a decrease in CO2 assimilation while evaluating the
Arya-Anubam and LRA-5166 cotton varieties subjected to different salinity levels – 0 (control), 50, 100, and 150 mmol L-1 NaCl, MgSO
4, and CaCl2, respectively – at
50 DAS, confirming the negative effect of salinity on cotton plants.
A higher inner CO2 concentration was observed
for A1B1C1 using 168.55 μmol mol-1, but it did not
differ significantly from that of A2B1C1, A1B1C2, and
A2B1C2 (Figure 1 D). Partial stomatal closure at 93
DAS caused a decrease in foliar transpiration and in inner CO2 concentration in A1B1C2 and A2B1C2, when
salinized water was applied during the production stage (Figure 1 D). These results are probably related to the decrease in the potential energy of water in the roots and/or in the transportation of abscisic acid to the leaves, resulting in increased stomatal resistance and decreased carbon concentration in the substomatal chamber (inner CO2 concentration). This is explained
by the direct relationship between gas exchange (with implicit CO2 absorption) and water loss, in which
stomatal closure results in a reduction in transpiration and, consequently, in a lower inner CO2 concentration
(Shimazaki et al., 2007).
In alignment with the results obtained for stomatal conductance, transpiration, and CO2 assimilation,
a higher WUE was observed at 93 DAS (Figure 1 E) for A1B1C2, A2B1C2, A2B2C1, and A1B2C2, with an
average of 4.69 [(μmol m-2 s-1) (mmol H
2O m-2 s-1)-1].
Therefore, plants that are more capable of increasing water usage under salinity conditions possibly show higher tolerance to salt stress during these stages, because reductions in water consumption result in a reduction in the absorption of specific ions, avoiding toxic effects on the plant (Nobre et al., 2014).
A higher iCE due to salinized water (Figure 1 E) was observed for A2B1C1 and A2B1C2 at 70 DAS, and
for A1B2C1 and A2B2C1 at 93 DAS, notably during the
vegetative and flowering stages, in which the A2B2C1
management strategy showed an average of 0.098 [(μmol m-2 s-1) (μmol mol-1)-1] at 93 DAS. The values
obtained for transpiration, CO2 assimilation rate,
and instant carboxylation were within the variation range reported for cotton plants (Zhang et al., 2014; Lima et al., 2017), i.e., the photosynthetic apparatus was not compromised by stress during the initial crop developmental stages.
Genotype data analysis at 93 DAS indicated higher internal CO2 concentration (Figure 2 A) for 'BRS
Topázio' (172.40 μmol mol-1) than for the 'BRS Rubi'
(164.65 μmol mol-1) and 'BRS Safira' (154.69 μmol mol-1)
genotypes. The average iCE values observed for 'BRS Rubi' and 'BRS Safira', however, were 0.085 and 0.072 [(μmol m-2 s-1) (μmol mol-1)-1], greater than
that observed for 'BRS Topázio' (Figure 2 B). This is probably attributed to the low CO2 assimilation in the
substomatal chamber of 'BRS Rubi' and 'BRS Safira'; however, the obtained values are higher than the average of 0.03 [(μmol m-2 s-1) (μmol ol-1)-1] iCE found
by Pereira (2012) for these same genotypes.
Regarding fluorescence, no significant differences were verified among the naturally-colored cotton genotypes for photosynthetic apparatus efficiency
(Table 3), only for fiber productivity and plume cotton mass. Furthermore, salinity management strategies caused significant effects (p<0.01) on Fm, Fv, Fv/ Fm, fiber productivity, and plume cotton mass. The unfolding of the factor management strategies × genotype revealed significant effects only for plume cotton mass at 113 DAS.
There were no significant differences for Fo when salt stress was applied during the distinct phenological stages evaluated (Table 4). This result indicates that the exposure of plants to salinized irrigation water during the phenological stages did not affect the integrity of the complex light receptor of photosystem II (FS II) in naturally-colored cotton, which may be related to tolerance to salinity, as reported in other studies (Oliveira et al., 2014; Dias et al., 2016).
The mean grouping tests performed for maximum fluorescence as affected by the salinity management strategies (Table 4) indicated that A1B1C1 was
statistically superior; however, plants subjected to A2B1C2 received 1,771.63 electrons per quantum,
not differing from those irrigated with low-salinity water during their life cycle. Similar tendencies were obtained for Fo and Fm; therefore, salt stress in A2B1C2
did not impair quinone A photoreduction or electron flow among photosystems (Tatagiba et al., 2014).
During the flowering and fructification phenological stages (Table 4), plants irrigated with highly salinized water, subjected to A1B2C1 and A1B2C2, exhibited
Fv values of 1,346.03 and 1,308.815 electrons per quantum, respectively, which were 9.41 and 14.43%
Table 3. Analysis of variance for initial fluorescence (Fo), maximum fluorescence (Fm), variable fluorescence (Fv),
and quantum yield of photosystem II (Fv/Fm) in naturally-colored cotton (Gossypium hirsutum) plants at 93 days after sowing (DAS), as well as plume fiber productivity (FP) and plume cotton mass (Plcotton) at 113 DAS according to salinity management strategies and genotypes(1).
Source of variation DF Mean square
Fo Fm Fv Fv/Fm FP Plcotton
Management strategy (MS) 6 239.36ns 52,058.04** 52,301.79** 0.0003** 5.59** 4,710.77**
Genotype (G) 2 440.23ns 4144.10ns 2,224.53ns 0.00006ns 147.64** 4,618.92**
MS x G 12 168.77ns 6236.48ns 5,621.43ns 0.00007ns 0.74 ns 136.25*
Block 2 1,761.32ns 189,882.37ns 23,207.75ns 0.0007ns 0.30 ns 6.39ns
Error 40 167.53 3,985.76 3,216.02 0.00004 0.98 55.58
CV (%) 4.48 3.73 4.04 0.77 3.66 11.55
Mean 288.941 1691.460 1,403.465 0.828 27.196 64.55
(1)DF, degrees of freedom; and CV, coefficient of variation. * and **Significant by the F-test, at 5 and 1% probability, respectively. nsNonsignificant.
Table 4. Mean test for initial fluorescence (Fo), maximum fluorescence (Fm), variable fluorescence (Fv), and quantum yield
of the photosystem II (Fv/Fm) in cotton (Gossypium hirsutum) plants under different salinity management strategies at 93 days after sowing(1).
Management strategy Fo Fm Fv Fv/Fm
A1B1C1 292.74±10.54a 1,814.48±47.32a 1,529.70±40.88a 0.839±0.004a
A2B1C1 293.66±6.38a 1,679.29±35.17b 1,385.63±34.69b 0.824±0.004c
A1B2C1 285.77±9.09a 1,628.70±31.84c 1,346.03±27.13c 0.825±0.004c
A1B1C2 285.77±8.90a 1,685.00±34.05b 1,399.22±32.51b 0.829±0.005b
A2B1C2 293.25±4.32a 1,771.63±41.04a 1,478.37±43.51a 0.833±0.005b
A2B2C1 282.18±7.67a 1,658.81±32.38b 1,376.48±25.73b 0.829±0.003b
A1B2C2 292.18±4.32a 1,602.29±19.55c 1,308.81±22.21c 0.818±0.003d (1)Means followed by distinct lowercase letters indicate significant differences among salinity management strategies by Scott-Knott’s test, at 5%
probability, and followed by distinct uppercase letters indicate significant differences among cotton plant genotypes by Tukey’s test, at 5% probability.
Number±standard error. A1, B1, C1, no salinity during the vegetative, flowering, and fructification stages, respectively; and A2, B2, C2, salinity during the
lower than those obtained for plants without salt stress during the cycle in A1B1C1.
The quantum efficiency of photosystem II for plants under salt stress in the A2B1C1 and A2B2C1
management strategies decreased an average of 1.70%, compared with plants irrigated with low-salinity water during the entire cycle in A1B1C1 (Table 4). However,
the most significant reduction was found in A1B2C2,
in which Fv showed 0.818 electrons per quantum, as
observed for gas exchange. Decreases in Fv/Fm were also reported for peanut (Arachis hypogaea L.) and safflower (Carthamus tinctorius L.) plants (Correia et al., 2009; Çulha Erdal & Çakirlar, 2014); however, the decreases verified in the present study did not cause the degradation of the photosynthetic apparatus, since the obtained values were above 0.75 (Silva et al., 2014).
Fiber productivity decreased in 6.34, 5.41, and 4.65% in the A1B2C1, A2B2C1, and A1B2C2 management
strategies, respectively, compared with A1B1C1, when
plants were subjected to salt stress during the flowering and fructification stages (Figure 3 A). It should be highlighted that there was an average recovery of 27% in fiber productivity in plants subjected to salt stress in A2B1C1, A1B1C2, and A2B1C2. However, Khorsandi &
Anagholi (2009) verified that irrigation with 10 dS m-1
during the vegetative stage negatively affected cotton productivity during the end of the cycle. Among the analyzed genotypes, 'BRS Topázio' presented the highest fiber productivity (30.21%), which was 16.49 and 13.46% greater than that of 'BRS Rubi' and 'BRS Safira', respectively, regardless of the adopted salinized water management strategy (Figure 3 B).
The highest plume cotton mass values were observed for the 'BRS Topázio' genotype at 113 DAS (Table 5). Regarding salinity management, the highest means were obtained for the A1B1C1 and A2B1C1 strategies.
Figure 3. Means related to the fiber productivity of
naturally-colored cotton (Gossypium hirsutum) plants under different salinity management strategies during phenological stages (A) and among genotypes (B) at 113 days after sowing. Distinct lowercase letters indicate significant differences among salinity management strategies by Scott-Knott’s test, at 5% probability, and distinct uppercase letters indicate significant differences among cotton plant genotypes by Tukey’s test, at 5% probability. Bars represent the standard error of the mean for management strategies (n=9) and genotypes (n=21). 1, A1B1C1; 2, A2B1C1; 3, A1B2C1;
4, A1B1C2; 5, A2B1C2; 6, A2B2C1; and 7, A1B2C2, where A1,
B1, C1 represent no salinity during the vegetative, flowering, and fructification stages, and A2, B2, C2, salinity during the vegetative, flowering, and fructification stages.
Table 5. Mean test for the unfolding of the interaction between cotton (Gossypium hirsutum) plant genotypes and management strategies for plume cotton mass at 113 days after sowing(1).
Management strategy
Genotype
BRS Rubi BRS Topázio BRS Safira
A1B1C1 84.33±5.53aB 125.33±3.54aA 87.66±3.32aB
A2B1C1 73.33±2.51aB 114.66±1.04aA 81.00±6.87aB
A1B2C1 54.66±4.07bC 90.33±3.05bA 72.00±2.29aB
A1B1C2 44.66±2.02cB 63.00±3.27cA 49.66±0.57bAB
A2B1C2 40.33±3.54cB 62.66±2.56cA 43.33±2.56bB
A2B2C1 42.00±6.94cB 68.00±3.60cA 43.00±3.60bB
A1B2C2 34.33±2.25cA 45.66±1.60dA 35.66±4.07bA
(1)Means followed by distinct lowercase letters indicate significant
differences among salinity management strategies by Scott-Knott’s test,
at 5% probability, and followed by distinct uppercase letters indicate
significant differences among cotton plant genotypes by Tukey’s test, at
5% probability. Number ± standard error. A1, B1, C1, no salinity during the
vegetative, flowering, and fructification stages; and A2, B2, C2, salinity
It is important to emphasize that 'BRS Safira' plants irrigated with salinized water during flowering in A1B2C1 showed the highest means of 72 g per plant;
the A1B1C2, A2B1C2, A2B2C1, and A1B2C2 management
strategies resulted in the lowest means.
The results obtained in the present study revealed that the effects of salinity on naturally-colored cotton production are related to stress during the flowering and production stages. Production decreases due to ECw increases may be attributed to lower water absorption by plants under salt stress because of the lower soil water potential, as concluded by Cordão Sobrinho et al. (2007). This was confirmed by the results of the present study, in which the effects of salinity were greater on gas exchange than on a chlorophyll fluorescence, i.e., water restriction due to increased water salinity caused reductions in stomatal conductance, transpiration, and liquid photosynthesis, but did not cause irreversible damage to the photosynthetic apparatus, since the quantum yield values for photosystem II were over 0.75, showing that ionic effects were less expressive.
Conclusions
1. Irrigation with salinized water significantly reduces gas exchange in naturally-colored cotton (Gossypium hirsutum) plants during the production stage, but increases plume cotton production in the vegetative stage.
2. Irrigation with salinized water during different phenological stages of naturally-colored cotton genotypes does not compromise the quantum yield of their photosystems.
3. Among the studied genotypes, ‘BRS Topázio’ stands out due to its higher fiber productivity and plume cotton production.
Acknowledgments
To Coordenação de Aperfeiçoamento de Pessoal de Nível Superior (Capes), for scholarship granted to the first author; and to Embrapa Algodão, for providing the seeds.
References
ALBRECHT, L.P.; BRACCINI, A. de L. e; ÁVILA, M.R.; BARBOSA, M.C.; RICCI, T.T.; ALBRECHT, A.J.P. Aplicação de biorregulador na produtividade do algodoeiro e qualidade de
fibra. Scientia Agraria, v.10, p.191-198, 2009. DOI: 10.5380/rsa. v10i3.14474.
ASHRAF, M.; ATHAR, H.R.; HARRIS, P.J.C.; KWON, T.R. Some prospective strategies for improving crop salt tolerance.
Advances in Agronomy, v.97, p.45-110, 2008. DOI: 10.1016/
S0065-2113(07)00002-8.
AYERS, R.S.; WESTCOT, D.W. A qualidade da água na
agricultura. 2.ed. Campina Grande: Ed. da UFPB, 1999. 153p.
(Estudos FAO. Irrigação e Drenagem, 29).
CHEN, W.; HOU, Z.; WU, L.; LIANG, Y.; WEI, C. Effects of salinity and nitrogen on cotton growth inarid environment. Plant
and Soil, v.326, p.61-73, 2010. DOI: 10.1007/s11104-008-9881-0.
CORDÃO SOBRINHO, F.P.; FERNANDES, P.D.; BELTRÃO, N.E. de M.; SOARES, F.A.L.; TERCEIRO NETO, C.P.C. Crescimento e rendimento do algodoeiro BRS-200 com aplicações de cloreto de mepiquat e lâminas de irrigação. Revista Brasileira
de Engenharia Agrícola e Ambiental, v.11, p.284-292, 2007.
DOI: 10.1590/S1415-43662007000300007.
CORREIA, K.G.; FERNANDES, P.D.; GHEYI, H.R.; NOBRE, R.G.; SANTOS, T. da S. Crescimento, produção e características de fluorescência da clorofila a em amendoim sob condições de salinidade. Revista Ciência Agronômica, v.40, p.514-521, 2009. ÇULHA ERDAL, Ş; ÇAKIRLAR, H. Impact of salt stress on photosystem II efficiency and antioxidant enzyme activities of safflower (Carthamus tinctorius L.) cultivars. Turkish Journal
of Biology, v.38, p.549-560, 2014. DOI: 10.3906/biy-1401-33.
DESINGH, R.; KANAGARAJ, G. Influence of salinity stress on photosynthesis and antioxidative systems in two cotton varieties.
General and Applied Plant Physiology, v.33, p.221-234, 2007.
DIAS, A.S.; NOBRE, R.G.; LIMA, G.S. de; GHEYI, H.R.; PINHEIRO, F.W.A. Crescimento e produção de algodoeiro de fibra colorida cultivado em solo salino-sódico e adubação orgânica. Irriga, v.1, p.260-273, 2016. Edição Especial Grandes Culturas. DOI: 10.15809/irriga.2016v1n1p260-273.
DONG, H.; KONG, X.; LUO, Z.; LI, W.; XIN, C. Unequal salt distribution in the root zone increases growth and yield of cotton.
European Journal of Agronomy, v.33, p.285-292, 2010. DOI:
10.1016/j.eja.2010.08.002.
FERREIRA, D.F. Sisvar: a computer statistical analysis system.
Ciência e Agrotecnologia, v.35, p.1039-1042, 2011. DOI: 10.1590/
S1413-70542011000600001.
GRATAN, S.R.; GRIEVE, C.M.; POSS, J.A.; ROBINSON, P.H.; SUAREZ, D.L.; BENES, S.E. Evaluation of salt-tolerant forages for sequential water reuse systems. I. Biomass production.
Agricultural Water Management, v.70, p.109-120, 2004. DOI:
10.1016/j.agwat.2004.04.010.
JAFRI, A.Z.; AHMAD, R. Reproductive physiology of cotton under saline conditions. In: AHMAD, R.; MALIK, K.A. (Ed.).
Prospects for saline agriculture. Dodrecht: Springer Science,
2002. p.209-214. (Tasks for vegetation science, v.37). DOI: 10.1007/978-94-017-0067-2_23.
KHORSANDI, F.; ANAGHOLI, A. Reproductive compensation of cotton after salt stress relief at different growth stages. Journal
of Agronomy and Crop Science, v.195, p.278-283, 2009. DOI:
10.1111/j.1439-037X.2009.00370.x.
seis cultivares de cafeeiro sob estresse de alumínio. Bragantia, v.64, p.339-347, 2005. DOI: 10.1590/S0006-87052005000300004. LETEY, J.; FENG, G.L. Dynamic versus steady-state approaches to evaluate irrigation management of saline waters. Agricultural
Water Management, v.91, p.1-10, 2007. DOI: 10.1016/j.
agwat.2007.02.014.
LIMA, G.S. de; DIAS, A.S.; GHEYI, H.R.; SOARES, L.A. dos A.; NOBRE, R.G.; SÁ, F.V. da S.; PAIVA, E.P. de. Emergence, morpho-physiology and flowering of colored-fiber cotton (Gossypium hirsutum L.) submitted to different nitrogen levels and saline water stress irrigation. Australian Journal of Crop
Science, v.11, p.897-905, 2017. DOI: 10.21475/ajcs.17.11.07.pne587.
LIMA, G.S. de; OLIVEIRA, L.D. de; GHEYI, H.R.; SOARES, L.A. dos A.; LACERDA, C.F. de; SANTOS, J.B. dos; ARAÚJO, B.M. de. Cultivation of colored cotton irrigated with saline water under potassium and nitrate/ammonium fertilization. African
Journal of Agricultural Research, v.11, p.32-39, 2016. DOI:
10.5897/AJAR2015.10540.
MAXWELL, K.; JOHNSON, G.N. Chlorophyll fluorescence: a practical guide. Journal of Experimental Botany, v.51, p.659-668, 2000. DOI: 10.1093/jexbot/51.345.659.
NEVES, A.L.R.; LACERDA, C.F. de; GUIMARÃES, F.V.A.; HERNANDEZ, F.F.F.; SILVA, F.B. da; PRISCO, J.T.; GHEYI, H.R. Acumulação de biomassa e extração de nutrientes por plantas de feijão-de-corda irrigadas com água salina em diferentes estádios de desenvolvimento. Ciência Rural, v.39, p.758-765, 2009. DOI: 10.1590/S0103-84782009005000014.
NOBRE, R.G.; LIMA, G.S. de; GHEYI, H.R.; SOARES, L.A. dos A.; SILVA, A.O. da. Crescimento, consumo e eficiência do uso da água pela mamoneira sob estresse salino e nitrogênio. Revista
Caatinga, v.27, p.148-158, 2014.
NOVAIS, R.F. de; NEVES J.C.L.; BARROS N.F. de. Ensaio em ambiente controlado. In: OLIVEIRA, A.J. Métodos de pesquisa
em fertilidade do solo. Brasília: Embrapa-SEA, 1991. p.189-253.
(EMBRAPA-SEA. Documentos, 3).
OLIVEIRA, L.L. de P.; DIAS, N. da S.; MEDEIROS, L.C.; FERREIRA, L.L. Tolerância de cultivares de algodão (Gossypium hirsutum) à salinidade da água de irrigação. Agropecuária
Científica no Semiárido, v.10, p.66-71, 2014. DOI: 10.30969/acsa.
v10i2.539.
OLIVEIRA, L.L.P.; DIAS, N.S.; FARIAS, W.C.; MEDEIROS, L.C.; FERREIRA L.L. Tolerância de cultivares de algodão (Gossypium hirsutum) à salinidade da água de irrigação. Revista
Verde de Agroecologia e Desenvolvimento Sustentável, v.8,
p.232-237, 2013.
PANDYA, D.H.; MER, R.K.; PRAJITH, P.K.; PANDEY, A.N. Effect of salt stress and manganese supply on growth of barley seedlings. Journal of Plant Nutrition, v.27, p.1361-1379, 2005. DOI: 10.1081/PLN-200025835.
PEREIRA, E.R. de L. Tolerância de genótipos do algodão
colorido ao estresse salino. 2012. 105p. Dissertação (Mestrado)
– Universidade Estadual da Paraíba, Campina Grande.
RADY, M.M.; ABD EL-MAGEED, T.A.; ABDURRAHMAN, H.A.; MAHDI, A.H. Humic acid application improves field performance of cotton (Gossypium barbadense L.) under saline conditions. The Journal of Animal & Plant Sciences, v.26, p.487-493, 2016.
ROSALES, M.A.; OCAMPO, E.; RODRÍGUEZ-VALENTÍN, R.; OLVERA-CARRILLO, Y.; ACOSTA-GALLEGOS, J.; COVARRUBIAS, A.A. Physiological analysis of common bean (Phaseolus vulgaris L.) cultivars uncovers characteristics related to terminal drought resistance. Plant Physiology and Biochemistry, v.56, p.24-34, 2012. DOI: 10.1016/j.plaphy.2012.04.007.
SANTOS, H.G. dos; JACOMINE, P.K.T.; ANJOS, L.H.C. dos; OLIVEIRA, V.A. de; LUMBRERAS, J.F.; COELHO, M.R.; ALMEIDA, J.A. de; CUNHA, T.J.F.; OLIVEIRA, J.B. de.
Sistema brasileiro de classificação de solos. 3.ed. Brasília:
Embrapa, 2013. 353p.
SANTOS, J.B. dos; GHEYI, H.R.; LIMA, G.S. de; XAVIER, D.A.; CAVALCANTE, L.F.; CENTENO, C.R.M. Morfofisiologia e produção do algodoeiro herbáceo irrigado com águas salinas e adubado com nitrogênio. Comunicata Scientiae, v.7, p.86-96, 2016. DOI: 10.14295/cs.v7i1.1158.
SHAHEEN, H.L.; SHAHBAZ, M. Salt-induced effects on some key morpho-physiological attributes of cotton (Gossypium hirsutum L.) at various growth stages. Soil & Environment, v.31, p.125-133, 2012.
SHIMAZAKI, K-I..; DOI, M.; ASSMANN, S.M.; KINOSHITA, T. Light regulation of stomatal movement. Annual Review of
Plant Biology, v.58, p.219-247, 2007. DOI: 10.1146/annurev.
arplant.57.032905.105434.
SILVA, A.A.R. da; LIMA, G.S. de; AZEVEDO, C.A.V. de; SOARES, L.A. dos A.; GHEYI, H.R.; OLIVEIRA, R.C. de. Potassium fertilization in the cultivation of colored cotton irrigated with saline water. Revista Brasileira de Engenharia
Agrícola e Ambiental, v.21, p.628-633, 2017. DOI:
10.1590/1807-1929/agriambi.v21n9p628-633.
SILVA, L. de A.; BRITO, M.E.B.; SÁ, F.V. da S.; MOREIRA, R.C.L.; SOARES FILHO, W. dos S.; FERNANDES, P.D. Mecanismos fisiológicos em híbridos de citros sob estresse salino em cultivo hidropônico. Revista Brasileira de Engenharia
Agrícola e Ambiental, v.18, p.S1-S7, 2014. Suplemento. DOI:
10.1590/1807-1929/agriambi.v18nsupps1-s7.
TATAGIBA, S.D.; MORAES, G.A.B.K.; NASCIMENTO, K.J.T.; PELOSO, A. de F. Limitações fotossintéticas em folhas de plantas de tomateiro submetidas a crescentes concentrações salinas.
Revista Engenharia na Agricultura, v.22, p.138-149, 2014. DOI:
10.13083/1414-3984.v22n02a05.
ZHANG, L.; MA, H.; CHEN, T.; PEN, J.; YU, S.; ZHAO, X. Morphological and physiological responses of cotton (Gossypium hirsutum L.) plants to salinity. PLoS ONE, v.9, e112807, 2014. DOI: 10.1371/journal.pone.0112807.
ZHANG, L.; ZHANG, G.; WANG, Y.; ZHOU, Z.; MENG, Y.; CHEN, B. Effect of soil salinity on physiological characteristics of functional leaves of cotton plants. Journal of Plant Research, v.126, p.293-304, 2013. DOI: 10.1007/s10265-012-0533-3.