Revista Brasileira de
Engenharia Agrícola e Ambiental
Campina Grande, PB, UAEA/UFCG – http://www.agriambi.com.br
v.22, n.3, p.206-211, 2018
Agronomic performance of Italian zucchini
as a function of phosphate fertilization
DOI: http://dx.doi.org/10.1590/1807-1929/agriambi.v22n3p206-211
Francisco I. de Souza
1, Leilson C. Grangeiro
1, Valdívia de F. L. de Souza
1,
Francisco das C. Gonçalvez
1, Fábio H. T. de Oliveira
1& Priscila M. M. de Jesus
1A B S T R A C T
The objective of this research was to evaluate the agronomic performance of Italian zucchini as a function of phosphate fertilization. The experiments were carried at the Rafael Fernandes Experimental Farm, Federal Rural University of the Semi-Arid Region, Mossoró, RN, Brazil, from August to November 2015 and from July to September 2016. The experimental design was randomized blocks in 2 x 5 factorial scheme, with four replicates. The treatments consisted of the combination of two cultivars (Caserta and Alícia) and five doses of phosphorus (0, 40, 78, 120 and 150 kg ha-1 of P
2O5). Phosphorus doses associated with the maximum marketable yields estimated were smaller for Alícia than for Caserta in the period from August to November 2015. In the period from July to September 2016, these estimated doses were higher for Alícia compared with Caserta. Alícia, regardless of crop season, was superior to Caserta. Zucchini cultivation from July to September of 2016 resulted in higher fruit yield in comparison to the period from August to November 2015.
Desempenho agronômico de abobrinha italiana
em função da adubação fosfatada
R E S U M O
Esta pesquisa foi realizada com o objetivo de avaliar o desempenho agronômico da abobrinha italiana em função da adubação fosfatada. Os experimentos foram realizados na Fazenda Experimental Rafael Fernandes, da Universidade Federal Rural do Semi-Árido, Mossoró, RN, Brasil, nos períodos de agosto a novembro de 2015 e de julho a setembro de 2016. O delineamento utilizado foi em blocos casualizados, em esquema fatorial 2 x 5, com quatro repetições. Os tratamentos consistiram da combinação de duas cultivares (Caserta e Alícia) e cinco doses de fósforo (0, 40, 78, 120 e 150 kg ha-1 P
2O5). As doses de fósforo associadas às máximas produtividades comerciais estimadas foram menores para Alícia em relação à Caserta no período de agosto a novembro de 2015. De julho a setembro de 2016, essas doses estimadas foram maiores para Alícia comparado à Caserta. A ‘Alícia’, independente da época de cultivo foi superior a ‘Caserta’. O cultivo de abobrinha no período de julho a setembro de 2016 proporcionou maior produção de frutos em relação ao período de agosto a novembro de 2015.
Key words:
Cucurbita pepo L. plant nutrition yield
Palavras-chave:
Cucurbita pepo L. nutrição de planta produtividade
1 Universidade Federal Rural do Semi-Árido/Centro de Ciências Agrárias. Mossoró, RN. E-mail: franciscoirael@hotmail.com (Corresponding author) -
ORCID: 0000-0002-2795-3632; leilson@ufersa.edu.br - ORCID: 0000-0002-4613-3605; valdivia_souza@hotmail.com - ORCID: 0000-0002-5377-6844; francisco.goncalves@ufersa.edu.br - ORCID: 0000-0002-0730-9647; fabio@ufersa.edu.br - ORCID: 0000-0001-8581-8482; priscilamodesto@ymail.com - ORCID: 0000-0002-3144-1832
Introduction
Italian zucchini (Cucurbita pepo L.) or ‘abobrinha de moita’ is a vegetable cultivated in almost all the Brazilian territory, especially in the Midwest and Southeast, which concentrate the highest production and consumption, particularly the São Paulo state. The mean yield of the crop in the country has oscillated between 8 and 10 t ha-1 (Filgueira, 2012).
Fertilization has been one of the main characteristics evaluated to obtain better management. Among the most studied nutrients, there is phosphorus (P), which is responsible for various functions in the plant and is directly related to yield, being one of the most important and limiting nutrients. In Brazil, there is the need for further research on the zucchini crop regarding the doses of fertilizers used, adjusting to the different cultivars, regions and planting periods.
In Italian zucchini and other species of the Cucurbitaceae family, P plays a preponderant role in development, flowering and fruiting. However, it is one of the least required macronutrients, only ahead of sulfur (Gaitán et al., 2012). Research results for melon (Abrêu et al., 2011; Mendoza-Cortez et al., 2014), watermelon (Gonçalves, 2013) and cucumber (Santos et al., 2014) have demonstrated increments in the number and mean weight of fruits and, consequently, of yield, with the increase of P levels in the soil. Castagnino et al. (2007) evaluated the influence of P on the zucchini crop and obtained higher yield due to higher number of fruits per hectare and higher dry matter.
In this context, the present study aimed to evaluate the agronomic performance of Italian zucchini as a function of phosphate fertilization.
Material and Methods
The experiments were carried out at the Rafael Fernandes Experimental Farm of the Federal Rural University of the Semi-Arid Region (UFERSA), located in the district of Alagoinha, municipality of Mossoró, RN, Brazil (5° 03” 37” S; 37° 23” 50” W; 72 m), in soil classified as typic dystrophic Red Argisol (Rêgo et al., 2016) from August to November 2015 (period 1) and from July to September 2016 (period 2).
In the experimental areas, soil samples were collected in the 0-20 cm layer for chemical and physical analysis (Tedesco et al., 1995) and the respective results for periods 1 and 2 were: pH = 5.4 and 4.50; OM = 1.9 and 2.34 g kg-1; P
(Mehlich) = 4.20 and 1.8 mg dm-3; K = 27.1 and 21.1 mg dm-3; Na = 3.4 and 3.4 mg dm-3;Ca = 0.8 and 0.6 cmol
c dm
-3; Mg = 0.3 and 0.3 cmol c dm
-3; Al = 0.0 and 0.10 cmolc dm-3; SB = 1.65 and 0.97 cmol
c dm -3 and CEC = 2.83 and 3.44 cmolc dm-3.The proportions of sand, silt and clay were 940, 10 and 50 g kg-1 for period 1 and 920, 30 and 50 g kg-1 for period 2.
The experimental design was in randomized blocks, in 2 x 5 factorial scheme, with four replicates. Treatments consisted of the combination between two cultivars (Caserta and Alícia) and five P doses (0, 40, 78, 120 and 150 kg ha-1 of P
2O5). Each experimental unit was composed of three rows with six plants, at spacing of 0.4 m between plants and 1.0 m between rows, considering the central row for evaluations.
Soil tillage consisted in plowing and harrowing, followed furrowing. Fertilization was performed based on soil chemical analysis and recommendation for the crop, according to Ribeiro et al. (1999), using 140 kg ha-1 of K
2O, 120 kg ha -1 of N, 25 kg ha-1 of S, 30 kg ha-1 of Mg and 1 kg ha-1 of B, respectively, in the forms of potassium chloride, urea, magnesium sulfate and boric acid. As basal, all P (according to the treatment) and micronutrients were applied, besides 30% of the total N and K. The remaining 70% of N and K were applied as top-dressing, in equal portions at 22 and 35 DAT. All fertilizations were applied in the planting furrow.
Zucchini seedlings were produced on 128-cell polystyrene trays, using commercial substrate. Transplantation was carried out 13 days after sowing, when plants showed three true leaves. Irrigations were daily applied, and the water depths were determined based on crop ETc. Phytosanitary control was performed preventively, applying insecticides from the Neonicotinoid chemical group, acaricide and insecticide of contact and ingestion from the Avermectin chemical group.
Harvest started when fruits reached 16 to 22 cm in length (27 DAT in both experiments) and continued up to 60 DAT. The evaluated characteristics were: number of marketable fruits (16 to 22 cm in length, free from injuries), total number of fruits per plant, mean fruit weight, marketable yield (sum of the weight of fruits, 16 to 22 cm in length, free from injuries), unmarketable yield (sum of the weight of fruits less than 16 cm and/or with injuries) and total yield (sum of marketable and unmarketable yields).
At early fruiting, leaf P content was evaluated by collecting the ninth leaf from the tip of all plants in the evaluation area, according to the methodology described by Trani & Raij (1997). Chemical analysis used the entire leaf and P content was determined following the methodology of Tedesco et al. (1995).
To determine dry matter and P accumulation in the plant, one plant was collected per plot and separated into vegetative parts (leaves + stem) and fruits. Plants were washed and dried in forced air circulation oven (65 ºC) until constant weight. Then, P content was determined in the previously mentioned parts, according to the methodology of Tedesco et al. (1995). Values of P accumulation were obtained by the product between P content and dry matter.
Analyses of variance of the evaluated characteristics were conducted individually for each experiment. Following that, joint analysis of the experiment was carried out using the software Sisvar v.5.3 (Ferreira, 2011). For the quantitative factor (P doses), regression analysis was performed using the softwareTable Curve (Jandel Scientific, 1991) and for the qualitative factor (cultivars), Tukey test was applied at 0.05 probability level.
Results and Discussion
P content in the diagnostic leaf increased linearly as a function of the P doses, in both cultivation periods. The maximum values estimated were 3.02 and 3.65 g kg-1 respectively for periods 1 and 2 (Figure 1). These values were below the value considered as adequate (4 to 6 g kg-1)by Trani & Raij (1997) for zucchini. However, the authors call attention to the fact that the contents of nutrients in the leaves, adequate for zucchini, must be interpreted carefully due to the existence of numerous species and cultivars produced under different soil and climate conditions. Araújo et al. (2015) found values close to those of the present study for the zucchini crop, with also a difference between periods and P contents of 4.95 g kg-1 in the winter and 3.53 g kg-1 in the spring.
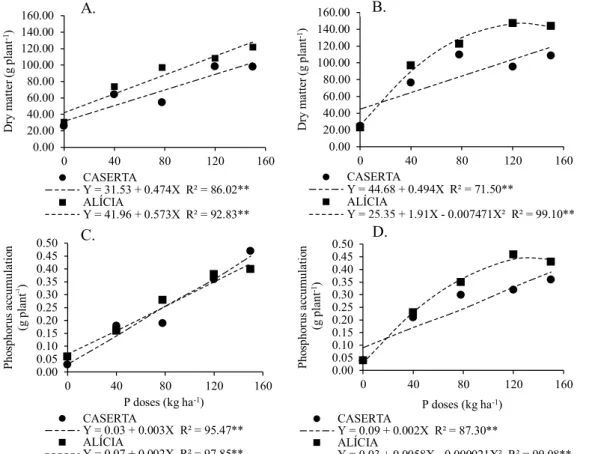
In period 1, the highest estimated values of dry matter were obtained at the highest P dose, respectively 128.00 and 102.65 g plant-1 for Alícia and Caserta(Figure 2A). The same
Table 1. Summary of analysis of variance for phosphorus content in the diagnostic leaf (DL), dry matter of the plant (DM), phosphorus accumulation in the plant (AC), number of marketable fruits (NMF), total number of fruits (TNF), fruit weight (FW), marketable yield (MY), unmarketable yield (UY) and total yield (TY) of Italian zucchini
SV DF Mean square
DL DM AC NMF TNF FW MY UY TY
Block (period) 6 0.08ns 144.88ns 0.00ns 0.07ns 0.074ns 1289ns 18.64ns 5.38ns 4.70ns
Period (P) 1 0.03ns 6098.95** 0.01* 11.49** 20.32** 32466** 12.24** 45.76** 1780.85**
Cultivar (C) 1 2.08** 8729.72** 0.02** 17.54** 13.57** 1520** 3045.63** 38.35** 2372.16** Dose (D) 4 10.84* 21933.43** 0.36** 23.92** 22.49** 174344** 3935.26** 6.65* 4085.77** P x C 1 0.0094 151.16ns 0.01** 0.0076ns 0.2ns 5390** 2.99ns 8.44ns 0.77ns
P x D 4 1.84** 997.94** 0.01** 1.75** 1.39** 4389** 110.36** 1.07ns 117.50**
C x D 4 0.3ns 640.21** 0.006** 0.88** 0.63** 2956** 252.59** 11.43** 195.65**
P x C x D 4 0.28ns 689.97** 0.006** 0.36* 0.34* 1704** 69.35** 0.83ns 66.22**
Error 54 0.14 128.98 0.001 0.13 0.09 618.66 16.07 2.52 13.14
CV (%) 15.70 13.19 14.52 16.03 12.06 5.91 15.06 61.65 12.40
SV – Source of variation; DF – Degree of freedom; ns; *; **Not significant; Significant at 0.05; Significant at 0.01, respectively, by F test
Figure 1. Phosphorus content in the diagnostic leaf of Italian zucchini in period 1 (●) and period 2 (▲) as a function of phosphorus – P doses
0.00 0.50 1.00 1.50 2.00 2.50 3.00 3.50 4.00
0 40 80 120 160
Pc
on
tent (g
kg
-1)
P dose (kg ha-1)
PERIOD 1
Y = 1.65 + 0.0091X R² = 99.92** PERIOD 2
Y = 1.066 + 0.0172X R² = 83.42**
Figure 2.Plant dry matter in period 1 (A) and period 2 (B), and phosphorus accumulation in the plant in period 1 (C) and period 2 (D), in Italian zucchini for the cultivars Alícia (■) and Caserta (●), as a function of phosphorus – P doses
0.00 20.00 40.00 60.00 80.00 100.00 120.00 140.00 160.00
0 40 80 120 160
D
ry
m
at
te
r(g
plant
-1)
CASERTA
Y = 31.53 + 0.474X R² = 86.02** ALÍCIA
Y = 41.96 + 0.573X R² = 92.83**
0.00 20.00 40.00 60.00 80.00 100.00 120.00 140.00 160.00
0 40 80 120 160
D
ry
m
at
te
r(
g
pl
an
t
-1)
CASERTA
Y = 44.68 + 0.494X R² = 71.50** ALÍCIA
Y = 25.35 + 1.91X - 0.007471X² R² = 99.10**
0.00 0.05 0.10 0.15 0.20 0.25 0.30 0.35 0.40 0.45 0.50
0 40 80 120 160
Pho
spho
rus
ac
cu
m
ul
at
io
n
(g
pl
an
t
-1 )
P doses (kg ha-1) CASERTA
Y = 0.03 + 0.003X R² = 95.47** ALÍCIA
Y = 0.07 + 0.002X R² = 97.85**
0.00 0.05 0.10 0.15 0.20 0.25 0.30 0.35 0.40 0.45 0.50
0 40 80 120 160
Pho
spho
rus
ac
cu
m
ul
at
io
n
(g
pl
an
t
-1)
P doses (kg ha-1) CASERTA
Y = 0.09 + 0.002X R² = 87.30** ALÍCIA
Y = 0.03 + 0.0058X - 0.000021X² R² = 99.08**
A. B.
behavior was observed for Caserta in period 2, with maximum of 110 g plant-1; however, Alícia showed a quadratic response and a maximum of 147 g plant-1 was obtained at the dose of 127.60 kg ha-1 of P
2O5 (Figure 2B).
The beneficial effect of P on zucchini dry matter production is consistent with the results found in the literature; in lettuce, Kano et al. (2012) and Mantovani et al. (2014) also observed positive response with addition of increasing doses of P, and a quadratic behavior in dry matter production.
P accumulation in the plant followed the same trend of dry matter, i.e., in period 1, the maximum values estimated for the cultivars Alícia (0.43 g plant-1) and Caserta (0.45 g plant-1) were obtained at the maximum P dose (Figure 2C). In period 2, Caserta accumulated 0.41 g plant-1 at the maximum P dose and Alícia, 0.43 g plant-1 at the dose of 132 kg ha-1 of P
2O5 (Figure 2D). In beet, Avalhaes et al. (2009) also observed a linear behavior as a function of the increase in P doses.
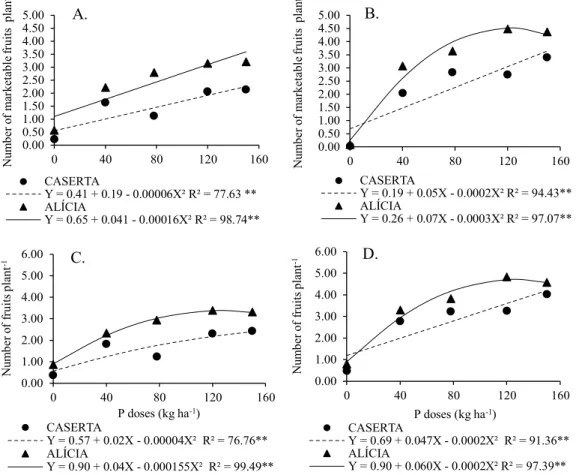
The means of number of marketable fruits (NMF) and total number of fruits per plant (TNF) as a function of P doses fitted to the quadratic regression model, for the cultivars Alícia and Caserta, in both cultivation periods (Figure 3), as observed by Oliveira et al. (2013) in the zucchini crop.
Maximum estimated values of NMF were respectively 3.3 and 2.1 for Alícia and Caserta, with application of 128 and 150 kg ha-1 of P
2O5 (period 1). In period 2, the values were 4.3 and 3.3 at the doses of 117 and 125 kg ha-1 of P
2O5 for Alícia and Caserta, respectively (Figures 3A and B). Considering the doses that led to maximum NMF, in period 1, Alícia and Caserta showed respective increments of 79.37 and 80.47% in NMF compared with plants not fertilized with P. In period 2, these increments were higher, 94.35 and 94.06%.
Maximum TNF values were also estimated at doses very close or equal to those mentioned for NMF, because the number of unmarketable fruits per plant (length < 16 cm and/ or with injuries) was low. The maximum values estimated were respectively 3.5 and 2.4 fruits, obtained at doses of 129 and 150 kg ha-1 of P
2O5 for the cultivars Alícia and Caserta (period 1) (Figure 3C), and 4.7 and 3.4 fruits in period 2, obtained at doses of 150 and 126 kg ha-1 of P
2O5 (Figure 3D). Alícia, regardless of P dose, produced higher number of fruits plant-1 compared with Caserta, in both cultivation periods.
The increase in the number of fruits due to phosphate fertilization has also been found in other Cucurbits, such as cucumber (Santos et al., 2014), melon (Mendoza-Cortez et al., 2014) and watermelon (Gonçalves et al., 2013).
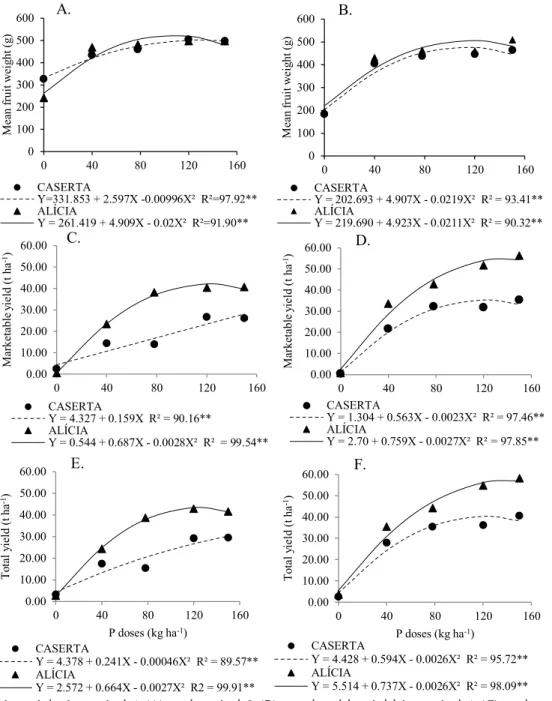
Maximum fruit weights (FW) were 523.35 and 501.14 g, obtained at doses of 107 and 130 kg ha-1 of P
2O5, respectively for the cultivars Alícia and Caserta, in period 1 (Figure 4A); in period 2, the values were 506.84 and 477.15 g, at doses of 117 and 112 kg ha-1 P
2O5 for the cultivars Alícia and Caserta (Figure 4B).
Lower TNF per plant in period 1 contributed to the higher FW, compared with period 2, in both cultivars. Lúcio et al. (2008), in the zucchini crop, also observed values similar to those of the present study and responses also different between periods, varying from 454.0 to 481.0 g in the summer/winter season and from 597.4 to 598.2 g in the spring/summer. In melon, Costa et al. (2011) also observed increase in mean weight with increments in the tested P doses.
Mean values of marketable yield (MY) fitted to quadratic models. In period 1 (Figure 4C), the doses that maximized MY in the cultivars Alícia (42.68 t ha-1) and Caserta (28.13 t ha-1) were
Figure 3.Number of marketable fruits per plant in period 1 (A) and period 2 (B), and total number of fruits in period 1 (C) and period 2 (D) of Italian zucchini for the cultivars Alícia (■) and Caserta (●), as a function of phosphorus – P doses
0.00 0.50 1.00 1.50 2.00 2.50 3.00 3.50 4.00 4.50 5.00
0 40 80 120 160
N
um
be
ro
f
m
ar
ketabl
e
fr
ui
ts
plant
-1
CASERTA
Y = 0.41 + 0.19 - 0.00006X² R² = 77.63 ** ALÍCIA
Y = 0.65 + 0.041 - 0.00016X² R² = 98.74**
0.00 0.50 1.00 1.50 2.00 2.50 3.00 3.50 4.00 4.50 5.00
0 40 80 120 160
N
um
be
ro
f
m
ar
ke
ta
bl
e
fr
ui
ts
plant
-1
CASERTA
Y = 0.19 + 0.05X - 0.0002X² R² = 94.43** ALÍCIA
Y = 0.26 + 0.07X - 0.0003X² R² = 97.07**
0.00 1.00 2.00 3.00 4.00 5.00 6.00
0 40 80 120 160
N
um
be
ro
f
fr
ui
ts
plant
-1
P doses (kg ha-1) CASERTA
Y = 0.57 + 0.02X - 0.00004X² R² = 76.76** ALÍCIA
Y = 0.90 + 0.04X - 0.000155X² R² = 99.49**
0.00 1.00 2.00 3.00 4.00 5.00 6.00
0 40 80 120 160
N
um
be
ro
f
fr
ui
ts
plant
-1
P doses (kg ha-1) CASERTA
Y = 0.69 + 0.047X - 0.0002X² R² = 91.36** ALÍCIA
Y = 0.90 + 0.060X - 0.0002X² R² = 97.39**
A. B.
Figure 4. Mean fruit weight in period 1 (A) and period 2 (B), marketable yield in period 1 (C) and period 2 (D) and total yield in period 1 (E) and period 2 (F) of Italian zucchini for the cultivars Alícia (■) and Caserta (●), as a function of phosphorus – P doses
0 100 200 300 400 500 600
0 40 80 120 160
Mean
fr
ui
tw
ei
gh
t(
g)
CASERTA
Y=331.853 + 2.597X -0.00996X² R²=97.92** ALÍCIA
Y = 261.419 + 4.909X - 0.02X² R²=91.90**
0 100 200 300 400 500 600
0 40 80 120 160
Mean
fr
ui
tw
ei
gh
t(
g)
CASERTA
Y = 202.693 + 4.907X - 0.0219X² R² = 93.41** ALÍCIA
Y = 219.690 + 4.923X - 0.0211X² R² = 90.32**
0.00 10.00 20.00 30.00 40.00 50.00 60.00
0 40 80 120 160
Marketabl
ey
ield
(t ha
-1)
CASERTA
Y = 4.327 + 0.159X R² = 90.16** ALÍCIA
Y = 0.544 + 0.687X - 0.0028X² R² = 99.54**
0.00 10.00 20.00 30.00 40.00 50.00 60.00
0 40 80 120 160
Marketabl
ey
ield
(t ha
-1)
CASERTA
Y = 1.304 + 0.563X - 0.0023X² R² = 97.46** ALÍCIA
Y = 2.70 + 0.759X - 0.0027X² R² = 97.85**
0.00 10.00 20.00 30.00 40.00 50.00 60.00
0 40 80 120 160
To
tal
yi
el
d(
th
a
-1)
P doses (kg ha-1) CASERTA
Y = 4.378 + 0.241X - 0.00046X² R² = 89.57** ALÍCIA
Y = 2.572 + 0.664X - 0.0027X² R2 = 99.91**
0.00 10.00 20.00 30.00 40.00 50.00 60.00
0 40 80 120 160
Tot
al y
ield
(t
ha
-1)
P doses (kg ha-1) CASERTA
Y = 4.428 + 0.594X - 0.0026X² R² = 95.72** ALÍCIA
Y = 5.514 + 0.737X - 0.0026X² R² = 98.09**
A. B.
C. D.
E. F.
respectively 123 and 150 kg ha-1 P
2O5. In period 2 (Figure 4D), maximum MY values for Alícia and Caserta were respectively 56.04 and 35.76 t ha-1, obtained at doses of 140 and 122 kg ha-1 P2O5. The constant results of the present study indicate that the effect of phosphate fertilization on the yield of zucchini cultivars occurred because of the increment in number and mean weight of fruits; therefore, these characteristics are important for the yield of the crop. For unmarketable yield, there were no significant fits of models, and the mean values were 1.8 and 3.27 t ha-1 for Alícia and Caserta, respectively.
Maximum total yields of fruits were 43.39 and 30.13 t ha-1 respectively, for Alícia and Caserta, at doses of 123 and 150 kg ha-1 in period 1 (Figure 4E), and 57.74 and 41.18 t ha-1 with application of 142 and 124 kg ha-1 P
2O5 in period 2 (Figure 4F). Castagnino et al. (2007), evaluating P doses on the zucchini cultivar Scallop, obtained yields from 42.55 to 54.25 t ha-1 with P dose ranging from 100 to 300 kg ha-1, close to those of the present study.
Cultivation from July to September 2016 (period 2) promoted higher production of fruits compared with the cultivation from August to November 2015 (period 1). Higher incidence of pests, especially leaf-miner fly (Liriomyza spp.) in period 1, caused a reduction in leaf area, directly influencing fruit production. Between the cultivars, Alícia was superior to Caserta. This is due to the superiority of the hybrids compared with the cultivars of open pollination, in the higher production and uniformity of fruits per plant, vigor of the plant, allowing higher number of harvests. In addition, Alícia showed good adaptability to the conditions of cultivation.
Conclusions
higher for Alícia than for Caserta from July to September 2016.
2. The cultivar Alícia, regardless of cultivation period, was superior to Caserta.
3. Zucchini cultivation from July to September 2016 led to higher fruit production compared with the period from August to November 2015.
Literature Cited
Abrêu, F. L. G. de.; Cazetta, J. O.; Xavier, T. F. Adubação fosfatada no meloeiro-amarelo: Reflexos na produção e qualidade dos frutos. Revista Brasileira Fruticultura, v.33, p.1266-1274, 2011. https:// doi.org/10.1590/S0100-29452011000400027
Araújo, H. S.; Cardoso, A. I. I.; Oliveira Júnior, M. X. de; Magro, F. O. Teores e extração de macronutrientes em abobrinha-de-moita em função de doses de potássio em cobertura. Revista Brasileira Ciências Agrárias, v.10, p.389-395, 2015. https://doi.org/10.5039/ agraria.v10i3a4937
Avalhaes, C. C.; Prado, R. de M.; Gondim, A. R. de O.; Alves, A. U.; Correia, M. A. R. Rendimento e crescimento da beterraba em função da adubação com fósforo. Revista Scientia Agraria, v.10, p.75-80, 2009. https://doi.org/10.5380/rsa.v10i1.13173
Castagnino, A. M.; Díaz, K. E.; Sastre, P. V.; Navarro, M. D. Respuesta
de plántulas de Cucurbita pepo var. Scallop a la fertilización
fosfórica. Revista Colombiana de Ciências Hortícolas, v.1, p.214-221, 2007. https://doi.org/10.17584/rcch.2007v1i2.1162 Costa, C. L. L.; Batista, J. E.; Costa Júnior, C. de O.; Santos, A. P. dos.;
Silva, M. L. da. Uso de adubo fosfatado na cultura do melão em solos de origem calcária. Revista Verde de Agroecologia e Desenvolvimento Sustentável, v.6, p.58-62, 2011.
Ferreira, D. F. Sisvar: A computer statistical analysis system. Revista Ciência e Agrotecnologia, v.35, p.1039-1042. 2011. https://doi. org/10.1590/S1413-70542011000600001
Filgueira, F. A. R. Novo manual de olericultura. 3.ed. Viçosa - MG: UFV, 2012. 421p.
Gaitán, H. A. R.; Fuentes, H. R.; Zacarias, M. del C. O.; Contreras, J. A. V.; Maldonado, A. I. L. Curvas de absorción de macronutrientes
en calabacita italiana (Cucurbita pepo L.). Revista Fitotecnia
Mexicana, v.35, p.57-60, 2012.
Gonçalves, F. C. Produtividade e qualidade de cultivares de melancia em função de doses de fósforo. Mossoró: UFERSA, 2013. 50p. Dissertação Mestrado
Jandel Scientific. User´s manual. Califórnia: Jandel Scientific, 1991. 280p.
Kano, C.; Cardoso, A. I. I.; Villas Boas, R. L.Acúmulo de nutrientes
e resposta da alface à adubação fosfatada. Revista Biotemas, v.25, p.39-47, 2012. https://doi.org/10.5007/2175-7925.2012v25n3p39 Lúcio, A. D.; Carpes, R. H.; Storck, L.; Lopes, S. J.; Lorentz, L.
H.; Paludo, A. L. Variância e média da massa de frutos de abobrinha-italiana em múltiplas colheitas. Revista Horticultura Brasileira, v.26, p.335-341, 2008. https://doi.org/10.1590/S0102-05362008000300009
Mantovani, J. R.; Oliveira, I. A. da C; Marques, D. J.; Silva, A. B. da; Landgraf, P. R. C. Teores de fósforo no solo e produção de alface crespa em função de adubação fosfatada. Revista Ciências Agrárias, v.35, p.2369-2380, 2014. https://doi.org/10.5433/1679-0359.2014v35n4Suplp2369
Mendoza-Cortez, J. W.; Cecílio Filho, A. B.; Grangeiro, L. C.; Oliveira, F. H. T. de. Influence of phosphorus fertilizer on melon (Cucumis melo L.) production. Australian Journal of Crop Science, v.8, p.799-805, 2014.
Oliveira, N. L. C. de; Puiatti, M.; Bhering, A. da S.; Cecon, P. R.; Santos, R. H. S.; Silva, G. do C. C. da. Crescimento e produção da abobrinha em função de concentração e via de aplicação da urina de vaca. Revista Brasileira de Agropecuária Sustentável, v.3, p.129-136, 2013.
Rêgo, L. G. da S.; Martins, C. M.; Silva, E. F. da.; Silva, J. J. A. da.; Lima, R. N. da S. Pedogenesis and soil classification of an experimental farm in Mossoró, state of Rio Grande do Norte,
Brazil. Revista Caatinga, v.29, p.1036-1042, 2016. https://doi.
org/10.1590/1983-21252016v29n430rc
Ribeiro, A. C.; Guimarães, P. T. G.; Alvarez V., V. H. Recomendações para o uso de corretivos e fertilizantes em Minas Gerais. 5.ed. Viçosa: UFV, 1999. 359p.
Santos, E. R. dos.; Salgado, F. H. M.; Cerqueira, A. P. de.; Pereira, P. R.; Nascimento, I. R. do. Produção de pepino tipo conserva em função de doses de fósforo. Revista Nucleus, v.11, p.403-408, 2014. Tedesco, M. J.; Gianello, C.; Bissani, C. A.; Bohnen, H.; Volkweiss, S.
J. Análises de solo, plantas e outros materiais. 2.ed. Porto Alegre: Universidade Federal do Rio Grande do Sul, 1995. 174p. Boletim Técnico, 5