Consumer preference for warm or cool climate wine styles
is dependent on emotional responses and familiarity
Francisco de Jesus Chaveiro Ribeiro Antunes
Dissertation to obtain a Master’s Degree in
Viticulture and Enology Engineering
Advisor: Manuel José de Carvalho Pimenta Malfeito Ferreira
Advisor: Mariana da Silva Gomes Mota
Jurí:
Presidente: Doutor Jorge Manuel Rodrigues Ricardo da Silva, Professor Catedrático do Instituto Superior de Agronomia da Universidade de Lisboa.
Vogal: Doutor Manuel José de Carvalho Pimenta Malfeito Ferreira, Professor Auxiliar com Agregação do Instituto Superior de Agronomia da Universidade de Lisboa.
Vogal: Doutor Aníbal José Simões Coutinho, Especialista na SONAE.
“Nothing more excellent or valuable than wine was every granted by the gods to man." Plato
III
Acknowledgments
I would first like to express my deepest gratitude to my thesis advisor, Professor Manuel Malfeito Ferreira, of Instituto Superior de Agronomia. His knowledge, availability, openness and friendship have enriched not only my thesis, but also my thinking and vision regarding the wine world. His pragmatism and way of seeing and understanding wine, made my wine passion rise, and consequently my desire to learn new things and explore other ways of thinking with more pragmatism and objectivity has increased and continues to increase as I go learning, and this is to be exalted.
Futhermore, I would like to thank Doctor Mariana Mota of Instituto Superior de Agronomia, for her valuable help in the statistical part and orientation of the work. Thank you also for her eternal patience, friendship and affection towards all the students. A fundamental person in my work and who contributed much more to me than guidance on my thesis. Her willingness to help, collaborate and guide is to be praised.
I would also like to express my most sincere thanks to Professor Jorge Ricardo da Silva, who has accompanied me in my university development since joining ISA and for his profound knowledge and teaching, to Professor Sofia Catarino for her exemplary method of teaching and rigor in the way of presenting knowledge and work. I also thank Professor Carlos Lopes, for his charisma, rigor, passion and pragmatism, which was instilled in me throughout my university career.
To D. Elena, D. Manuela and Mr. Antonio for being always available to help during the year’s sessions, for their patience and constant kindness.
To the tasters who participated in our tastings, and showed the greatest patience and will to help along the thesis.
To all my friends, for their deep friendship for a long time, who have always supported me and are present in all the important phases of my life, a sincere thank you, they are like family to me. To Zilhão, Quilho and Pedro, my all-time best friends and a special thanks to António, that invited me to wine tasting workshop, which triggered my wine passion.
Last but not least, my family that loves me unconditionally, that has always been with me since the moment I was born. A special thanks to my cousin, Francisco, who is a brother to me, who lived with me, and instilled in me tastes, ideas and values. To my parents, Rui and Jessé, whom I love and who have always supported me, they are a safe haven for me, and people who are a reference for all my life. An eternal thanks to my two grandfathers, António and Joaquim, who, in addition to their affection, instilled in me, subconsciously I believe, to the incredible world that is the wine world.
IV
Abstract
The present work was aimed at the evaluation of a new wine tasting method based on emotional responses by a large consumer group. Subjects were characterized according to gender, smoking habits, wine knowledge, frequency of wine consumption, vinotype, 6-n-propylthiouracil (PROP) status and dark glass test. A total of 143 tasters evaluated 2 white and 2 red wines with different styles comprising emotional responses elicited by sensory perceptions. Consumers ranked the wines with a numerical scale (1 to 5) according to their preference and were asked about wine familiarity.
Overall, tasters provided higher liking scores for white and red wines consistent with the international commercial style, with high odour intensity and smooth mouthfeel, in opposition to wines with low smell intensity and aggressive mouthfeel. Global evaluation was only dependent on age, individuals younger than 35 years olds giving higher scores to all wines. The Global Evaluation score was highly correlated with the mouth Impression in Relation to Odour (r2=0.83) and with lower correlations with Expectation for the Mouthfeel induced by
odour (r2=0.52), Initial Odour Impression (r2=0.50) and Colour Impression (r2=0.25).
Familiarity was moderately correlated with wine Global Evaluation (r2=0.49).
Consumers were grouped based on the preferred wine styles. The “Primary” group (38 individuals) scored with 4 or 5 the international commercial style wines (“easy” wines), while the “Perceptive” group (16 individuals) gave scores of 4 or 5 to the cool climate wine styles (“difficult” wines). The largest group, the “Universals” was composed by individuals scoring these two wine styles with scores ranging from 1 to 5. The “Primary” group was characterized by showing responses of high pleasantness to colour, odour and taste to the “easy wines”, which were considered as familiar. The “difficult” wines were regarded as unpleasant and unfamiliar by this group. All wines were considered equally familiar by the “Perceptive” tasters who recognized the higher quality of the “difficult” wines. The “Universal” group behaved similarly to the “Primary” when tasting red wines, differing in equal preference for both white wines.
In conclusion, emotional responses elicited by wine tasting proved to be a powerful tool to explain wine consumer preferences thus providing guidance to the development of marketing strategies.
V
Resumo
O presente trabalho teve como objectivo a avaliação de um novo método de prova de vinhos baseado em respostas emocionais de um grande grupo de consumidores. Os indivíduos foram caracterizados quanto ao sexo, tabagismo, conhecimento de vinho, frequência de consumo de vinho, vinotype, estado de 6-n-propiltiouracil (PROP) e teste de copo preto. 143 provadores avaliaram 2 vinhos brancos e 2 vinhos tintos com diferentes estilos, avaliando respostas emocionais provocadas por percepções sensoriais. Os consumidores classificaram os vinhos com uma escala numérica (1 a 5) de acordo com a sua preferência e foram questionados sobre a familiaridade do vinho.
Em geral, os provadores atribuíram melhores pontuações de prova a vinhos brancos e tintos consistentes com o estilo comercial internacional, com alta intensidade aromática e sensação de suavidade na boca, em oposição a vinhos com baixa intensidade aromática e sensação agressiva na boca.
A avaliação da Avaliação Global foi altamente correlacionada com a Impressão da boca em relação ao odor (R2 = 0,83) e com menores correlações com a Expectativa para a boca (R2
= 0,52), Impressão inicial (R2 = 0,50) e Cor (R2 = 0,25). A Familiaridade foi moderadamente
correlacionada com a Avaliação Global do vinho (R2 = 0,49).
Os consumidores foram agrupados com base nos estilos de vinho. O grupo Primário (38 indivíduos) avaliou com 4 ou 5 vinhos internacionais de estilo comercial (vinhos fáceis), enquanto o grupo Perceptivo (16 indivíduos) deu notas de 4 ou 5 aos estilos de vinho de clima frio (vinhos difíceis). O maior grupo, os Universais, foi composto por indivíduos que pontuaram estes dois estilos de vinho com pontuações que variaram de 1 a 5. O grupo Primário caracterizou-se por apresentar respostas de alta agradabilidade à cor, aroma e sabor aos vinhos fáceis, que foram considerados familiares. Os vinhos difíceis foram considerados desagradáveis e desconhecidos por esse grupo. Todos os vinhos foram considerados igualmente familiares pelos provadores Perceptivos que reconheceram a maior qualidade dos vinhos difíceis. O grupo Universal comportou-se de forma semelhante ao Primário ao saborear os vinhos tintos, diferindo em igual preferência pelos dois vinhos brancos.
Em conclusão, as respostas emocionais provocadas pela prova de vinhos provaram ser uma boa ferramenta para explicar as preferências do consumidor de vinhos, fornecendo orientação para o desenvolvimento de estratégias de marketing.
VI Palavras-chave: prova de vinhos, preferência de vinhos, familiaridade, respostas emocionais, vinhos de clima frio
VII
Resumo Alargado
O presente trabalho teve como objectivo a avaliação de prova de vinhos baseada em emoções. O painel de prova foi composto por 33 pessoas treinadas que foram caracterizados quanto ao género, hábitos de tabaco, conhecimento de vinho, frequência de consumo de vinho, vinotype, estado de 6-n-propiltiouracil (PROP) e teste do copo preto. Outras 110 pessoas não treinadas só fizeram a prova emocional.
As provas do painel treinado decorreram durante 4 meses, de Fevereiro a Maio de 2017, no Laboratório de Microbiologia, no Instituto Superior de Agronomia, enquanto que as provas do painel não treinado tiveram a duração de 2 meses, de Outubro a Novembro de 2017, no escritório da MBR Consultores.
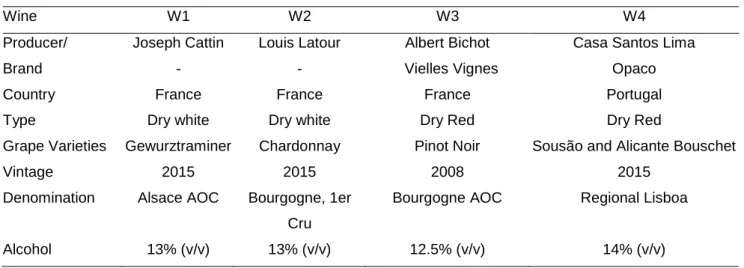
Os quatro vinhos que foram usados na prova emocional tinham características e descritores muito diferentes. O primeiro foi um Gewurztraminer da Alsácia (1), o segundo foi um Chardonnay da Borgonha (2), o terceiro foi um Pinot Noir da Borgonha (3) e o quarto foi um vinho tinto encorpado - Opaco (4). Estes, podem ser classificados em vinhos fáceis ou difíceis, então o (1) e (4) são considerados vinhos fáceis, enquanto o (2) e (3) são considerados vinhos difíceis.
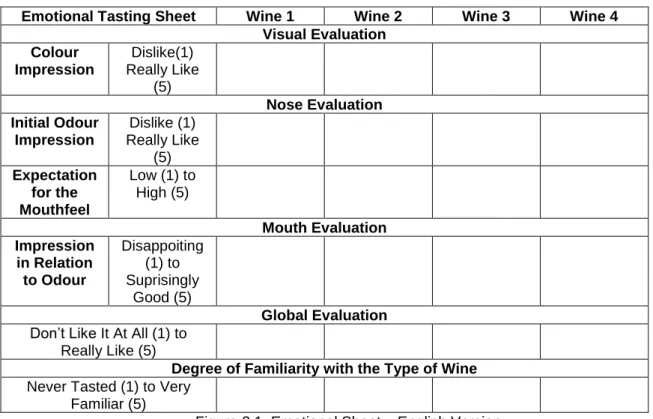
A ficha de prova emocional foi simplificada e baseada em trabalhos anteriores, com o objectivo de fazer uma análise mais objectiva e conclusiva. As categorias do provador em cada ficha de prova foram: nome, idade, sexo, hábitos alimentares, alergias alimentares, hábitos tabágicos, frequência, conhecimento, teste do copo preto, PROP, vinotype e treino. Em cada parâmetro da prova, uma emoção específica é descrita e avaliada, usando 1 a 5 pontos em cada parâmetro. A ficha de prova emocional tem seis parâmetros no total: Cor, Primeira Impressão, Expectativa para a Boca, Avaliação da Boca - Impressão Relacionada ao Odor, Avaliação Global e Familiaridade.
Este trabalho é uma continuação e desenvolvimento de teses anteriores, também relacionadas com a emoção na prova dos vinhos. Foi utilizada uma ficha de prova, como anteriormente descrita, e a mesma tem como utilidade a facilitação entre enólogos e consumidores. A novidade desta ficha aborda a relação entre os descritores emocionais do vinho e as suas características emocionais. A tese tem como objectivos a avaliação de uma ficha de prova simplificada usando apenas perguntas de natureza emocional, na distinção entre vinhos de diferentes estilos, determinar a influência da familiaridade na avaliação global e determinar quais as características do provador que influenciam a apreciação global.
VIII Relativamente à avaliação dos vinhos, em geral, os vinhos considerados fáceis (Vinho 1 e Vinho 4) tiveram melhores pontuações em todos os parâmetros emocionais. No descritor Cor, o Vinho 4 teve melhores pontuações comparativamente aos outros vinhos, independentemente de serem fáceis ou difíceis ou brancos ou tintos. Na Primeira Impressão, o Vinho 4 teve novamente melhores pontuações seguido do Vinho 1 e por fim do Vinho 2 e Vinho 3, ou seja, uma melhor pontuação para os vinhos fáceis. Assim como na Expectativa para a Boca, teve pontuações iguais face ao descritor anterior. Relativamente à Avaliação da Boca - Impressão Relacionada ao Odor e à Avaliação Global, é onde se nota mais a diferença entre os Vinhos 1 e 4 e Vinhos 2 e 3, tenho os Vinhos 1 e 4 muito melhores pontuações do que os Vinhos 2 e 3. Por fim, na Familiaridade o Vinho 4 teve melhores pontuações, seguidos pelo Vinho 1 e depois Vinhos 2 e Vinhos 3.
A avaliação da Avaliação Global foi altamente correlacionada com a Impressão da boca em relação ao odor (R2 = 0,83) e com menores correlações com a Expectativa para a boca (R2
= 0,52), Impressão inicial (R2 = 0,50) e Cor (R2 = 0,25). A Familiaridade foi moderadamente
correlacionada com a Avaliação Global do vinho (R2 = 0,49). Realizou-se também uma
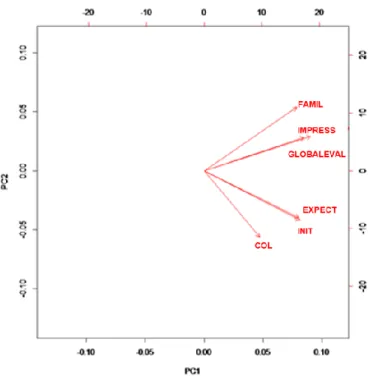
Análise de Componentes Principais (ACP) para corroborar os resultados dos coeficientes de determinação.
Na categorização do consumidor, os factores da idade, alergias, frequência, conhecimento, PROP e vinotype e o treino influenciaram as notas, enquanto que o sexo, hábitos alimentares, fumar e o teste do copo preto não influenciaram. Relativamente à idade conclui-se que em todos os factores emocionais, os provadores mais novos deram notas mais elevadas aos vinhos. Pessoas com alergias dão melhores notas na Cor e na Primeira Impressão. Relativamente à frequência de consumo de vinho, pessoas que nunca bebem vinho dão piores notas na Impressão em Relação ao Odor e na Familiaridade. No conhecimento, apenas as pessoas que se consideram novatas, só dão piores notas na Familiaridade. Relativamente ao PROP, os Non-Tasters dão piores notas na Impressão Inicial e na Familiaridade. No vinotype, retirando o factor da Familiaridade, todas as pessoas que não responderam ao questionário deram piores notas aos factores. Por fim, no treino, o painel não treinado deu piores notas na Cor, Primeira Impressão e Expectativa para a Boca. Em relação à Familiaridade nos vinhos, mostrou-se uma clara tendência em todos os factores emocionais. Os provadores que deram boas notas na Familiaridade, também deram boas notas na Avaliação Global, e o contrário também se verifica. Ou seja, provadores que deram más notas na Familiaridade, em geral, deram piores notas na Avaliação Global. Por fim, foram feitas três segmentações. Os consumidores foram agrupados com base nos estilos de vinho preferidos. O grupo Primário (38 indivíduos) avaliou com 4 ou 5 vinhos
IX internacionais de estilo comercial (vinhos fáceis), enquanto o grupo Perceptivo (16 indivíduos) deu notas de 4 ou 5 para os estilos de vinho de clima frio (vinhos difíceis). O maior grupo, os Universais, foi composto por indivíduos que pontuaram estes dois estilos de vinho com pontuações que variaram de 1 a 5. O grupo Primário caracterizou-se por apresentar respostas de alta agradabilidade à cor, aroma e sabor aos vinhos fáceis, que foram considerados familiares. Os vinhos difíceis foram considerados desagradáveis e desconhecidos por esse grupo. Todos os vinhos foram considerados igualmente familiares pelos provadores Perceptivos que reconheceram a maior qualidade dos vinhos difíceis. O grupo Universal comportou-se de forma semelhante ao Primário ao saborear os vinhos tintos, diferindo em igual preferência pelos dois vinhos brancos.
Em conclusão, houve uma clara diferença na percepção entre os vinhos fáceis e difíceis. O vinho 1 e vinho 4 tiveram melhores notas em todos os descritores emocionais do que o vinho 2 e vinho 3. Na Avaliação Global, a Impressão em Relação ao Odor apresentou o maior R2 e a Familiaridade tem um papel fundamental na percepção dos vinhos.
Relativamente a segmentação, a idade foi o factor mais diferenciador. Por fim, outro destaque para a familiaridade, um descritor emocional fundamental que necessita de um maior desenvolvimento e pesquisa.
Palavras-chave: prova de vinhos, preferência de vinhos, familiaridade, respostas emocionais.
X
List of Figures
Figure 1.1. Warm Climate vs Cool Climate Map (Puckette, 2012). 9
Figure 2.1. Emotional Sheet – English Version 24
Figure 3.1. First factorial correlation plot of the PCA based on emotional and familiarity
responses. 32
XI
List of Tables
Table 1.1. Human factors affecting sensory analysis (adapted from Kemp, 2009). 4 Table 1.2. Sensory attributes of white wines found to be related to liking for cluster of wine consumers from preference mapping studies (Francis and Williamson, 2015) 14 Table 1.3. Sensory attributes of red wines found to be related to liking for clusters of wine consumers from preference mapping studies (Francis and Williamson, 2015) 15 Table 1.4. Categories of Vinotype personalization test (adapted from Hanni, 2013 and
Borchgrevink and Sherwin, 2017) 16
Table 1.5. Typical comments from an average consumer in a wine tasting (adapted from
Loureiro et al., 2016). 18
Table 1.6. Main correlations between variables of the emotional tasting sheet. 19 Table 2.1. Brand and technical characteristics of the wines used in the emotional tasting. 23 Table 2.2. Sensorial characteristics of the wines used in the emotional tasting. 23
Table 3.1. Consumer Categorization 27
Table 3.2. Mean Wine global evaluation scores using the emotional tasting sheet 28 Table 3.3. Correlations between all the emotional descriptors 29 Table 3.4. Statistical parameters of the correlation between Global Evaluation and the other
tasting parameters. 29
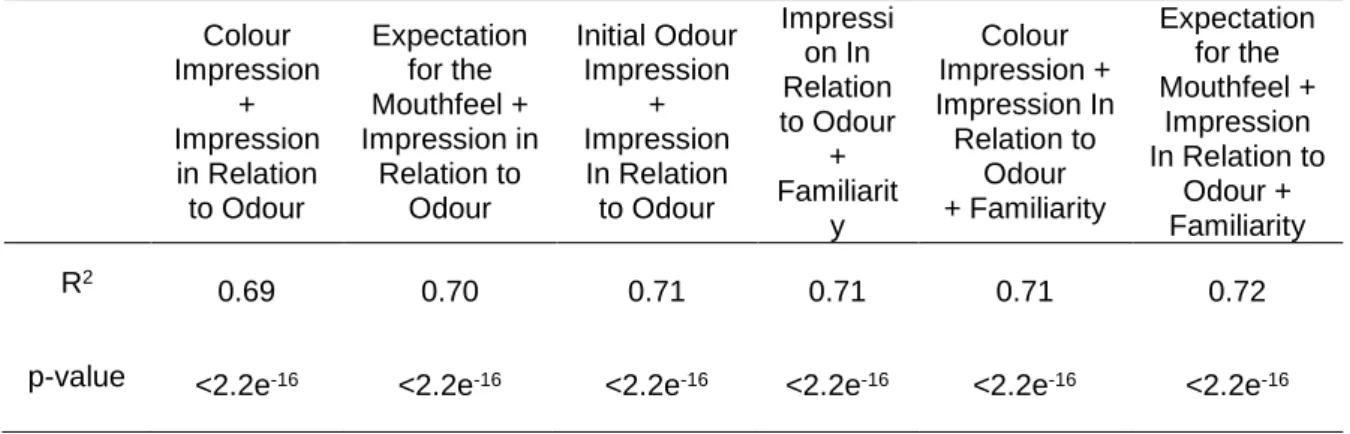
Table 3.5. Statistical parameters obtained for linear adjustments between Global Evaluation
and more than one tasting parameters. 30
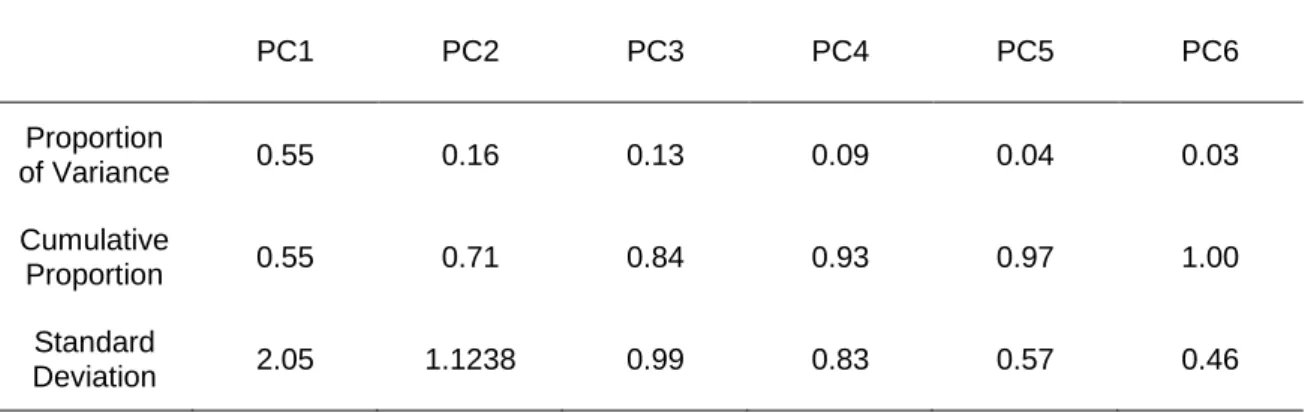
Table 3.6. Proportion of explained variance by each PCA. 31
Table 3.7. Coordinates of each variable for PCA1 and PCA 2. 31 Table 3.8. Mean consumer scores Categorization on the Emotional Descriptors 33 Table 3.9. .Mean Emotional responses according to Familiarity scores. 34
Table 3.10. Mean Wine Evaluation of the “Primary” tasters. 36
Table 3.11. Mean Wine Evaluation of the “Perceptive” tasters. 37 Table 3.12. Mean Wine Evaluation of the “Universal” tasters. 38 Table 3.13. Composition of consumer categories according to wine style preference groups.
XII
List of Annexes
1. Tasting Sheets
49a. Demographic information/Saliva test 49
b. Vinotype 50
c. Evaluation of Sensations 51
d. PROP Status, Sodium Cloride, Tartaric Acid, Tannic Acid and Sucrose Intensity (Water) 53
e. Emotional Tasting Sheet 54
2. Wine Data Sheet
56a. Gewurztraminer Alsace Joseph Cattin 56
b. Chardonnay Premier Cru Bourgogne Louis Lattour 57
c. Albert Bichot Bourgogne Vielles Vignes de Pinot Noir 58
d. Opaco Casa Santos Lima 59
3. Data
60a. Correlation between familiarity and wines 60
b. Correlation between familiarity and sex 65
c. Correlation between familiarity and age 68
d. Segmentation (Global Evaluation) Results 71
e. Segmentation (Colour Impression) Results 74
f. Segmentation (Initial Odour Impression) Results 77
g. Segmentation (Expectation for the Mouthfeel) Results 80 h. Segmentation (Impression in Relation to Odour) Results 83 i. Mean Global Evaluations between Wines and Categories 86
XIII
Table of Contents
1. Introduction ... 1
1.1 The multisensory wine perception ... 1
1.2 Tasting methods ... 3
1.2.1 Classical Methods ... 3
1.2.2 Limitations of sensory analysis and new methods ... 4
1.2.3 Emotional Tasting ... 5
1.3 Wine Styles ... 6
1.3.1 Warm vs Cool Climate Wine Styles ... 8
1.4 Consumer segmentation ... 9
1.4.1 Demographic, physiological, psychological and cultural features ... 9
1.4.1.1 PROP status ...10
1.4.1.2 Familiarity and Neophobia ...10
1.4.1.3 Expertise and training levels ...12
1.4.2 Segmentation based on wine style preference ...12
1.4.2.1 Factors affecting wine choice ...12
1.4.2.2 Examples of segmentation based on wine style preference ...15
1.5 Background and Objectives ...18
2. Material and Methods ...20
2.1 Taster Selection and Training ...20
2.2 Taster characterization ...21
2.2.1 Questionnaires ...21
2.2.2 Vinotype ...21
2.2.3 PROP ...21
2.2.4 Test of the dark glass ...22
2.3 Emotional Tasting ...22 2.3.1 Wines ...22 2.3.2 Emotional Sheet ...23 2.4 Data Analysis ...25 3. Results ...26 3.1 Taster Characterization ...26
3.2 Wine Global Evaluation ...28
3.3 Global evaluation prediction ...29
3.4 Principal Component Analysis (PCA) ...31
XIV
3.6 Influence of Familiarity on Wine Evaluation ...34
3.7 Wine Evaluation according to Style Preference ...35
3.7.1 “Primary” consumers ...36
3.7.2 “Perceptive” consumers ...37
3.7.3 “Universal” consumers ...38
4. Discussion ...41
5. Conclusions and Future Perspectives ...43
6. References ...44
1
1. Introduction
1.1 The multisensory wine perception
Wine sensory analysis has largely been developed to answer to the need of describing, assessing and evaluating wines. The focus has been put on the ability of the tasters to describe sensory attributes elicited by visual, smell and taste/mouthfeel sensations. However, human senses are not accurate measures of these sensations due to physiological or cognitive limitations. Smell and taste sensitivities are dependent on individual genome and so different responses to the same stimulus are most like likely to occur (Hayes and Pickering, 2012). Cognitively, the same descriptor can be attached to two different sensory perceptions or the same sensory perception with two different words (Lesschaeve, 2006), while cultural background is decisive for the interpretation of semantics related with wine description.
The act of drinking involves directly the senses of sight, smell, taste and touch. These senses are simultaneously stimulated and so it is not easy to define how each of them influences wine perception (Small, 2012).
The visual evaluation of a wine should not influence the taster in relation to the quality of the wine, only if it has a defect. However, wine color, as it is the first factor to be evaluated, may alter the perception of a wine, including the aroma and flavour (Parr et al., 2003).
Aroma can be defined as “the property of certain substances, in very small concentrations, to stimulate chemical sense receptors that sample the air or water surrounding an aroma” (Illy and Viani, 2005). According to the ASTM, it is the “perception resulting from stimulating the olfactory receptors; in a broader sense, the term is sometimes used to refer to the combination of sensations resulting from stimulation of the nasal cavity” (ASTM E253-03). ISO does not give a unique definition, describing it as “an odour with a pleasant connotation” or “organoleptic attribute perceptible by the olfactory organ via the back of the nose within tasting” (ISO 5496:1992).
Our ability to sense odour is dependent on two, small, seemingly insignificant patches of tissue in the upper recesses of our nasal passages. Volatile compounds reach the olfactory epithelium either directly, via the nostrils (orthonasal), or indirectly from the back of the throat (retronasal). The latter route is especially important in the generation of flavour. The term orthonasal olfaction used for when we inhale, or sniff, while retronasal olfaction occurs when volatiles are pulsed out from the back of the nose while eating and drinking. Orthonasal olfactory cues are key to setting our expectations concerning the sensory and hedonic attributes of food and drink; by contrast, retronasal olfactory cues are central to the experience of flavour (Spence, 2016).
2 Flavour is by far the most debated term and it varies according to the field of research. It is primarily dependent upon reactions to taste and olfactory receptors to the chemical stimulus. However, some flavors also involve tactile, temperature and pain receptors (Beidler, 1958). Therefore, flavor is a multi-modal perception deriving from the activity of neurons that respond to inputs from different sensory receptors (Small, 2012). The receptive field for flavor is the mouth, where smell, taste and touch are pooled and transformed into flavor percepts (Small, 2012).
Flavour influences food acceptance and selection of food intake, and helps us to distinguish potentially harmful compounds. The taste sensation is a very complex process starting at the sensory receptor level and finishing in the central nervous system, where it is combined with information coming from other senses. The sense of taste is a chemical sense due to taste stimuli falling on taste receptors located on the tongue called taste buds (Jackson, 2014). The gustatory sense produces the sensations of sweet, sour, salty, bitter, savory and umami. Taste is perceived through the oral cavity together with tactile sensations that always co-occur with taste (Small, 2012). The oral cavity also appears to be the source of olfactory stimuli, which are thus mis-localized. This perceptual illusion explains why the confusion between smell and taste is frequent and has been named as “oral referral” (Spence, 2016). This phenomenon is central to the multisensory flavor perception, being dependent on tactile capture of olfaction, the relative timing of olfactory and gustatory stimuli and gustatory capture (Spence, 2016). The more congruent a particular combination of smell and taste, the more likely the component unisensory stimuli will be bound together as a flavor object (Spence, 2016).
Mouth-feel is activated by free nerve endings, and gives rise to the sensations of astringency, dryness, viscosity, heat, coolness, prickling, and pain. The only textural aspect associated with wine is generated by the bursting of a sparkling wine’s bubbles. Their distribution throughout the oral cavity generates diffuse, poorly localized sensations. In wine, mouth-feel includes the perceptions of astringency, temperature, prickling, body, and burning. They derive from the stimulation of one or more of the (at least) four general categories of trigeminal receptors. These are mechanoreceptors (touch), thermoreceptors (heat and cold), nocireceptors (pain), and proprioreceptors (movement and position) (Jackson, 2014).
3 1.2 Tasting methods
1.2.1 Classical Methods
Classical methods for wine tasting have been developed and described since the works of Peynaud (1980) in France and of Amerine (1983) in USA. These methods are based on giving scores to wine sensory characteristics by filling tasting sheets. These sheets are used to train professionals not only in the academic and teaching parameters but are also seen as references by specialists and, despite its present diversity, there are only two major categories of wine tasting sheets: synthetic and analytic (Jackson, 2009). The former may be assessed holistically and/or hedonically, but they intend to evaluate qualitatively wines’ characteristics, such as balance, complexity, specific varietal attributes or development. The latter tend to evaluate quantitatively the major sensory attributes (color, aroma and taste). The various current descriptive methods derive from the method developed by Amerine and Roessler (1959), which comprises three stages: visual analysis, olfactory analysis and gustative analysis. This requires a great deal of training in the patterns of aromatic compounds, especially regarding the capacity for comparison, the memory of the sensations and the language in which they are expressed. This method requires three dimensions of the capacity for expression of sensation: physiological (perceptual capacity), psychological (perception and cognition) and sensory (perception and judgment) (Hederstam, 2009). Due to the difficulty of expressing the sensations Noble (1984) and his team developed a terminology that was supposed to facilitate the communication about wine characteristics and eventual defects, based on terms used in the beer industry. The so-called wheel of aromas intended to standardise the description of the wines and set more objective parameters for the aromatic qualities. Also as a way of assisting in the learning process in wine tastings in the traditional method, "Le Nez du Vin" (Lenoir, 1981) was developed, which basically consists of a set of approximately 60 extracts isolated from the aromatic compounds that can be found in wines, separated by groups of aromas that can be found in white wines, reds, and defects, a tool that is used in the training of wine professionals as a way to standardize the descriptions.
Because it is based on perceptions, the classical descriptive methods require standardization, which takes some time to prevent a beginner from feeling confident in assigning sometimes unclear descriptors to wines. The traditional method is also widely used by all schools of sommeliers (International Association of Sommeliers - ASI), wine experts (WSET), opinion makers (Decanter Magazine, Wine Advocate - Robert Parker, Wine Spirits Magazine among others), and also adopted by the International Organization of Vine and Wine (OIV).
4 1.2.2 Limitations of sensory analysis and new methods
Control of the human aspect of sensory evaluation is one of the more difficult factors of sensory evaluation. This may be accomplished best by carefully selecting the people that will be participating in the test. Important qualities in a sensory panelist include availability, dependability, interest, objectivity, stability, and acute senses of smell and taste (Stone and Sidel, 1985, Hootman, 1992, Meilgaard, 1991).
The long lists of aromas often seen on tasting notes raise high expectations and bring disillusion to consumers who do not recognize or are not capable to identify all the aromas or flavours that are supposedly present in the wine. The general public would be reassured to learn that even experts using their sensory abilities in their profession, like perfumers, cannot detect more than three or four different fragrances in complex odour mixtures (Livermore and Laing, 1998, Jinks, 2001). It all brings some doubts about the use of the extensive lexicon created by the experts when it comes to communicating about the qualities of a wine to the consumers. The sensory analysis seems to create a communication gap between wine experts and consumers.
Unlike instruments, human judgements can easily be affected by psychological or physiological factors (Table 1.1). The sensory professional must be aware of these factors and ensure that the chosen procedure and experimental design eliminate or reduce such bias (Kemp, 2009). In addition, when working with assessors from different cultures or geographical location, the sensory professional needs to be aware of the impact that cultural effects can have on sensory data (Kemp, 2009).
Table 1.1. Human factors affecting sensory analysis (adapted from Kemp, 2009). Psychological factors Physiological factors • Errors due to: expectation, distraction,
stimulus and logical, halo effect and proximity, central tendency and motivation
• Effects of: suggestion, order, contrast and convergence
• Attribute dumping, habituation, familiarity
• Adaptation
• Perceptual interactions between stimuli • Physical condition
Descriptive analysis is less suited for complex products especially when dealing with odours (Campo et al., 2010) as it is the case of wines. As a result of these limitations several alternative tasting methods have been developed that do not require description of flavours but are based on comparison with wine standards. Seminal reports described the Free Choice profile (Williams and Langron, 1984) and Repertory Grid (Thomson and McEwan, 1988) methods, which still require some training to improve taster reliability. To overcome these limitations, other approaches included Labeled Free sorting (Lawless et al., 1995),
5 Projective mapping (Risvik et al., 1994, Wilson et al., 2018), Napping® (Pagés, 2003), Flash Profile (Sierffermann, 2000), Ultra Flash Profile (Perrim et al., 2008), Check-all-that-apply (Adams et al., 2007), Polarized Sensory Positioning (Teillet et al., 2010) and Pivot© Profile (Thuiller et al., 2015).
This latter method seems especially suited for wine descriptions by professionals that are often reluctant to use classical sensory methods (Thuiller et al., 2015). To address this question of optimising the responses of professionals, Coulon-Leroy et al. (2017) proposed the Mixed Profiling method, combining Quantitative Descriptive Analysis ® and Free Choice profiling, which is claimed to provide a complete sensory wine characterisation in a short time. However, all these novel methodologies depend on sensory responses and require some sort of previous training. Another line of research has been developed where senses are an intermediate pathway to emotional responses, as described below.
1.2.3
Emotional TastingOne of the aspects usually found to differentiate consumer responses to food product consumption, beyond liking, is emotional response. Studies carried out by Barrena and Sanchez (2009) and Silva et al. (2016) showed that consumers discriminate between products more for their emotional benefits than for their technical or functional properties. Therefore, the study of consumer preferences and emotional responses could provide solutions for making their products more competitive to the wine industry by using the emotional characterization of beverages as a new marketing tool to connect with consumers (Barrena and Sanchez, 2009, Silva et al., 2016). Also, it has been argued that the conventional hedonic response itself is not enough to explain consumers’ response to products (Gutjar et al., 2013). Research conducted by Silva et al. (2016) found that emotions and liking were complementary for product characterization. However, while it is not always possible to differentiate products based on the degree of liking by the consumer, it is possible through the study of emotions.
Using emotions to differentiate between and within categories of food have proved to be significant (King and Meiselman, 2009). The emotional response to smelling odors is very complex and can be found in all the dimensions where olfaction plays a role, such as well-being, danger prevention, social interaction and memory (Chrea, 2009). For Desmet and Schifferstein (2008), emotions triggered by food can have 5 different sources: sensory properties, past experience, anticipated experience (such as anticipating health problems when eating unhealthy food), personal or cultural significance and third-party influence. Emotion is not a single response, but series of dynamic events that unfold over time (Sander,
6 2005). The temporal dominance of emotions (TDE) has shown, that during the consumption of 5 different chocolates, emotions, like sensations, were changing and evolving (Jager, 2014). A study also showed that some sensations and emotions were actually correlated thus providing some very interesting bases for more research that could help find a more sophisticated description of food products and wine (Jager, 2014). Ferdenzi (2011) used the methodology developed by (Chrea, 2009) to compare the emotional reactions to odour perception on the people of three countries with cultural differences (Switzerland, United Kingdom and Singapore). The dimensional organization of odour-related emotional attributes was significantly different from one country to another.
In wine, first studies described lists of emotional attributes elicited by wine on self-reported questionnaires (Ferrarini, 2010, Rive and Deneulin, 2014) and further reports highlighted the performance of consumers to distinguish between wines styles using emotional responses (Coste et al., 2015). Therefore, emotional responses not only bring new possibilities to differentiate wines, but also offer new perspectives of communication between experts and consumers.
1.3 Wine Styles
Wine style is a concept not easily defined by researchers and divulgation references frequently offer guidelines for the consumer to distinguish wines with different characteristics. For instance Puckette (2012) stated that wines can be separated by variety (e.g. Sauvignon Blanc or Syrah) or by region (e.g. Barossa or Bordeaux). This approach is said to be very accurate and learning demanding. This author further adds 9 broader styles which make learning about the thousands of wine varieties and regions much easier. The 9 primary wine styles are: Full-Bodied Red Wines, Medium-Bodied Red Wines, Light-Bodied Red Wines, Rosé Wines, Full-Bodied White Wines, Light-Bodied White Wines, Aromatic White Wines, Dessert and Fortified Wines and Champagne and Sparkling Wines (Puckette, 2012):
i) Full-Bodied Red Wines, typically have more tannin, higher alcohol, and dark fruit flavours such as black currant. Examples: Syrah, Cabernet Sauvignon and Malbec.
ii) Medium-Bodied Red Wines, in the middle of the gamut from light to full, medium-bodied reds are some of the best food-friendly wines. For instance, a Merlot from a hillside estate on Spring Mountain in Napa Valley will have high tannin and darker fruit flavours whereas a Merlot from a large valley vineyard in Lombardy, Italy will probably exhibit fewer tannins and soft red fruit aromas. Examples: Merlot, Sangiovese and Grenache.
7 iii) Light-Bodied Red Wines, delicately perfumed with very subtle flavours and light-bodied. Light red wines are known for having lighter tannin, bright acidity and slightly lower alcohol with red fruit flavours. Examples: Pinot Noir, Cinsault and Gamay.
iv) Rosé Wines, are the literal mid-point between white and red wine, however they tend to behave a lot more like a white wine. They are typically served chilled and many are dry. This style of wine is frequently produced in the Mediterranean around the south of France, islands in the Mediterranean, the Spanish eastern coast and in Italy. Examples: Garnacha Rosé, Provence Rosé and Côtes du Rhône Rosé.
v) Full-Bodied White Wines, these white wines typically undergo similar treatments as red wines in the winery to achieve the bold flavour, and thus have some flavour similarities. Typically, many rich whites undergo oak aging, to add that classic vanilla or coconut note, as well as a process called “Malolactic Fermentation”, which changes the type of acid in the wine to make wine taste creamier. Many full-bodied white wines will age up to 10 years, although most are in their prime at around 3-4 years. Examples: Oaked Chardonnay, Sémillon and Viogner.
vi) Light-Bodied White Wines, they are usually best enjoyed young, within a year or two of the vintage, to preserve the fresh fruity flavours and mouth-watering acidity. Examples: Albariño, Pinot Gris and Sauvignon Blanc.
vii) Aromatic White Wines, perfumed fruit and floral aromas. They are often (but not always) made in a style with some residual grape sugar. The sugar is there for balance, not just for the sweetness’s sake. Without retaining a little naturally-occurring grape sugar, many of these wines would be far too bitter or acidic for most drinkers. This style of wine is often referred to as, “harmoniously sweet”. Examples: Chenin Blanc, Gewustraminer and Riesling. viii) Dessert and Fortified Wines, in order to preserve the natural sweetness in fortified wines, the fermentation is stopped before the yeast uses up all the sugar. Typically when you do this, you’d be left with a lower alcohol wine but since fortified wines are allowed to add spirits the wines are usually around 17-20% ethanol. Examples: Port, Sherry and Madeira. ix) Champagne and Sparkling Wines, champagne bubbles come from the addition of a special mixture of sugar and yeast called the ‘liqueur de tirage’ to a dry, still base wine. The liqueur de tirage induces a second fermentation in the bottle; this makes the bubbles. Although, not all sparkling wines are made this way. Most notably Prosecco and Lambrusco are made by fermenting the wine in a tank under pressure and then bottling from there. Low-quality sparkling wines are often force-carbonated. Sparkling wines have bubbles
8 and high acidity and range from white, rosé to red in colour. Examples: Champagne, Prosecco and Cava.
Although differences may be found among the several wine styles the overall sensory profiles are very similar, suggesting that a certain wine style is systematically preferred by the competition tasters. According to Hopfer and Heymann (2014), there is an inclination of wine challenges to attribute the medals/awards to wines with no (or with very low concentrations) of vegetal, animal, chemical and/or earthy profiles. So, the standard of quality is set for wines with red berries, cherry, dominated by oak, with astringency and body. Consumer’s taste becomes shaped in that direction. This is the wine type that most of normal consumers will like, since they have an intense smell but are not so mouthy strong.
Descriptors as bitterness or animal, reduction profile or minerality will give us a wine that normal consumers will reject, often saying that the wine is spoiled. Usually only trained individuals and wine experts know how to taste and appreciate these wine characteristics. Also, accordingly to Robinson (2018), there are two different wine styles nowadays. One is full-throttle, concentrated and makes an impression because of its mass. It’s highly likely to have been made to resemble the sort of wine that was most admired in the 1990’s. Ripe fruit is what it most obviously expresses. This style of wine was probably aged in oak, very possible, new barriques, and may well be based on one of the well-known international grape varieties such as Cabernet or Chardonnay. The other style of wine comes across nowadays what we might call “twenty-first century wine”, a wine that’s less ripe, higher in acidity, lower in alcohol, lighter in colour and weight, made from grapes picked earlier and finish with a little texture, something akin to wet stones or graininess. These wine are more likely to be made from indigenous grape varieties. A subsection of these new wines are natural wines, wines with a minimum of additions such as sulphites, sugar, tanins and acids.
1.3.1 Warm vs Cool Climate Wine Styles
Wine regions are grouped into two major climate types: Warm Climate and Cool Climate. Warm climate regions tend to have more consistent temperatures throughout the season. The slow drop off from summer into fall gives grapes ample opportunity to become fully ripe but the negative is that more natural acidity in the grapes is lost. Generally, warm climates produce grapes with more ripe fruit flavors and less acidity (Puckette, 2012). Cool climate regions definitely get just as hot as warm climates in the peak of the season. However, it is the fact that the temperatures drop off so quickly towards harvest that make the wines taste different. Lower temperatures preserve the acidity but they also make it
9
Figure 1.1. Warm Climate vs Cool Climate Map (Puckette, 2012).
difficult for grapes to ripen. Generally, cool climate wine regions tend to produce tart fruit flavors and have more acidity (Puckette, 2012).
1.4 Consumer segmentation
The sensory properties of wines are a major element that will determine success with consumers. It has been only in recent times that the wine industry and research community have started to apply the principles of sensory evaluation to quantify consumer preferences (Francis, 2015). The term “segmentation” includes all the procedures that aim to divide people into groups by using specific categories, such as gender, age, frequency, knowledge and training. Special attention should be given when it comes to create consumer/taster segments, as through this procedure we receive information about taste sensitivity and preferences as well. In particular, attention to consumer segmentation is essential when trying to understand taste sensitivity and preferences.
1.4.1 Demographic, physiological, psychological and cultural features
The most common distinctions are based on different categories linked with demographic, physiological, psychological and taste sensitivities. The segmentation can be achieved usually by simple demographic questionnaires (e.g. with questions aiming to know the
10 gender, age, origin, educational and cultural background, familiarity) as well as by tests and measurements of the taste functions.
1.4.1.1 PROP status
The ability to taste the bitter thiourea compound phenylthiocarbamide (PTC) as well as 6-n-propylthiouracil (PROP) is an inherited characteristic shared by approximately 70% of the US adult Caucasian population, the so called PROP medium tasters and supertasters (Tepper et al., 2001). The remaining 30% of the population receive PROP as weak or tasteless and they are called nontasters (Tepper, 2001).
Thioureas contain the chemical moiety N-C=S, which is responsible for its bitter taste (Bartoshuk, 1994). It is shown through past studies that PROP tasters (medium tasters and supertasters) generally perceive greater intensity than the nontasters, from a wide variety of compounds, such as caffeine, quinine, benzyl alcohol and many others (Tepper et al., 2001). Prop tasters are also known to show greater sensitivity to oral irritation from capsaicin, cinnamaldehyde and benzyl alcohol (Prescott, 2000). The ability to taste this compound is more common in women than in men (Whissell-Buechy and Wills 1989); therefore, women are supertasters more frequently and have more fungiform papillae and more taste buds (Bartoshuk et al. 1994). Also, according to Whissell-Buechy (1990), this ability is present in young children, declining slowly with age.
The PROP sensitivity evaluation procedure includes a tasting with 3 glasses with 20 ml of water solutions displayed in increasing order of concentration of the compound (6-n-propylthiouracil), 0.032 mM, 0.32 mM and 3.2 mM. The procedure is simple, requesting from the taster to evaluate in terms of intensity perceived, the bitter sensation of each concentration in a 100 mm general Labeled Magnitude Scale (gLMS) and are following classified through the score given to the 0.32 mM solution (Non-taster ≤ 15.5 mm; 15.5 < Taster < 51 mm; Super-taster ≥ 51 mm) (Pickering, 2004).
1.4.1.2 Familiarity and Neophobia
Personality factors are often not investigated simultaneously with taste phenotypes. However, evidence suggests that personality factors might influence food liking and/or intake (Goldberg and Strycker 2002). One such factor, willingness to try new food and beverages, varies across individuals and is often conceptualised as food ‘adventurousness’ or ‘neophobia’.
11 In a general approach, there is a coexistence between a demand for modernity and naturalness regarding diet and food, including the need for novelty (neophilia) as well as caution, concerning new, unknown food (neophobia) (Coppola, 2014) as well as, in our case, particular styles of wine. It is known that there exists a population of individuals who are hesitant to try new wines, such as biodynamic wine, wines originating from other countries or even continents, wines with different, innovative and sometimes unfamiliar with the tasters ways of production.
It's understandable that cultural variables may play an important role in influencing responses to new styles or foreign wines. The educational background, age, gender and many other social-demographic factors could have an impact on how willing the people are to taste new wines (Higgins, 2015). This wine “neophobia” should be overcome through repeated development of knowledge, informing and promoting a global and friendly tasting environment.
Expert knowledge representation seems to be acquired through both exposure and intensive formal training, leading to the development of skills and conceptual knowledge in a specific field, associated with many years of experience (Honoré-Chedozeau, 2017). In this context, familiarity is defined as ‘the number of product-related experiences that have been accumulated by the consumer and expertise as ‘‘the ability to perform product-related tasks successfully. So, on the path to becoming an expert, familiarity seems to be a compulsory step in the learning process (Park et al., 1994).
Brand familiarity is a function of the number of indirect and direct product-related experiences with a particular brand, and is regarded as crucial to predicting consumer behaviour: with familiar brands thus possessing significant communication advantages since they can be recognized more easily than their lesser cousins (Delgado-Ballester et al., 2012).
By extension therefore, familiar brands receive benefits in terms of increased consumption and greater perception of quality (Labroo and Lee, 2006). So in wine purchasing behaviour, brand familiarity and price were found to be the most important factors determining consumer choice.
In blind tests, individual may rely only on the intrinsic properties inherent in the wine itself. This being so, through the consequent control of blind measures of quality, the influence of a particular brand cue on any subsequent sighted assessment may thus be flagged and computed, in conjunction with the potentially mediating effects of one’s declared familiarity, exposure and knowledge of the brand in question (Prillaid et al., 2017).
12 1.4.1.3 Expertise and training levels
One way of exploring knowledge representation is to compare expert and non-expert panels. Expert knowledge representation seems to be acquired through both exposure and intensive formal training, leading to the development of skills and conceptual knowledge related to a specific field (Honoré 2017). Prior work suggests wine knowledge and sensory ability may together constitute a measure of wine expertise (Frost and Noble 2002). In turn, it would be expected that wine expertise associates with overall liking of wine (presumably high liking is an important motivator in becoming a wine expert) and intake. Wine experts have been shown previously to possess better olfactory recognition than novices (Parr 2004). The high specialization of descriptive panels allows obtaining very detailed, robust and consistent, reproducible results, stable in time and within a certain sensory space (Moussaoui and Varela, 2010).
Thanks to a common descriptive language and their significant knowledge of wine characteristics, it has been demonstrated that wine experts can perform sensory description without previous common training because they share a common descriptive language (Maitre et al., 2010). Secondly, the generation of descriptors by the panel is classically solved by the use of a list of descriptors pre-defined by the panel leader. So, to have a trained and non-trained wine tasting panel, is as much as important as the saliva flow rate, PROP, sweet liking, in order to have a more complete and true taster segmentation.
1.4.2 Segmentation based on wine style preference 1.4.2.1 Factors affecting wine choice
From a sensory science point of view, increased attention has been given to the interaction of sensory and non-sensory factors in the last decade, since in a real purchase situation people rarely choose or consume an unidentified food product (Francis 2015). Packaging information, such as brand and price, can raise expectations, which can prompt product choice (Deliza and Macfie 1996). When the product is finally consumed, the expected sensory attributes will be confirmed or disconfirmed, either raising or lowering consumers’ expectations. Strong expectations can override sensory experience in some cases, especially for consumers who are less familiar with the product category. The price of the wine has been shown to change the way consumers experience it, not only increasing sensory acceptance, but actually making them happier, with the activity of a brain region involved in the experience of pleasure becoming stronger when the drinker thinks that the wine is more expensive (Plassmann, 2008). Deliza and Macfie (1996) emphasise the importance of sensory attributes for consumers, who will learn from previous experiences with the product and might change their purchase choice depending on the quality of the product on each purchase.
13 Consumer preferences regarding foods and brands are constantly changing, dictated by trends and the influence of the mass media. Consequently, companies have to adapt their products to these changing preferences if they wish to position themselves as market leaders. The wine market is similar in this respect, and wine consumers’ preferences also change according to trends or critical opinions (Perez-Magariño, 2010). However, wine consumers choices are more complex than that of many other products. This fact is due to the high number of attributes, both intrinsic (involving physicochemical composition, directly related to the product) and extrinsic (which can be altered without changing the product), that may influence the buying decision. Several factors and attributes that affect wine choice. The most important of which are the type of wine, price, quality certification, grape variety and commercial brand. This indicates that wineries have to be innovative and produce the wines that consumers demand, or introduce ‘new’ products in order to extend their range or capture new consumers (Perez-Magariño, 2010).
Application of sensory science to characterise the sensory properties of wines, with intensity of multiple sensory attributes generated by a trained panel, followed by consumer hedonic tests carried out under controlled, blind tasting conditions, means that the particular appearance, aroma and flavour attributes, and their strength, can be related to consumer preference or liking (Francis and Williamson, 2015). The first study published utilising this technique in wine research (Yegge and Noble, 2001) demonstrated the great wealth of information arising from combining trained panel sensory analytical data – quantitative intensity ratings of specific appearance, aroma and flavour attributes conducted in replicate, with consumer acceptance data obtained from a relatively large number of untrained consumers selected based on wine consumption and demographic information.
Regarding white wines, it has been found (Table 1.2) that there are substantial differences in liking responses amongst white wine consumers for different sensory attributes of wines. A common finding across several studies is the importance of acidity for many consumers together with bitterness for a smaller number of studies. Sweetness was also found to be a key attribute. The role of bitterness was indicated as generally a negative attribute for a sizable proportion of consumers in several studies. An oak/fruit continuum has also been found repeatedly, with moderate oak being generally a positive influence on liking, while high oak or no oak flavour can be polarising. Fruit intensity and type were also prominent attributes (Francis and Williamson, 2015).
For red wines, there were also common responses across multiple studies (Table 1.3) The importance of berry fruit and strong fruit flavour, as opposed to relatively high sourness or
14
Table 1.2. Sensory attributes of white wines found to be related to liking for cluster of wine consumers from preference mapping studies (Francis and Williamson, 2015)
bitterness, was evident for many consumer clusters. Sweetness was also a key factor and the presence of ‘Brett’-related flavour was a common negative driver of liking, as were sulfur-related flavour, oxidation-sulfur-related flavour, and ‘green’ or vegetal flavour. The presence of ‘green’ aroma/flavour, however, was not invariably a strong negative driver for all consumers, but those who appreciated wines with this flavour attribute were in the minority for most studies. The attribute ‘hotness’ or warmth was not usually an important feature influencing preference, indicating that alcohol level per se is not necessarily a key attribute driving consumer acceptance. Astringency is an interesting attribute, as it is sometimes indicated as a negative attribute for clusters of consumers, separate from bitterness. Finally, aged flavour, as indicated by lower fruit attribute ratings or by the attributes leather or earthy, was not generally a character that consumers appreciated (Francis and Williamson, 2015).
In summary, these studies in tables 1.2 and 1.3 highlight the proportion of consumers appreciating and responding to different key attributes of white and red wines.
15
Table 1.3. Sensory attributes of red wines found to be related to liking for clusters of wine consumers from preference mapping studies (Francis and Williamson, 2015)
1.4.2.2 Examples of segmentation based on wine style preference
The literature mentions several attempts to understand wine preference by consumers, some of which are described below.
Hanni’s segmentation
The vinotype test is an online wine personalization test (www.vinotype.com) which is principally based on the preferences of the individuals, launched in 2011 (Hanni, 2012). The developer of the vinotype test was Tim Hanni, an American Master of Wine, whose objective was to help consumers find out more about their own preferences. Hanni (2012) takes a phenotypic approach, which demonstrates that all organisms can be categorized into phenotypes, that in the case of individuals, the phenotype is the composite of the individual’s observed properties, characteristics and traits (Borchgrevink and Sherwin, 2017).
In sum, the phenotypic approach suggests that individuals develop (behavioral, food, entertainment) preferences over time based on their experiences and interaction with their broader environment (Borchgrevink and Sherwin, 2017). Adapting the phenotypic approach
16 to the world of wine and wine preference, Hanni (2012) proposes the use of vinotype, defined as “The set of observable characteristics of a wine-imbibing individual resulting from the interaction of its genotypic sensory sensitivities in a wine-related environment”.
The Vinotype assessment consists of various questions that determine the sensory sensitivities and tolerances combined with questions that determine certain elements the taster values about wine. The result is the taster Vinotype – the unique combination of sensitivities and values that comprise wine personal preferences. The possible four results are: Sweet, Hypersensitive, Sensitive and Tolerant.
Table 1.4. Categories of Vinotype personalization test (adapted from Hanni, 2013 and Borchgrevink and Sherwin, 2017)
Hughson´s segmentation
Accordingly to Hughson (2012) there are four different segments based on wine consumer preferences:
Segment 1 (‘Elaborates’). What stands out is that they like wines that generate a range of sensations. The sensations even include ‘fizzy’, which was a significantly negative element for participants as a whole. It is important to note that the expected liking rating for the
Vinotype Description
Sweet Greater preference to sweet foods and/or fragrant sweet wines with low alcohol
Preferred wines: Chardonnay, Moscato, Pinot Noir, Riesling, Sangria, Sparkilings
Higher number of tasting buds
More likely to be women (approximately 21%) and 7% men
Hypersensitive Greater preference to lower alcoholic content wines, delicate dry or off-dry, aromatic and smooth wines
Preferred wines: Blush/Rose, Chardonnay, Gamay, Pinot Grigio, Pinot Noir, Riesling, Sparklings
Intense sensory experiences
About 38% of women and 36% of men Sensitive Largest segment
Widest range of wine preferences, willing to try new flavors and styles Preferred wines: All styles
Tendency for delicate or full-bodied wines, dry whites and rich reds About 25% men and women
Tolerant Preference for more tannic, powerful, full-bodied reds, intensity and high flavor in whites
Preferred wines: Cab. Sauvignon, Malbec, Pinot Noir, Sauvignon Blanc, Syrah
Willing to try wines with higher alcohol
17 ‘Elaborates’ is relatively small suggesting that this segment have low general interest but are especially susceptible to product attributes.
Segment 2 (‘Classics’). These individuals are only interested in traditional wine styles. Any wine that is different from that detracts from overall acceptability. This is especially evident in the high negative utility values for the fizzy and sweet wines. This group made up the largest proportion of both the red and white-wine samples.
Segment 3 (‘Imaginers’), appear to enjoy the emotional and brand benefits such as the celebratory, traditional and natural elements of wine. Brand as well as some classical wine descriptions also add to acceptance. The expected liking rating is also quite small suggesting that while general interest is low, these subjects are also particularly susceptible to product features.
Segment 4 (‘No Frills’), appear interested in a simple wine that will not cause them any trouble and is easy to drink. This segment also finds especially complex descriptions, brand and premium quality detract heavily from the acceptability of a wine. In fact, the higher utility values for the negative over positive attributes show that any additional elements are more likely to detract from than increase product acceptability. This is also illustrated by the high additive constant. Notably, this segment only makes up 11 % of the red wine respondents.
Loureiro’s segmentation
In asimple but very systematic manner, Loureiro et al. (2016) considered only two consumer segments according to the preference for two wine styles, the first named as “Easy” wine likers and the second as “Difficult” wine likers. The table 1.5 summarizes the typical comments that an average consumer will give to an “easy” wine versus a “difficult” one when tasting without previous training.
As a consequence, when consumers and experts taste together in wine challenges, a higher score will most likely be assigned to wines with intense fruity‐oaky smells and full, smooth mouth‐feel (Loureiro et al., 2016).
For example, classic cool climate wines are typically defined as aggressive and fail to be recognized as of high quality standard by untrained consumers. Having this in mind, Loureiro et al., (2016) described a new tasting approach based on emotional reactions in order to facilitate the understanding of these difficult wines among consumers, and was improved by Coste et al., (2018) using wines that represent easy and difficult wines, both white and red.
18
Table 1.5. Typical comments from an average consumer in a wine tasting (adapted from Loureiro et al., 2016).
1.5 Background and Objectives
This work is a continuation and improvement of previous thesis related to wine tasting based on emotions accomplished by Brasil et al. (2016), Coste et al. (2018), Almeida (2017) and Manataki (2017).
An empirical emotional wine tasting sheet was created by Brasil et al. (2016), including emotional responses and sensory attributes. It was made with 14 attributes, both emotional and technical. This approach linked emotional descriptors with wine sensory characteristics. This empirical tasting sheet was subjected to improvement using a Focus Group approach where several changes were made and tested using a large consumer tasting (Coste et al., 2018), This author reached to the conclusion that it would also be particularly interesting to organize a tasting where participants would have to taste the wine and give a global evaluation. That would help to understand how the global evaluation could be biased by a single descriptor and possibly see which descriptors would be more influential (Coste et al.,
Parameters
Easy Wines Difficult Wines
White Red White Red
Visual Light yellow
color Deep red color Dark yellow Light red Intensity of the smell Intense, fantastic, appealing Discrete, smells badly, it stinks! Dominant smell Flowery, fruity, sweetish smells,
Happiness to recognize!
Difficult to describe, vegetal, earthy, “harsh”. Unhappy for not recognizing.
Evolution Stable Changes favorably
Expectations for the taste High expectations Low expectations Feelingsafter tasting Disappointing, it disappears! Surprisingly good, it is tasty! Dominant perception Sweet Acid, salty, bitter
Mouth-feel Smooth, hot, nice! Irritating, chilly, aggressive and harsh!
Overall preference High Low
Reassessment Smells and tastes the same Improved with time, it’s another wine! Final conclusions Simple, short and smooth.
Easy to understand.
Complex, persistent and vibrant. Requires learning and time.
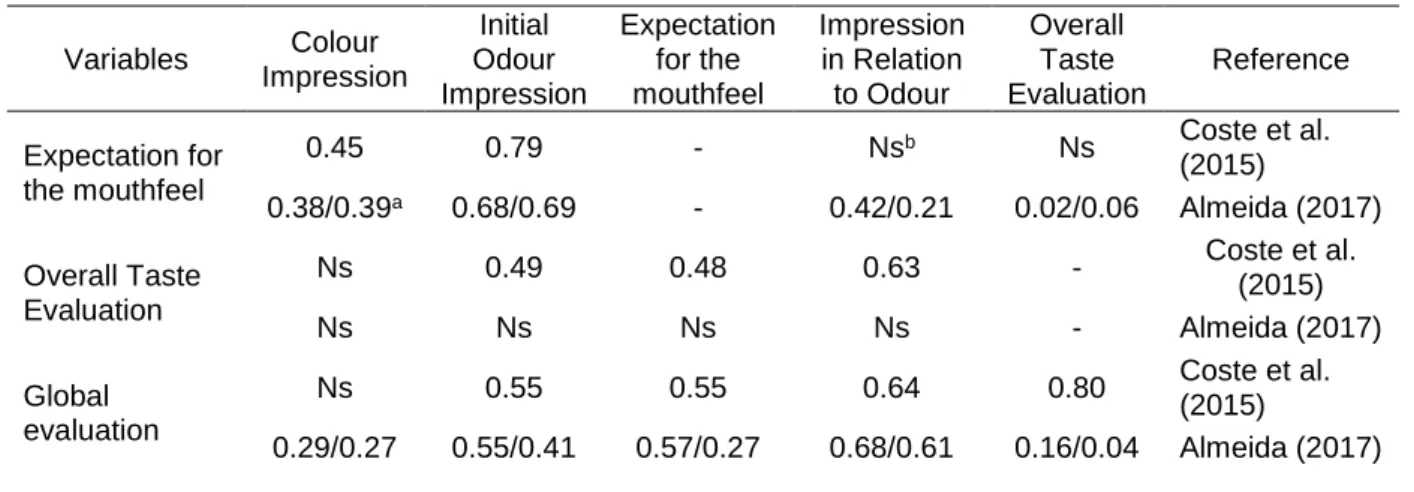
19 2018). This sheet was further tested with a different tasting panel by (Almeida, 2017). A comparison of the main correlations between the 14 descriptors of the tasting sheet showed that the emotional descriptors most relevant for wine discrimination were: Colour Impression, Initial Odour Impression, Expectation for the Mouthfeel, Impression in Relation to Odour and Global Evaluation (Table 1.6). Then, it would be interesting to check if these emotional responses could efficiently distinguish wines from different styles. Additionally, the proposed tasting approach depends on the use of wine standards to illustrate the descriptors under assessment. For instance, complexity and persistence were evaluated by comparison with blended wines with high and low scores for those attributes. It would be a challenge to check if consumers without any previous training and wine standards could provide responses that could be explained by wine characteristics.
In parallel, Manataki (2017) concluded that the majority of the respondents were not willing to try particular styles of wine, showing their doubts and distrust among new and innovative ways of producing wine, or even wines from different cultures. These observations are related with the “neophobia” concept which was evaluated under the notion of Familiarity.
Table 1.6. Main correlations between variables of the emotional tasting sheet. Variables Colour Impression Initial Odour Impression Expectation for the mouthfeel Impression in Relation to Odour Overall Taste Evaluation Reference Expectation for the mouthfeel 0.45 0.79 - Nsb Ns Coste et al. (2015) 0.38/0.39a 0.68/0.69 - 0.42/0.21 0.02/0.06 Almeida (2017) Overall Taste Evaluation Ns 0.49 0.48 0.63 - Coste et al. (2015) Ns Ns Ns Ns - Almeida (2017) Global evaluation Ns 0.55 0.55 0.64 0.80 Coste et al. (2015) 0.29/0.27 0.55/0.41 0.57/0.27 0.68/0.61 0.16/0.04 Almeida (2017)
a Results from the trained/untrained panel. b Ns, non significant.
Therefore, the present work had the following objectives:
- To evaluate a simplified tasting sheet using only emotional questions to rate wines with different styles;
- To determine the effect of taster characteristics on global wine evaluation; - To determine the influence of familiarity on the global wine evaluation; - To determine the preference for cool or warm climate wine styles.