Repositório ISCTE-IUL
Deposited in Repositório ISCTE-IUL:
2019-04-02
Deposited version:
Post-print
Peer-review status of attached file:
Peer-reviewed
Citation for published item:
Barradas, R. (2017). Financialisation and real investment in the European Union: beneficial or prejudicial effects?. Review of Political Economy. 29 (3), 376-413
Further information on publisher's website:
10.1080/09538259.2017.1348574
Publisher's copyright statement:
This is the peer reviewed version of the following article: Barradas, R. (2017). Financialisation and real investment in the European Union: beneficial or prejudicial effects?. Review of Political Economy. 29 (3), 376-413, which has been published in final form at
https://dx.doi.org/10.1080/09538259.2017.1348574. This article may be used for non-commercial purposes in accordance with the Publisher's Terms and Conditions for self-archiving.
Use policy
Creative Commons CC BY 4.0
The full-text may be used and/or reproduced, and given to third parties in any format or medium, without prior permission or charge, for personal research or study, educational, or not-for-profit purposes provided that:
• a full bibliographic reference is made to the original source • a link is made to the metadata record in the Repository • the full-text is not changed in any way
The full-text must not be sold in any format or medium without the formal permission of the copyright holders. Serviços de Informação e Documentação, Instituto Universitário de Lisboa (ISCTE-IUL)
Av. das Forças Armadas, Edifício II, 1649-026 Lisboa Portugal Phone: +(351) 217 903 024 | e-mail: [email protected]
FINANCIALISATION AND REAL INVESTMENT IN EUROPEAN UNION:
BENEFICIAL OR PREJUDICIAL EFFECTS?
Ricardo Barradas*, #
* Instituto Universitário de Lisboa (ISCTE-IUL), Dinâmia’CET-IUL, Lisboa, Portugal.
# ESCS - Escola Superior de Comunicação Social and ISCAL - Instituto Superior de
Contabilidade e Administração de Lisboa, Instituto Politécnico de Lisboa, Lisboa,
Portugal. ESCS-IPL, Campus de Benfica do IPL, 1549-014 Lisboa, Portugal.
[email protected] / [email protected]
Acknowledgments: The author is grateful for the helpful comments and suggestions of
four anonymous referees, Daniele Tori, Luís Martins, Marta Silva, Paulo Marques,
Ricardo Correia, Sérgio Lagoa, Sofia Vale, the participants in Research Seminar in
Economics (Instituto Universitário de Lisboa (ISCTE-IUL), November 2015), the
participants in Dinâmia’CET-IUL Workshop on Dinâmicas Socioeconómicas e
Territoriais Contemporâneas (Instituto Universitário de Lisboa (ISCTE-IUL), June
2016) and the participants in 7
thAnnual Conference in Political Economy (Lisbon
School of Economics & Management – Universidade de Lisboa, September 2016). The
usual disclaimer applies.
1
FINANCIALISATION AND REAL INVESTMENT IN EUROPEAN UNION:
BENEFICIAL OR PREJUDICIAL EFFECTS?
ABSTRACT
This paper makes an empirical assessment of the relationship between financialisation and real investment by non-financial corporations using panel data composed of 27 European Union countries over 19 years (from 1995 to 2013). On the one hand, financialisation leads to a rise in financial investments, diverting funds from real investments (‘crowding out’ effect); on the other, pressures from shareholders to intensify financial payments restrict the funds available for new real investments. We estimate an aggregate investment equation with the traditional variables (lagged investment, profitability, debt, cost of capital, corporate savings and output growth) and two further measures of financialisation (financial receipts and financial payments). Findings show that financialisation has damaged real investment in European Union countries, mainly through the channel of financial payments, either by interest or dividends payments. It is also found that the prejudicial effects of financialisation on investment are worse in the pre-crisis period. In addition, it is concluded that financialisation contributed to a slowdown of real investment by around one per cent and eight per cent in the full and pre-crisis period, respectively. During the pre-crisis period, financialisation was the main driver for the slowdown of investment in European Union.
KEYWORDS
Financialisation, Investment, European Union, Panel Data, Least Squares Dummy Variable Bias Corrected Estimator
JEL CLASSIFICATION
2
1. INTRODUCTION
Conventional economic theory finds that the growth of finance fosters economic growth due to the positive association between savings and investments (e.g. Levine, 2005). Nevertheless, scholars of financialisation (Orhangazi, 2008a and 2008b; Hein and van Treeck, 2010; Hein, 2012; Hein and Dodig, 2015; among others) postulate that the increasing growth of finance harms the real investment of non-financial corporations (NFCs) through two channels. The first channel involves the NFCs’ greater engagement in financial activities, which tends to divert funds from real investments (‘crowding out’ effect). The second is caused by the strong pressures on NFCs to increase their financial payments (interest, dividends and/or stock buybacks) to the financial markets and respective shareholders, which leads to lower retention ratios and fewer funds for long-term productive projects.
In light of this, some empirical studies have been conducted in recent years to assess the relationship between financialisation and real investment. Most of these derive and estimate investment equations that find statistical evidence of the prejudicial effects of the phenomenon on real investment (e.g. Stockhammer, 2004; Orhangazi, 2008a and 2008b; van Treeck, 2008; Onaran et al., 2011; Tori and Onaran, 2015; and Barradas and Lagoa, 2017).
This paper examines the impact of financialisation on the real investment of NFCs in European Union (EU) countries between 1995 and 2013 inclusive, contributing to the literature in two new ways. Firstly, it focuses on EU countries, whereas most studies are oriented to the specificities of large, highly developed and financialised countries like the USA or the UK. Secondly, a panel data econometric analysis is used rather than the time series econometric analysis more usual in empirical studies on this matter. This allows us to understand whether the prejudicial effects of financialisation have been generalised and are transversal to a large set of countries or, alternatively, are specific to certain countries. The use of a panel data econometric analysis also permits a higher number of observations, sample variability and less collinearity, and thus improves the accuracy and reliability of estimates.
EU countries represent an interesting case study as they share common economic rules because they belong to the same economic and political region. However, these countries have some diversity in terms of financialisation, probably due to their different types of financial system (‘market based’ or ‘bank-based’, in the typology of Sawyer, 2013), distinct growth models in the era of financialisation (‘debt-led consumption boom’, ‘domestic demand-led’ and ‘export-led mercantilist’, in the classification of Hein, 2012) and diverse models/varieties of capitalism (‘liberal market economies’, ‘coordinated market economies’, ‘hybrid/mixed market economies’ and ‘transition economies’, in the spirit of Hall and Soskice, 2001; and other related works in the field of comparative political economy). These dissimilarities could explain the differences in the countries’ levels of financialisation (Figure A7 and Figure A8 in Appendix).
3
Despite this heterogeneity, there has been a downward trend in the investment rate in most of these countries (Figure A1 in Appendix), concurrent with a rise in financial receipts and financial payments (Figure A7 and Figure A8 in Appendix). It is therefore interesting to determine whether there is a disruptive relationship between financialisation and real investment and to what extent the increase of both financial receipts and financial payments have contributed to the slowdown of real investment.
Accordingly, we estimate an investment equation using standard variables (lagged investment, profitability, debt, cost of capital, corporate savings and output growth) and two additional variables linked to financialisation (financial receipts and financial payments). We estimate an aggregate investment function given our interest in studying a macroeconomic issue.
It is concluded that financialisation exerts a negative influence on the real investment of EU countries, mainly through the second channel and especially in the pre-crisis period. This confirms our suspicion that the disruptive relationship between financialisation and real investment is a generalised phenomenon with a negative effect on EU countries from a macroeconomic point of view. It is also found that these negative effects of financialisation on real investment are worse in the pre-crisis period. During the pre-crisis period, financialisation was the main driver for the slowdown of investment in EU.
The remainder of the paper is organised as follows. In Section 2, we give an overview of the theoretical and empirical literature on the relationship between financialisation and real investment of NFCs. An investment equation is built in Section 3. The data and the econometric methodology are described in Section 4. Section 5 presents the main findings and the respective discussion. Finally, Section 6 concludes.
2. THE RELATIONSHIP BETWEEN FINANCIALISATION AND REAL
INVESTMENT
It is generally accepted that higher rates of physical capital accumulation are crucial to sustain more dynamic economic growth and employment creation (Orhangazi, 2008a and 2008b). Conventional economic theory advocates that the growth of finance is generally a positive phenomenon that supports the real investments of NFCs given the linkage between savings and investments. This idea has been reinforced by some empirical studies, which find a positive relationship between the growth of finance and economic growth (Levine, 2005; Ang, 2008; Arestis et al., 2015).
4
Nonetheless, the strong growth of finance in the last three decades has cast doubts on the ‘finance-growth nexus’. Empirical studies confirm a decrease or even a reversal in the relationship between financial development and economic growth (Kose et al., 2006; Prasad et
al., 2007; Rousseau and Wachtel, 2011; Cecchetti and Kharroubi, 2012; Barajas et al., 2013;
Dabla-Norris and Srivisal, 2013; and Beck et al., 2014). These authors recognise that the size of the financial sector has an inverted U-shaped effect on economic growth. This means that, from a certain threshold, a further enlargement of the financial sector can reduce real economic growth.
Against this backdrop and according to the literature on financialisation, framed in the post-Keynesian tradition, the growth of finance can be prejudicial to the real investments of NFCs through two distinct channels, as is theoretically discussed by Orhangazi (2008a and 2008b), Hein and van Treeck (2010), Hein (2012), Hein and Dodig (2015), among others. Figure 1 exhibits the channels (and factors that contribute to feed each of them) associated with the effects of financialisation on real investment.1
[Figure 1 around here]
The first channel involves NFCs’ increasing investment in financial activities and financial assets, which takes funds from real and productive activities. This is labelled by Hein (2012) and Hein and Dodig (2015) as the ‘management’s preference channel’. As both external and internal funds are limited, NFCs can only use these funds to invest in financial or real activities, since financial investments and real investments are considered perfect substitutes (Tobin, 1965). Thus, NFCs have fewer funds for real and productive investments when they increase their financial investments, and this is commonly referred to as the ‘crowding out’ effect on real investment.
Krippner (2005) confirms that NFCs in the USA have increased their involvement in financial investments, as revealed by the growing importance of financial revenues and profits vis-à-vis the revenues and profits from real investments. Similarly, Cingolani (2013) argues that this behaviour expresses a higher accumulation of financial assets to the detriment of productive accumulation. In that sense, Botta et al. (2015) build a new monetary circuit taking into account the real financial macroeconomic interactions in the financialised era, namely incorporating the increasing acquisition of financial assets by NFCs. The literature on financialisation offers several explanations to describe this stance by NFCs.
1 This argument is not supported by several authors within the Marxian literature (e.g. Lapavitsas, 2009;
and Kliman and Williams, 2014). They stress that there is a reversed causality, in a context where financialisation should be interpreted as the consequence and not the cause of the slowdown of real investment of NFCs. Kliman and Williams (2014), for instance, show that the decline of the capital accumulation in US corporations is essentially explained by the fall in profitability rather than a diversion of profits from productive investments to financial investments and/or financial payments.
5
Firstly, Crotty (2005) advocates that the rise in financial investments (normally in the form of buying financial subsidiaries or expanding an already existing one) has been determined by NFCs’ shorter planning horizons which are incompatible with the pursuit of long-term real projects. This short-termism mirrors a tendency among investors to sacrifice long-term investment projects in order to increase short-term profits (Aspara et al., 2014). According to Samuel (2000), this focus on short-term profits instead of long-term expansion reflects a certain ‘managerial myopia’.
Secondly, Crotty (1990) concludes that shareholders are more concerned about current profitability than long-term expansion or, ultimately, the corporations’ actual survival. Orhangazi (2008a and 2008b) stresses the strong pressures (essentially exerted by shareholders) on managers to achieve higher short-term returns. These pressures encourage financial investments, which tend to produce larger and more speculative short-term profits rather than real investments that normally involve more uncertainty and only produce profits in the medium and long-term. This is the so-called ‘rent-seeking behaviour’ of NFCs. In fact, Hein (2012) and Hein and Dodig (2015) stress that NFCs face a ‘growth-profit trade-off’ because shareholders’ orientations are mainly for short-term profitability. Once again, this discourages the implementation of real capital projects. Baud and Durand (2012) also state that NFCs intensify their financial investments during bull markets which produce higher levels of profit and respond to the pressures of shareholders. Levy-Orlik (2012) notes that NFCs sometimes repurchase their own shares in order to prevent hostile takeovers, which also leads to a rise in share prices and increases short-term profits. Tomaskovic-Devey et al. (2015) even stress that managers’ performance is no longer evaluated in terms of market share but rather according to their ability to generate short-term profits and increased share prices.
Thirdly, Crotty (2005) and Orhangazi (2008a and 2008b) argue that NFCs may be engaging more in financial activities in reaction to the downward trend of profits from the real sector and the increase in external funding costs since the 1980s. Baud and Durand (2012) confirm that US retailers’ involvement in financial activities is the result of the decline in profitable opportunities in real investments, motivated by the maturation of markets, low profitability rates, stricter regulations, sluggish consumer demand and increasing competition. Soener (2015) notes that this is the political economy perspective in which NFCs are becoming more financialised so as to remain viable. Crotty (2005) terms this the ‘neoliberal paradox’; he claims that shareholders tend to coerce NFCs to remain competitive and profitable even in downturn environments, thus inducing managers to move from productive to financial investments. According to Lin and Tomaskovic-Devey (2013), this behaviour reflects the NFCs strategy of ‘fast growth in a slow-growth economy’.
Fourthly, Akkemik and Özen (2014) advocate that macroeconomic uncertainty and increased risks, together with institutional changes in corporate governance, are the main
6
reasons behind the rise in financial investments by NFCs. They tested these hypotheses using a panel data econometric analysis for 41 corporations quoted in the Istanbul Stock Exchange for the period between 1990 and 2002. However, they found this channel to be mainly determined by highly uncertain macroeconomic environments and by the characteristics of corporations (such as dimension), whilst institutional features (e.g. close ties with the government, family ownership, discretion of managerial power and unionisation) do not have a statistically significant impact on financialisation. In fact, Baud and Durand (2012) stress that there is a greater preference for liquid assets in business environments characterised by high levels of uncertainty, as the financial investments of NFCs represent a kind of ‘wait-and-see’ strategy. In turn, NFCs involve themselves in financial activities through financial instruments which hedge several risks against uncertainty (Soener, 2015).
Following a neo-institutionalism perspective, Soener (2015) adds two further explanations to describe the growing importance of NFCs’ financial investments. Firstly, he stresses that NFCs learn to financialise with other corporations – i.e. so-called ‘mimetic behaviour’. Secondly, he emphasises that some actors (like financial executives or independent consultants) influence investors and managers to make more financial investments. Here, there is an institutional transmission of knowledge and practice from the know-how of these actors in the corporate finance field to the respective investors and managers.
Nonetheless, some authors (Fazzari et al., 1988; Gertler and Gilchrist, 1994; Ndikumana, 1999; among others) emphasise that the increase in financial receipts due to investments in financial activities and financial assets could exert a positive influence on productive investments if (and when) NFCs channel these financial incomes to make real investments. Orhangazi (2008a and 2008b) recognises that this could be a more relevant mechanism in the case of small and medium-sized corporations since they face higher financial constraints and are therefore forced to use all incomes (even financial) to undertake real investments. The same argument is presented by Tori and Onaran (2015), who stress that the effect of financial receipts on investment depends on the NFCs’ dimension and/or sector. Accordingly, it exerts a negative influence in the case of large NFCs because they re-invest these financial incomes in other financial investments, but it has a positive influence in the case of small and medium-sized corporations because they are more likely to be financially constrained.
The second channel is associated with the strong pressures on NFCs to increase their financial payments (interest, dividends and/or stock buybacks) to the financial markets and the respective shareholders. This limits the funds available for real investments, which is commonly referred to as the ‘profit without investment’ hypothesis (Stockhammer, 2005; and Cordonnier and Van de Velde, 2014). According to Stockhammer (2005), this hypothesis represents a stylized fact in the neoliberal era after the mid-1980s, reflecting a trend of lower investment and
7
output growth along with higher profits due to the increasing shareholder power. As noted by Aglietta and Breton (2001) and Duménil and Lévy (2004), the higher levels of payout ratios reduce the funds available for real investments made by NFCs, which has had a negative effect on the execution of long-term investment projects including activities like innovation, research and development. Hein (2012) and Hein and Dodig (2015) term this the ‘internal means of finance channel’. Once again, the literature on financialisation presents several explanations for the low retention ratios of NFCs.
Firstly, Orhangazi (2008a and 2008b) focuses on the high levels of NFCs’ indebtedness, which lead to a rise in financial payments in the form of interest.
Secondly, and regarding the financial payments through dividends, the author notes that managers are encouraged to raise short-term payout ratios and it is in fact in their interest to do so as their remuneration is based on the short-term evolution of stock prices. Their strategy is therefore to distribute high dividends, because this tends to drive a short-term increase in stock prices. On the other hand, this is simply a response to pressures from shareholders who, in some cases, are institutional investors that seek constant appreciations in stock value and high payout ratios. If NFCs do not make these financial payments in the form of dividends, their stocks could decline sharply, as demand for them would fall and supply increase, which could ultimately lead to a takeover.
Thirdly, Lazonick and O’Sullivan (2000) and Stockhammer (2010) argue that this growing trend in financial payments by NFCs over the last three decades is associated with a new design of corporate governance that favours the maximisation of shareholder value: the so-called ‘shareholder value orientation’. Aglietta (2000) and van der Zwan (2014) note that this has become ‘the norm of the transformation of capitalism’ and is responsible for the dissemination of policies and practices that tend to favour shareholders over the other constituents of corporations. Lazonick and O’Sullivan (2000) suggest there has been a shift from ‘retain and reinvest’ to a ‘downsize and distribute’ strategy – that is to say, a transfer from a strategy oriented to towards profit retention and reinvestment in corporations’ growth to one of downsizing of corporate labour forces and the distribution of profits to shareholders. Levy-Orlik (2012) emphasises that investors’ decisions based exclusively on the aim of maximising shareholder value target the reduction of production costs and increase in stock prices to the detriment of employment, income equality, innovation and industrialisation.
Conversely, and as referred by Orhangazi (2008a and 2008b), some authors claim that the increase in financial payments could be positive for NFCs’ real investment on the grounds that higher levels of financial payments depend on higher profits and solvency. As such, these corporations will probably have access to more funding at lower costs, which could increase the implementation of new productive investments. However, this has not been confirmed empirically (e.g. Orhangazi, 2008a and 2008b; Van Treeck, 2008; Onaran et al., 2011; Tori and
8
Onaran, 2015; and Barradas and Lagoa, 2017), probably because those pressures to raise short-term financial payments are so strong and constant that NFCs cannot implement new real investments.
Despite the growing body of theoretical work on the effects of financialisation on real investment, there are few empirical studies on the subject, as emphasised by Onaran et al. (2011). Nevertheless, some empirical studies estimate investment functions for several countries in order to make an econometric analysis of financialisation’s impact on real investment; most of these find it to be harmful.2
Stockhammer (2004) estimates an investment equation for Germany, France, the UK and the USA, using a time series econometric analysis for each country individually. He uses interest and dividends received (the so-called rentier income) by NFCs to measure financialisation, and concludes that it has led to a deceleration in real investment, particularly in the USA and the UK. In the case of the UK, the negative effect is more modest, particularly because there has not been a decline in accumulation due to the low accumulation rates in the last decades. The insignificant effect in Germany is explained by the recent nature of the ‘shareholder value orientation’ phenomenon in this country. Orhangazi (2008a and 2008b) also identifies the deleterious effect of financialisation in the USA. He conducts a time series econometric analysis using aggregate data for NFCs as a whole from 1961 and 2004 and a panel data econometric analysis using micro-data from 1973 and 2003, analysing by sector (manufacturing versus non-manufacturing corporations), industry (durable versus non-durable producers) and dimension (small versus large corporations). In both studies, he applies financial profits (interest and dividends) and financial payments (interest, dividends and stock buybacks) to measure the two channels of financialisation. He finds a negative relationship between these two channels and investment in both studies. Van Treeck (2008) also performs a time series econometric analysis for the USA for the period between 1965 and 2004. He concludes that interest and dividend payments exert a negative influence on long-term non-financial investment in the USA. Onaran et al. (2011) estimate an investment function using a time series econometric analysis for the USA from 1960 to 2007. They found evidence supporting the claims that financialisation (proxied by interest and dividends payments) has suppressed the level of investment. Tori and Onaran (2015) analyse the effect of financialisation on physical investment in the UK, using micro-data at the corporation level from 1985 to 2013. They find evidence supporting the claims that financialisation exerts a negative influence on physical investment through financial receipts and financial payments. Barradas and Lagoa (2017) also perform a time series econometric analysis focused on Portugal from 1977 and 2013, using a
2 As demonstrated by Onaran et al. (2011), there are also some theoretical and empirical studies on the
effects of financialisation on the other components of the aggregate demand. Here, we focus only on investment.
9
vector error correction model and financial receipts and financial profits of NFCs as proxies to capture financialisation. They conclude that financialisation has hurt real investment, mainly through financial payments and particularly in the long-term.
The literature has focused mainly on large and highly developed countries through time series econometric analyses. Here, we aim to make an empirical assessment of the relationship between financialisation and real investment of NFCs using a large set of countries, EU countries. To the best of our knowledge, this is the first paper conducting a panel data econometric analysis for a group of countries over time about financialisation and real investment. This approach will allow us to perceive if the prejudicial effects of financialisation have been generalised and are transversal to this large set of countries or if they only affected specific countries from a macroeconomic view point.3
3. FINANCIALISATION AND REAL INVESTMENT:
AN ECONOMIC MODELISATION
Empirical studies of real investment are particularly difficult when they are carried out through econometric estimations of investment functions (Eisner, 1974). Effectively, ‘[…]
estimation of investment functions is a tricky and difficult business and the best posture for any of us in that game is one of humility’ (Eisner, 1974, p. 101). In the same vein, Davidson (2000)
emphasises that investment equations do not follow a stable functional expression over time, since investment decisions are constantly affected by exogenous ‘animal spirits’ of investors.
Nevertheless, there are several theoretical and empirical studies of real investment in the literature that reveal the main determinants of investment decisions. Chirinko (1993) and Kopcke and Braunman (2001) surveyed the traditional literature on this issue, identifying essentially five determinants of investment: the level of profitability, the degree of indebtedness, the cost of capital (or interest rates), cash-flow (or internal funds) and output (or sales).
In what follows, we estimate an equation where investment is a function of the prevalent variables in the explanation of investment decisions of investors in NFCs: lagged investment, profitability, level of debt, cost of capital, corporate savings and output growth. Additionally, we incorporate two further variables (financial receipts and financial payments) to account for the two channels related to financialisation’s prejudicial effects on productive investments, as described previously.
3 From an econometric view point, the panel data econometric analysis has several other advantages over
a simple time series econometric analysis, as pointed out by Baltagi (2005), Brooks (2008), among others. The majority of these advantages are directly related to the possibility of collecting a higher number of observations with more variability and less collinearity, which tends to improve the accuracy and the reliability of estimates.
10
Accordingly, our investment function takes the following form:
(1)
where i is the country, t is the time period (years),
LS
is the labour income share of country i at time t, P is the profitability of NFCs of country i at time t, D is the corporate debt of NFCs of country i at time t,CC
is the cost of capital of country i at time t,CS
is the corporate savings of NFCs of country i at time t,OG
is the output growth of country i at timet, FR are financial receipts of NFCs of country i at time t and FP are financial payments of NFCs of country i at time t.
The two-way error term component is given by:
(2)
where hi accounts for unobservable country-specific effects and lt accounts for time-specific effects. The term eit, is the random disturbance in the regression, varying across countries and years.
We use lagged values for the independent variables because of the time lag between investment decisions and the respective capital expenditures (the decision to invest in
t
was based with information att
-
1
), the role on the formation of investors’ expectations (adaptive expectations) and the need to avoid potential problems of simultaneity and reverse causation (i.e. endogeneity problems) (Orhangazi, 2008a and 2008b).4 On the one hand, profits (where financial receipts and financial payments are included) of a certain year are only available for investments in the following year; on the other, investors only know the lagged values of output growth when they make investment decisions.We also included the lag of the dependent variable, taking into account the persistence degree that is present in the majority of macroeconomic variables. The inclusion of lagged investment helps to control for dynamic effects, namely the gestation in time (investment projects usually take over one year to be implemented), irreversibility in investment decisions, and inertia (higher/lower investment normally leads to higher/lower subsequent investment) (Orhangazi, 2008a and 2008b). This is corroborated by Kopcke and Braunman (2001), who confirm that years of high/low investment tend to follow years of high/low investment. In fact, there is a ‘path dependency’ of real investment over time, as stated by Tori and Onaran (2015).
4 It should be noted that the use of lagged values for the independent variables does not solve by itself
the potential endogeneity (i.e. dual causality) between financialisation and real investment. However, this issue was taken into account in the choice of the respective methodology, as described in the next Section.
+
+
+
+
+
=
0 1 it,-1 2 it,-1 3 it,-1 4 it,-1 t, iI
P
D
CC
I
b
b
b
b
b
t, i t i t, i h l e µ = + + t, i 1 t, i 8 1 t, i 7 1 t, i 6 1 t, i 5CS
b
OG
b
FR
b
FP
µ
b
+
+
+
+
+
- - --11
Note also that Ford and Poret (1990) argue that the best determinant of current investment is its own past history.
All NFCs variables (investment, profitability, debt, corporate savings, financial receipts and financial payments) are expressed as ratios of the respective gross value added (both the numerator and denominator are in volume). This permits the comparison of variables expressed in different currencies, making exchange rates unnecessary for conversion to the same currency that could skew results due to the respective movements in international financial markets. This also allows the respective coefficients to be interpreted in percentage points (p.p.).
It should be noted that we propose to estimate an aggregate investment function, similar to Stockhammer (2004), Orhangazi (2008a), van Treeck (2008), Onaran et al. (2011) and Barradas and Lagoa (2017). Stockhammer (2004) emphasises that the respective results should be analysed with care as we are addressing a macroeconomic issue – i.e. the slowdown of real investment – although the theory of NFCs investment decisions is supported by microeconomic fundaments. This strategy implies the assumption of a representative corporation. In addition, we recognise some limitations to this approach, since the use of an aggregate investment function does not reflect different financialisation levels among NFCs or potential dissimilarities in the behaviour of NFCs from different countries, sectors, industries, dimensions and/or ownerships. Note also that as a panel data econometric analysis estimates an average effect of several countries, it does not account for the historical, social and economic circumstances responsible for real investment in each country. However, Orhangazi (2008a) states that this approach has several advantages, namely by allowing us to look beyond the particularities of different NFCs and to identify the main relationships that dominate real investment. Here, we follow a macroeconomic perspective to assess whether financialisation has been beneficial or prejudicial to real investment in the EU. Thus, if the two channels of financialisation are found to have a macroeconomic effect, we cannot determine whether it is due to the impact of some corporations/countries or is more generalised across all corporations/countries. If we do not find any macroeconomic effect, we cannot exclude that they affect a subset of corporations/countries, which, however, is not enough to create a macroeconomic effect in all countries.
Accordingly, lagged investment, profitability, corporate savings and output growth are expected to exert a positive influence on investment, while cost of capital and financial payments are expected to influence NFCs investment negatively. The level of debt and financial receipts could have a positive or a negative influence on investment. Thus, coefficients of these variables are expected to have the following signs:
12
Profitability is expected to exert a positive influence on real investment, mirroring the demand conditions that are crucial to determine the viability of investment projects. Following a Keynesian argument, profitability tends to have a positive effect on real investment by functioning as a source of internal funds (Stockhammer, 2004). Kopcke and Braunman (2001) note that expectations for future demand conditions and future profitability have the strongest influence on investment. Nonetheless, Kuh and Meyer (1955) and Minsky (1975) state that given the uncertainty about the future, it is the past demand conditions and past profitability rather than the expectations that are the major influencers of investment. This seems to prevent the anticipation of future demand conditions and future levels of profitably, in a context where these expectations are normally formed on the basis of past.
The debt level has an undetermined effect on investment (Orhangazi, 2008a and 2008b). A positive effect is expected when the debt level is perceived to be safe. Here, a rise in debt may have no effect or even a positive effect on investment by increasing the available funds. A negative effect occurs when the debt level is perceived to be unsafe, as it signals greater financial fragility and makes it more difficult to obtain further funding. In that situation, future profits may be insufficient to repay existing debt, increasing the probability of bankruptcy.
The cost of capital (normally measured by the level of real long-term interest rates) is expected to exert a negative effect on real investment, reflecting the funding costs or the respective opportunity costs.
In addition, real investment is expected to depend positively on the respective corporate savings, because a higher level of corporate savings tends to be associated with a higher level of retained profits, which is necessary to support real investments. The internal means of finance rests on the ‘principle of increasing risk’ (Kalecki, 1937). This means that corporations, in imperfectly competitive financial markets, need their own funding sources to attract external capital in terms of credit, bonds or equity issues for investment purposes. In addition, this also means that corporations also constrain the utilisation of external capital for investment purposes to minimise the risk of illiquidity and insolvency. On the other hand, the internal means of finance support real investment due to the ‘financial hierarchy’, according to which internal funding has a cost advantage over external funding (Fazzari et al., 1988).
On the other hand, real investment also depends positively on the output growth. This follows the Keynesian argument of the ‘accelerator principle’, that most investors exhibit a higher propensity to invest in periods of economic growth than during downturns, since these periods are commonly associated with a higher demand. The ‘accelerator principle’ postulates that an acceleration/deceleration of the GDP will accelerate/decelerate real investment, given a multiplier higher than zero. Lopes (2003) confirms that real investment in the EU and the USA is strongly procyclical in relation to the respective business cycle. Indeed, Sørensen and Whitta-Jacobsen (2005) highlight the existence of two stylised facts of business cycles in relation to
13
investment: investment is strongly positively correlated with the business cycle and it is the most volatile component of aggregate demand.
Finally, and as discussed in the previous Section, financial receipts have an undetermined effect on real investment, given the dual role as a source of funding in the function of the NFCs’ dimension. Financial payments tend to lower real investment because they reduce the funds available for these real investments.
4. DATA AND METHODOLOGY: THE ECONOMETRIC FRAMEWORK
4.1. DATA
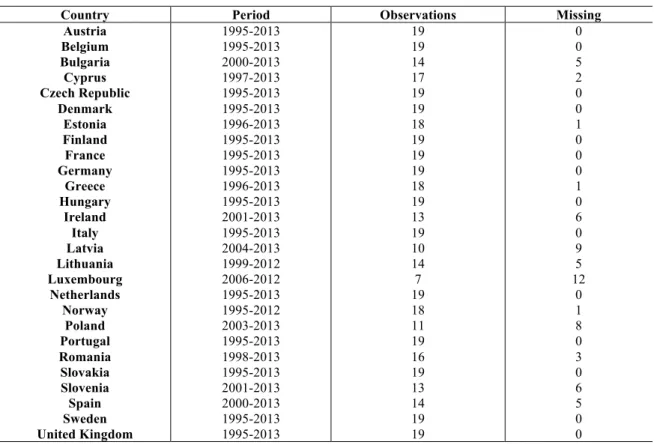
In order to analyse the role of financialisation in real investment of EU countries, we collect annual data from 1995 to 2013 for a set of 27 countries (Austria, Belgium, Bulgaria, Cyprus, Czech Republic, Denmark, Estonia, Finland, France, Germany, Greece, Hungary, Ireland, Italy, Latvia, Lithuania, Luxembourg, Netherlands, Norway, Poland, Portugal, Romania, Slovakia, Slovenia, Spain, Sweden and the United Kingdom). Malta was the only EU country excluded, due to the lack of data. Table 1 shows the sample period and the number of observations and missing per country.
[Table 1 around here]
This is the period and the frequency for which all data are available and they are suitable for the study for two reasons. Firstly, financialisation became more preponderant in the 1990s (van der Zwan, 2014); secondly, the investment by corporations is a long-term decision (it usually takes over a year to implement investment projects and recover the invested capital), and therefore annual data are likely to capture the determinants of real investment better than higher frequency data.
Thus, we constructed a panel of data (or longitudinal data), since we collected data for a set of 27 cross-sectional units (
N
=
27
) that were observed over time between 1995 and 2013 (T
=
19
). Nonetheless, we obtained unbalanced panel data because it was impossible to collect data for all years for each country. We have 64 missing values and our sample is therefore composed of a total of 449 observations.Table A1 in Appendix contains the descriptive statistics of the data and Table 2 presents the corresponding correlation matrix between all variables. The most important finding is that the absolute values of all correlations are lower than 0.8, which is crucial to exclude the existence of severe multicollinearity between the variables of our model (Studenmund, 2005).
14
In addition, profitability, corporate savings and output growth are the only variables positively correlated with investment; indeed they are precisely the three variables expected to have a positive effect on investment. The variables of debt, cost of capital, financial receipts and financial payments are negatively correlated with investment, which could signal a negative effect on investment. This also seems to confirm our suspicion that financialisation has hampered real investment through the two aforementioned channels.
[Table 2 around here]
Regarding the definition of the data, we used the gross fixed capital formation of NFCs divided by the respective gross value added to describe the NFCs’ investment. The ratio between these two variables is usually known as the NFCs’ investment rate.
We used the NFCs’ gross operating surplus5 divided by the respective gross value added as a proxy of profitability; the ratio between these two variables is commonly referred to as the profit share of NFCs.
In order to measure the corporate savings, we used the gross savings of NFCs divided by the respective gross value added.
Financial receipts correspond to the sum of interest and the distributed income of corporations6 (where dividends are included) received by NFCs. We divided them by the gross value added of NFCs.
We used the sum of interest and the distributed income of corporations (where dividends are included) paid by NFCs as a proxy of financial payments. We also divided them by the gross value added of NFCs.
Note that the variables of gross fixed capital formation, gross value added, gross operating surplus, gross savings, financial receipts and financial payments of NFCs were collected from the European sector accounts (at current prices and in millions of national currency), available at Eurostat. When not available on Eurostat, observations of these variables
5 According to Eurostat, ‘gross operating surplus can be defined in the context of national accounts as a
balancing item in the generation of income account representing the excess amount of money generated by incorporated enterprises' operating activities after paying labour input costs. In other words, it is the capital available to financial and non-financial corporations which allows them to repay their creditors, to pay taxes and eventually to finance all or part of their investment’.
6 The distributed income of corporations includes dividends and withdrawals from the income of
quasi-corporations (amounts that entrepreneurs withdraw for their own use from the profits earned by the quasi-corporations that belong to them).
15
were completed with data from the sector accounts of the national statistic offices of each country.7
The proxy of the debt level used here was the total financial liabilities of NFCs divided by the respective gross value added. The total financial liabilities of NFCs were collected from the European financial accounts (at current prices and in millions of national currency), available at Eurostat. When not available on Eurostat, observations of these variables were completed with data from the financial accounts of the central banks of each country.8
We used the long-term real interest rates (deflated by the GDP deflator) from the AMECO database to measure the cost of capital of NFCs. For some countries, we also used the short-term real interest rates (deflated by the GDP deflator) for several years (Bulgaria for 2000 and 2001; Czech Republic from 1995 to 2000; Estonia for 1996, 1997, 2011, 2012 and 2013; Hungary from 1995 to 1998; Lithuania for 1999 and 2000; Norway for 2011 and 2012; Romania from 1998 to 2005; Slovakia from 1995 to 1999; and Slovenia for 2001), because in the case of these countries, long-term real interest rates are not available for all years.9 We chose this strategy instead of using only the short-term real interest rates for all countries because investment is a long-term decision and is therefore more dependent on long-term interest rates. Thus, this variable contains 414 observations with long-term real interest rates, which contrasts with only 35 observations with short-term real interest rates.
Finally, we applied the usual variable of gross domestic product to describe the evolution of output growth. This was collected from European national accounts, available at Eurostat (at current prices and in millions of national currency), and was deflated using the GDP deflator (2005=100), available on the AMECO database. After that, we calculated the respective annual growth rate.
4.2. METHODOLOGY
As we have a dynamic panel data model, due to the presence of a lagged dependent variable among the independent variables, we cannot use the traditional panel data estimators (e.g. pooled ordinary least squares, least squares dummy variables, fixed-effects, random-effects) since they are biased and/or inconsistent because the lagged dependent variable is
7 Despite the use of different sources, we confirm that variables are fully comparable because they
present the same figures for the years where they are simultaneously available at Eurostat and in the national statistic offices of each country.
8 Despite the use of different sources, we confirm that variables are fully comparable because they
present the same figures for the years where they are simultaneously available at Eurostat and in the central banks of each country.
9 According to the AMECO database, the real interest rates are obtained by the difference between the
16
correlated with fixed effects in the error term (Nickel, 1981; Baltagi, 2005; Cameron and Trivedi, 2009; among others).
Accordingly, there are three main different approaches to deal with dynamic panel data. Firstly, we can take the first differences of our model, as proposed by Anderson and Hsiao (1982). This instrumental variables (IV) approach removes the constant term and the individual effects and produces consistent estimates. However, Holtz-Eakin et al. (1988), Ahn and Schmidt (1995) and Baltagi (2005) stress that this methodology does not produce necessarily efficient estimates because it does not use all available moment conditions. Secondly, we can perform a generalised method of moments (GMM) (Hansen, 1982), following the estimator proposed by Arrelano and Bond (1991). This estimator is also based on the first differences of our model (‘difference GMM’), albeit using a large set of instruments, and is therefore more efficient than the former. However, Roodman (2009) claims that this estimator has a weakness, namely magnifying gaps in the case of unbalanced panels, which is our case. Thirdly, we can implement the estimator proposed by Arrelano and Bover (1995) and Blundell and Bond (1998), which allows the introduction of more instruments (not only the lagged levels, but also lagged differences), thus improving its efficiency (‘system GMM’). This estimator subtracts the average of all future observations of a certain variable (‘forward orthogonal deviations’ or ‘orthogonal deviations’) instead of subtracting the previous observation from the contemporaneous one (‘first-difference transformation’ of Arrelano and Bond, 1991). Therefore, this estimator tends to minimise data loss in the case of unbalanced panels by using the aforementioned ‘orthogonal’ transformation (Roodman, 2009).
Nevertheless, these three estimators have proved to be severely biased and imprecise in macro panels where the cross-sectional dimension
N
is relatively small (Bruno, 2005a and 2005b), which is our case. Therefore, they are not appropriate to carry out our estimates. Against this backdrop, we will rely on the least squares dummy variables bias corrected (LSDVBC),10 introduced by Nickel (1981), Kiviet (1995) and Bun and Kiviet (2003), which was extended by Bruno (2005a and 2005b) for unbalanced panels. Note that Monte Carlo evidence has shown that this estimator outperforms the IV-GMM estimators in terms of bias and root mean squared error (efficiency) when we are in the presence of macro panels (Kiviet, 1995; Judson and Owen, 1999; and Bruno, 2005a and 2005b). Additionally, Monte Carlo evidence has also revealed the good performance of this estimator in terms of bias and efficiency even when we have endogenous variables among the independent variables (Behr, 2003), which could be our case with regard to the variables linked to financialisation.
17
Therefore, we will use the LSDVBC estimator for our investment function.11 This estimator works in two steps (Bruno, 2005a and 2005b). Firstly, it generates the consistent estimates, which requires the definition of an initial matrix of starting values that can be performed using three different consistent estimators (Anderson and Hsiao, 1982; Arrelano and Bond, 1991; and Blundell and Bond, 1998). However, the choice of one of these three estimators has only a marginal impact on the LSDVBC estimates (Bun and Kiviet, 2001; and Bruno, 2005a and 2005b). Secondly, it corrects the bias by undertaking a set of multiple replications to bootstrap the standard errors.
In the next Section, we analyse the estimations of our investment equation for EU countries and make some robustness analyses in order to assess whether the results exhibit some sensitivity to other specifications and/or sub-samples. In all of the specifications, we use the Arrelano and Bond estimator to initialise the LSDVBC estimator and a number of replications equal to 250. Time dummies are included in all specifications, as well as a WALD test to assess the joint significance of them all.
5. EMPIRICAL RESULTS AND DISCUSSION
This Section presents our estimates. We start by estimating our baseline investment function, as specified in Section 3 (Model I). Then, and to obtain a better understanding of the effects of financialisation on real investment in EU countries, we re-estimate the investment function, splitting financial receipts into interest and dividends receipts (
IR
andDR
, respectively) and dividing financial payments into interest and dividends payments (IP
andDP
, respectively) (Model II). We still re-estimate the investment function in order to assess the global net effect of financialisation, through the difference between financial payments and financial receipts – net financial payments (NFP
), on investment (Model III). Finally, we re-estimate the investment function taking into account the net effects of both channels, i.e. the difference between interest payments and interest receipts – net interest payments (NIP
) – and11 Note that we assume the stationarity of our data for the following three reasons. Firstly, plots of our
eight variables (Figure A1 to Figure A8 in the Appendix) already seem to indicate that all variables are stationary in levels. Secondly, our variables are in fact defined in ratios (in the case of investment, profitability, debt, corporate savings, financial receipts and financial payments) or in growth rates (in the case of output growth); intuitively, it is plausible to assume that these variables do not exhibit a unit root. Thirdly, the traditional panel unit root tests have low power and perform very poorly in the presence of panels where the cross-sectional dimension
N
is higher than the period dimensionT
, as recognised by Baltagi (2005), Hlouskova and Wagner (2006), Cameron and Trivedi (2009), among others. These authors also emphasise that for smallT
, there is the potential risk of concluding that the whole panel is non-stationary even when the panel has a large proportion of non-stationary data, since the conventional panel unit root tests tend to assume thatT
®
¥
. These are the reasons why we do not perform panel unit root tests.18
the difference between dividends payments and dividends receipts – net dividends payments (
NDP
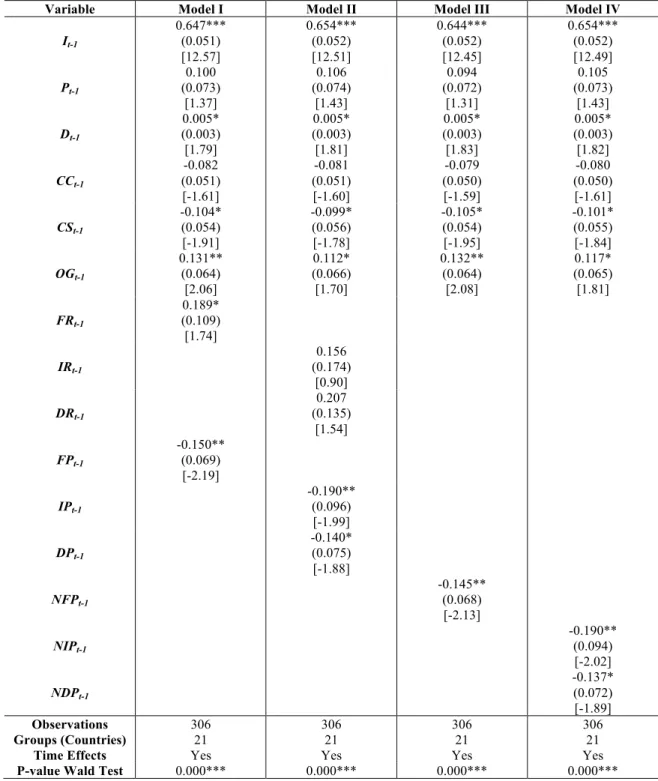
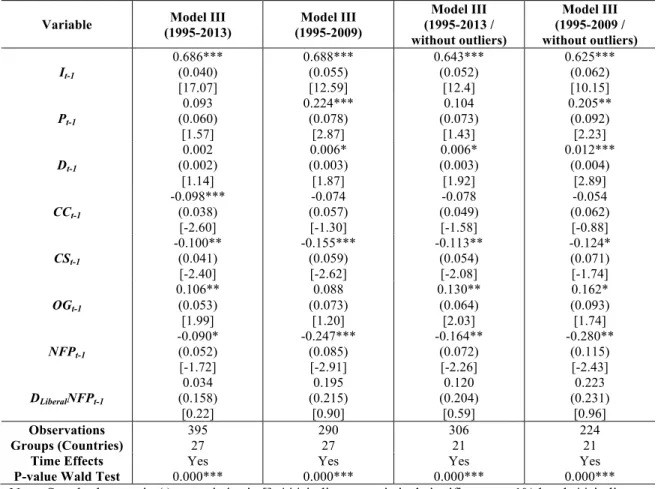
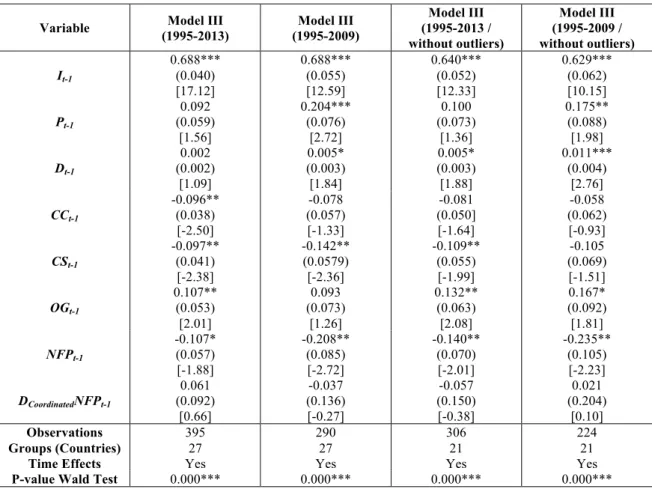
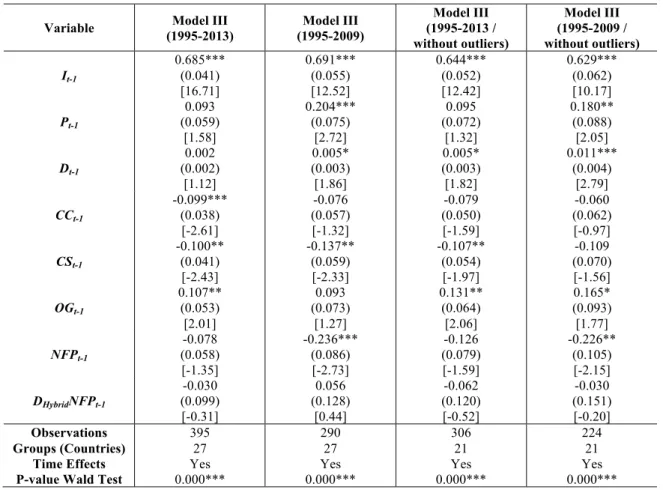
), on productive investment (Model IV). The respective results are presented in Table 3.[Table 3 around here]
In relation to Model I, all variables are statistically significant at the conventional significance levels, with the exceptions of profitability and debt. On the other hand, all coefficients of the statistically significant variables have the expected signs, with the exception of corporate savings. In fact, NFCs’ investment is negatively influenced by corporate savings, which may suggest that internal means of finance are used for other purposes (e.g. to constitute reserves or even to finance financial investments) rather than to implement new real projects. This could be explained by the strong reduction in external funding costs (visible in the fall of real interest rates) in the majority of EU countries since the mid-1990s (Figure A4 in Appendix), confirming that the cost advantage of internal funding over external funding was not so significant during that time. This result does not confirm the ‘principle of increasing risk’ (Kalecki, 1937). The non-significance of profitability and the negative impact of corporate savings on investment appear to be consistent with the ‘profit without investment’ hypothesis (Stockhammer, 2005). As expected, the lagged investment and output growth exert a positive influence and the cost of capital negatively influences real investment.12 These results are corroborated by the literature, namely by confirming that the lagged investment is a strong determinant of current investment (Ford and Poret, 1990) and that investment is strongly procyclical in relation to output growth (Lopes, 2003; and Whitta-Jacobsen, 2005). This is also in line with Keynesian predictions, according to which demand is a key determinant of investment. In the same vein, the ‘accelerator principle’ is confirmed, since coefficients of output growth are always higher than zero. Financial receipts exert a positive influence on real investment, which seems to exclude the ‘crowding out’ effect. This positive relationship reveals that financial investments have not been detrimental to real investments, probably because NFCs use financial returns to finance real investments. This is a relatively expected result, taking into account that the structure of the European productive system is characterised essentially by small and medium-sized corporations.13 These corporations face higher financing constraints in comparison with large corporations, being more dependent on financial receipts to make new real investments. This result has essentially been found in studies that use micro-data at the corporation level, where the effect of financial receipts on investment in the case of small
12 Note that results do not change dramatically (in terms of statistical significance and signs) if we had
excluded observations with short-term real interest rates. Results available upon request.
13 According to European Commission, small and medium-sized corporations are the backbone of the EU,
19
and medium-sized corporations is regularly positive (Orhangazi, 2008b; and Tori and Onaran, 2015). Finally, real investment is negatively influenced by financial payments in line with the literature on financialisation. This is a quite common result in similar studies on the relationship between financialisation and investment for other economies and/or periods (Stockhammer, 2004; Orhangazi, 2008a and 2008b; Van Treeck, 2008; Onaran et al., 2011; Tori and Onaran, 2015; and Barradas and Lagoa, 2017).
With regard to Model II, results do not change dramatically, with the exception of profitability that becomes statistically significant, exerting a positive effect on real investment. Financial receipts maintain their positive influence on real investment, but only dividends receipts are statistically significant. This suggests that not all financial investments are beneficial to real investments, in a context where returns from shares (dividends) seem to be more decisive in real investment than returns from deposits and/or from debt securities (interest). Both interest and dividends payments continue to exert a negative influence on real investment, but only the former is statistically significant. This seems to illustrate that the debt service have been more harmful for real investment than the paradigm of ‘shareholder value orientation’. In fact, the literature regards the majority of EU countries as latecomers in the development of ‘shareholder value orientation’, in a context where this paradigm is still a recent phenomenon among these countries (Barker, 2010). Despite a certain convergence with Anglo-Saxon countries since the mid-1990s, the author stresses that NFCs of EU countries follow a business strategy that is still broadly focused on the achievement of the interests of stakeholders rather than the pure maximisation of shareholder interests. A similar conclusion was already reported by Stockhammer (2004) to justify the insignificant effect of financialisation on real investment in Germany.
Regarding Model III, results are quite similar in comparison with the other two models. Here, profitability loses its statistical significance. Net financial payments are statistically significant and represent a negative determinant for real investment. This indicates that the beneficial role of financial receipts does not compensate for the prejudicial effect of financial payments, stressing that the global effect of financialisation in EU countries is harmful to real investment. Indeed, all countries exhibit a higher level of financial payments vis-à-vis financial receipts (Figure A7 and Figure A8 in Appendix).
From Model IV, we conclude that both net interest payments and net dividend payments are negative, but only the former are statistically significant. This finding illustrates that the global and harmful effect of financialisation on productive investment is caused essentially by interest payments due to the debt service rather than by dividends payments due to the recent emergence of shareholder-oriented NFCs in EU countries. Despite the non-significance of debt in the explanation of investment, the negative impact of net interest payments represents an indirect effect as the NFCs’ indebtedness can be prejudicial to real investments. Indeed, this
20
effect represents an important fragility of NFCs and a strong constraint to boost the real investment in EU countries, in a context where the high level of the NFCs’ indebtedness and the debt service increases the vulnerability of NFCs to interest rate shocks. Real investment is affected simultaneously by the price of debt (cost of capital) and by the volume of debt and the corresponding debt service (interest payments).
Now, we evaluate the robustness of our results. Firstly, we re-estimate the four specifications of the investment function, excluding the recent years of deep economic crisis. Note that output growth, financial receipts and financial payments exhibit a strong decline in 2008 in the majority of countries of the EU (Figure A6, Figure A7 and Figure A8 in Appendix). However, as we have a dynamic panel model explaining the current investment through the lagged values of the remaining variables, we only exclude the years after 2009.14 Results are exhibited in Table 4.
[Table 4 around here]
Overall, results do not change significantly. The most important changes are profitability and debt, which become statistically significant in all four models, both positively influencing real investment. The cost of capital loses its statistical significance, albeit maintaining a negative coefficient.15 Financial receipts and financial payments maintain their statistical significance and their positive and negative coefficients, respectively. However, interest receipts and dividends payments are now also statistically significant with a positive and negative coefficient, respectively. This suggests that all financial investments by NFCs were beneficial to the real investments in the pre-crisis period and that the debt service and the philosophy of ‘shareholder value orientation’ were both prejudicial. The global net effect of financialisation continues to exert a negative impact on real investment. However, the respective coefficients are more than double compared with the same coefficients in the full period, suggesting that the deleterious effects of financialisation were more pronounced in the pre-crisis period. Indeed, an interaction of a dummy variable for the years of crisis (2009-2013) with the global net effects of financialisation reveals that during these years these negative effects were smoother but not sufficient to cancel them in full.16 This is also reported by Tori and Onaran (2015), who reiterate that the negative effects of financialisation on investment were stronger in the pre-crisis period.
14 Note that results are quite similar if we exclude the years after 2008 instead of the years after 2009.
Results available upon request.
15 Once again, results do not change greatly if we had excluded observations with short-term real interest
rates. Results available upon request.
21
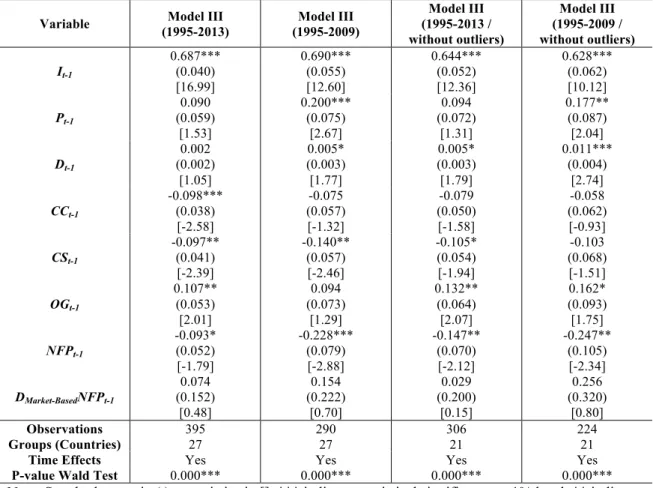
Secondly, we re-estimate the four specifications of the investment function excluding some countries that are outliers in order to avoid strongly biased estimates. We apply the traditional strategy in two steps in order to detect outliers (Chirinko et al., 1999; and Orhangazi, 2008b). We begin by calculating the average of each country in relation to all independent variables. Then, countries whose averages lie in the one per cent or the 99 per cent tail of distribution of these variables were excluded.17 Following this approach, Belgium, Denmark, France, Greece, Luxembourg and Sweden were declined. Results without these countries are presented in Table 5.
[Table 5 around here]
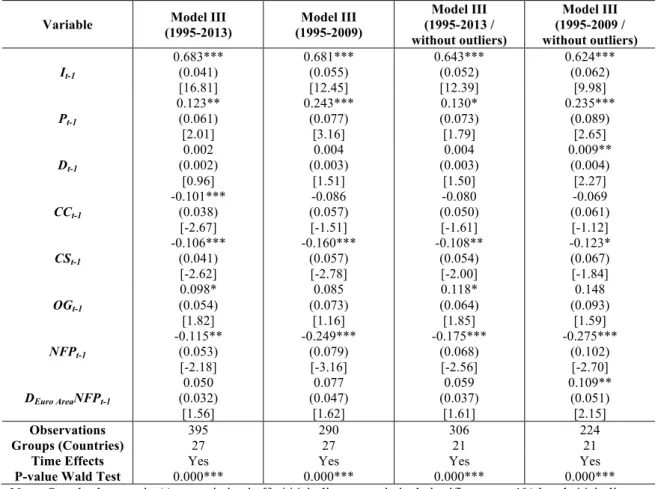
Once again, results do not suffer considerable alteration. Nevertheless, the cost of capital loses its statistical significance in all models albeit maintaining a negative coefficient, as opposed to the level of debt, which gains statistical significance in all models, exerting a marginal positive effect on investment.18 Financial receipts maintain a positive significant impact on investment, whilst financial payments maintain their negative significant impact. The global net effect of financialisation (through net interest payments and net dividends payments, respectively) continues to influence real investment negatively, albeit with a higher magnitude in comparison to results for all countries. This can reveal that the prejudicial effects of financialisation are worse in the remaining countries than in the outlier countries. This conclusion is supported by a dummy interaction for outlier countries with the global net effects of financialisation. This interaction proved to be positive and statistically significant, reinforcing that in these countries the negative effects are not so strong.19
These previous analyses seem to confirm that our results are relatively robust to the presence of both years of crisis and outlier countries, mainly with regard to the impact of financialisation on real investment. This conclusion is reinforced if we exclude simultaneously years of crisis and outlier countries, as demonstrated in Table 6.
[Table 6 around here]
17 As pointed out by Chirinko et al. (1999), Greene (2000) and Orhangazi (2008b), we do not take into
account outliers in relation to the dependent variable in order to avoid a censored regression bias. Anyhow, the average of all countries with regard to the dependent variable falls between one per cent and 99 per cent of the distribution, which suggests that there is not any outlier in relation to the dependent variable.
18 Note that results would be quite similar excluding observations with short-term real interest rates. Here,
the most important change is related with the variable of financial receipts that loses its statistical significance, albeit maintaining a positive coefficient. Results available upon request.