Manuscript ID: 562 DOI: 10.18462/iir.icr.2019.0562
Further development and experimental testing of a resistive
sensor for monitoring frost formation in refrigeration systems
Martim AGUIAR
(a, b), Pedro D. GASPAR
(a, b), Pedro D. SILVA
(a, b)(a) University of Beira Interior, Rua Marquês d’Ávila e Bolama, 6201-001, Covilhã, Portugal (b) C-MAST - Centre for Mechanical and Aerospace Science and Technologies, Covilhã, Portugal
ABSTRACT
Refrigeration systems are widely accepted as a mean to prevent food degradation. These systems usually rely on fin-and-tube heat exchangers to lower the air temperature. Due to long operation times and surface temperatures below dew point, frost may form and accumulate on the evaporators fin surface. This frost accumulation reduces and may clog the airflow, decreasing the system efficiency. Usually, most systems use a time-controlled system (stopping the compressor with or without powering a heating resistor inserted among fins to heat) to melt the ice. This method does not measure or predict the amount of frost formed, thus it is not reliable. Ice sensors that are cheap, reliable and easy to implement in commercial systems are studied. A resistive sensor is purposed, that measures the voltage between two electrodes with the water phase change (condensation and solidification -freezing-), as these states have different resistive values. Different electrode materials, morphologies and configurations are studied in order to obtain the best design.
Keywords: Refrigeration Systems, Frost, Monitoring, Testing.
1. INTRODUCTION
The issue of frost formation in air conditioning and refrigeration systems, more specifically on the fin-and-tube evaporators has been studied for several years, and yet it is the main cause of inefficiency (Popovac, et al., 2015), (Guo, et al., 2008).These fin-and-tube evaporators have a large area-to-volume ratio because they are used in light commercial systems. The demand for subfreezing operating temperatures causes the formation of a frost layer on the fin surface (Melo, et al., 2011), (Hermes, et al., 2009) as shown on Fig. 1.
Figure 1: Visualization of the fins surface before (a) and after (b) the frost formation process (adapted from (Melo et al., 2011)
A frost layer is a porous medium comprised of ice crystals and pores filled with moist air. The frost buildup on the evaporators fin surface increases its air-side thermal resistance, decreasing the overall efficiency of the system. The efficiency keeps decreasing if the frost is allowed to continue growing due to not only the increment of the heat transfer resistance, but also to the blockage of the air passage between the fins. Full blockage of the evaporator can occur if no defrost method is applied (Melo et al., 2017). Several parameters can influence frost growth, but those with most
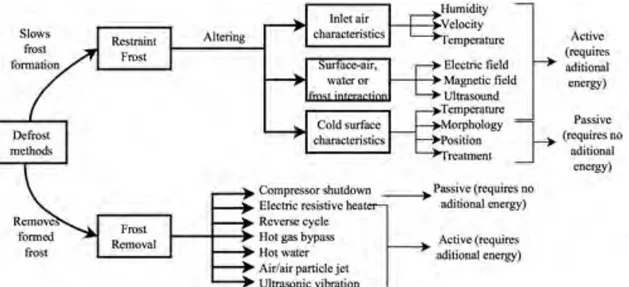
dew point and fin surface temperature) (Hermes et al., 2009), but may also be influenced by other parameters such as fin shape and spacing (Melo et al., 2011), type of flow (laminar or turbulent) (Yang et al., 2006), or air cleanliness (Wang et al., 2011). The lower system efficiency caused by the frost layer on fin surfaces result in a higher energy demand, and in extreme cases, system damage, besides threaten food safety. Defrost methods are used to reduce the problem, although additional energy is usually also consumed for them to operate (Wang et al., 2017). These defrost methods can be classified as seen in Fig. 2.
Figure 2: Classification of available defrost methods (Aguiar et al., 2018)
Time controlled with on-off defrosting and electric resistive heater or reverse cycle are the most used defrost methods. Apart from these, none of the abovementioned methods has gained significant acceptance from the refrigeration industry, due to complex, expensive and unreliable sensing and prediction methods (Xiao et al. 2010; Jiang, et al. 2013). This can cause a huge impact on energy consumption, as the timed defrost operations have to be timed for the worst-case scenario (warm and high air relative humidity) and thus, as these properties vary during the year, the amount of defrosting cycles could vary as well. Tassou et al. (2001) studied frost formation and defrost control parameters for vertical open refrigerated display cabinets (VORDC) and concluded that the ideal time between defrosts varies greatly with air temperature and humidity. As shown in Fig. 3, the ideal operation time between defrosts on VORDC can range from 4 hours to around 9.5 hours during different times of the year. A time-controlled defrosting must have in consideration the worst-case scenario on time between defrosting operations.
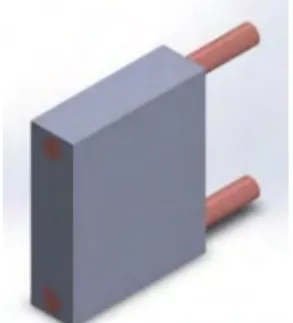
Demand defrost tries to solve this problem by predicting frost formation. This prediction can be done by computing the measured factors that influence frost formation (such as surface temperature, and inlet air characteristics: relative humidity, temperature and velocity) (Cui et al., 2011), computing the measurable system changes caused by the frost accumulation on the evaporator (temperature difference between the air and evaporator surface (Buick et al., 1978), pressure drop (Jarrett, 1972), degree of refrigerant superheat (Lawrence and Parker, 1998), fan power sensing (Muller, 1975) or both (Datta et al., 1997), using methods such as artificial intelligence (Kalogirou, 2000) and other algorithms (Cao et al., 2013; Bagyaveereswaran et al., 2017). Alternatively, demand defrost cycles can be controlled by directly measuring frost on the evaporator coils. In this scenario no prediction is necessary, as sensors positioned on the evaporator directly evaluate the state of the frost accumulation and their data is processed so that the defrost operation occurs when best suited. The resistance of a given sample varies with its form and material. Air, ice and water have quite different electrical resistance values, meaning that if two electrodes are positioned in the evaporator (but close enough for a voltage drop to be measured on a highly resistive material such as ice) and a voltage is applied on the terminals, a characteristic voltage drop will be measured as water forms, and this voltage drop will decrease as this water freezes, giving accurate measures of the ice formation. A device based on this characteristic was developed by Gaspar et al. (2016) and Caetano et al. (2018), as shown in Fig. 4.
Figure 4: Apparatus for water and ice detection using a resistive sensor (Caetano et al., 2018)
In the present paper, more materials and distances between the electrodes were tested in order to optimize the sensor operation by trying to find the optimal configuration for ice detection on the evaporator. The tested parameters are based on Eq. (1):
𝑅 =
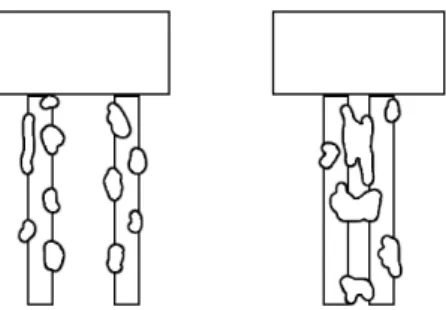
!"! Eq. (1)Where R is the measured resistance, ρ the resistivity of the material between the electrodes which is the variable that indicates if there is water, ice or air between the electrodes, L the length of this material (directly related with the distance between the electrodes), and A the section area of this material. In order to increase the sensibility of the sensor, R must as low as possible when there is water, and high when there is air in between the electrodes. Therefore, L is decreased and A is increase. The section A automatically increases with the decrease of L as the droplets of water that form upon the water condensation on the evaporator. Ultimately, a bridge between the electrodes is formed, and this happens easier if the gap between these electrodes is smaller as seen on Figure 5. This condensed water will result in a decrease of the resistance of the sensor and consequent higher voltage drop.
Figure 5: Formation of water droplets on the electrodes of the sensor (left) and bridges of water formed during condensation on a sensor with the electrodes closer (right)
2. EXPERIMENTAL SETUP
An analog-to-digital converter (ADC) uses a voltage divider to measure the voltage drop between the electrodes as shown in Fig. 6. The ADC returns a value between 0 and 1023, that represents lower and higher resistances respectively. Ice and air should be expected to give values near 1023, as they have high resistive values, and water should have a lower value.
Figure 6: Experimental setup scheme
Sixteen sensor configurations are tested: eight with copper electrodes and eight with zinc plated electrodes. Both copper and zinc sensors have electrode distances of 3.0, 3.5, 4.0, 4.5, 5.0, 6.0, 7.0 and 8.0 mm.
3. RESULTS
Ten measurements were made for each set of electrodes distance, material and substance between the electrodes due to measurement fluctuations. The average results of ADC conversion is shown on Table 1.
Table 1. Values of ADC conversions obtained for the different electrode distances and materials
Electrodes distance
(mm)
Air Water Ice
Copper Zinc
plated Copper plated Zinc Copper plated Zinc
3.0 1023 1023 461.2 435.6 1010 1009
3.5 1023 1023 812 750.9 1014 1010
4.0 1023 1023 902.3 844.7 1017 1013
4. ANALYSIS OF RESULTS AND DISCUSSION
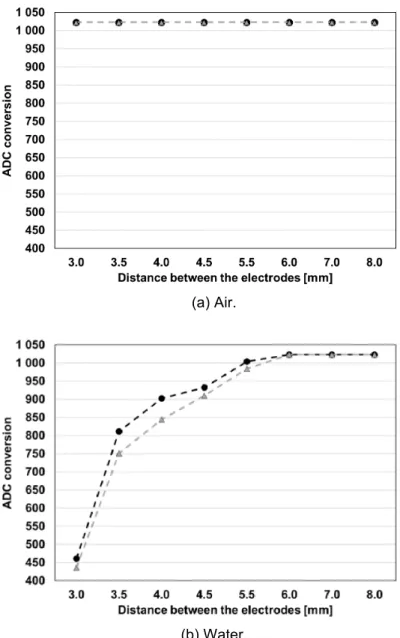
Fig. 7 shows the comparison between copper and zinc plated. No significant difference is observed between the curves, as the values for each distance are close. Although, the zinc plated electrode usually has a slightly lower value.
(a) Air.
(c) Ice.
Figure 7: ADC conversion value vs. distance between electrodes for values for copper and zinc plated electrodes (cooper: l; zinc plated: p)
Fig. 8 shows the comparison between air, water and ice for zinc plated and copper electrodes. Because of the high resistivity of ice, it is hard to distinguish between ice and air. The water is the medium with the most variation with the electrode distances, as the water droplets easily form water bridges between the electrodes that are closer to each other, and as these distances increase it becomes harder to establish a water connection between the electrodes.
(b) Cooper electrodes.
Figure 8: Values obtained for air, water and ice for the zinc plated electrodes (Air: £; - Water: l; Ice:
p)
5. CONCLUSIONS
As expected, the closer the electrodes are, the easier it is to distinguish between ice, water and air, which is the main objective of implementing these sensors in evaporators. The difference between copper and zinc plated electrodes is not significant, so it is recommended to use the most corrosion resistant material, or even test more corrosion resistant materials such as stainless steel, to evaluate if the difference in measurements amongst electrode materials is still not relevant. This can be important as the materials that can form oxide layers might have different resistances and therefore different readings and lower durability.
Further research should be made on the subject, regarding other morphologies (smaller and larger electrode diameters, flat electrodes, non-parallel electrodes, etc).
Although it can be difficult to distinguish ice from air, the fact that one doesn’t form right after the other might help with misreading. Water forms before ice, and when frozen, ice melts into water before the electrodes dry. This causes a significant drop in the resistance of the sensor that can help to know if a defrosting operation is due, or if a defrosting operation has been successful and can be terminated.
This paper further proves the concept of a resistive sensor being used for demand defrosting. Nonetheless, further studies should be done to increase the precision of ice detection, and reduce the sensor size to make it more practical for implementation.
ACKNOWLEDGEMENTS
This work has been supported by the project Centro-01-0145-FEDER-000017 - EMaDeS - Energy, Materials and Sustainable Development, co-financed by the Portugal 2020 Program (PT 2020), within the Regional Operational Program of the Center (CENTRO 2020) and the European Union through the European Regional Development Fund (ERDF). The authors wish to thank the opportunity and financial support that permitted to carry on this project.
REFERENCES
Aguiar, M. L., Gaspar, P. D. & Silva, P. D., 2018. Frost Measurement Methods for Demand Defrost Control Systems: A Review. London, IAENG.
Bagyaveereswaran, V., Subramanian, S. S. & Anitha, R., 2017. Smart Defrost Control for Refrigeration System. International Journal of Applied Engineering Research, 12(22), pp. 12202-12207.
Buick, T. R., McMullan, J. T., Morgan, R. & Murray, R. B., 1978. Ice detection in heat pumps and coolers. Energy Research, Volume 2, pp. 85-98.
Caetano, D., Gaspar, P. D. & da Silva, P. D., 2018. Experimental testing of a resistive sensor for monitoring frost formation in refrigeration systems. Valencia, s.n.
Cao, Z.-K., Zhang, C.-X. & Gu, B., 2013. Application of a support vector machine algorithm for improving effects of defrosting of commercial refrigerated display cabinets in supermarkets. HVAC&R Research, 19(3), pp. 230-241.
Cui, J., Li, W. Z., Liu, Y. & Jiang, Z. Y., 2011. A new time- and space-dependent model for predicting frost formation. Applied Thermal Engineering, Volume 31, pp. 447-457.
Datta, D., Tassou, S. A. & Marriott, D., 1997. Frost prediction on evaporator coils of supermarket display cabinets using artificial neural networks. Brussels, s.n.
Gaspar, P. D., Silva, P. D., Nunes, J. & Andrade, L. P., 2016. Monitoring device of ice formation in evaporator surface of refrigeration systems. Coimbra - Portugal, s.n.
Guo, X.-M., Chen, Y.-G., Wang, W.-H. & Chen, C.-Z., 2008. Experimental study on frost growth and dynamic performance of air source heat pump system. Applied Thermal Engineering , Volume 28, p. 2267–2278.
Hermes, C. J. L., Piucco, R. O., Barbosa Jr., J. R. & Melo, C., 2009. A study of frost growth and densification on flat surfaces. Experimental Thermal and Fluid Science, Volume 33, pp. 371-379.
Jarrett, J. H., 1972. A New Demand Defrost Control for Domestic Forced Draft Refrigerator Freezers and Freezers. IEEE Transactions on Industry Applications, IA-8(3), pp. 356-364. Jiang, Y. et al., 2013. A novel defrosting control method based on the degree of refrigerant
superheat for air source heat pumps. International journal of refrigeration, Volume 36, pp. 2278-2288.
Kalogirou, S. A., 2000. Applications of artificial neural-networks for energy systems. Applied Energy, Volume 67, pp. 17-35.
Lawrence, J. M. W. & Parker, B. C., 1998. Defrost control method and apparatus. United States of America, Patente Nº 5,813,242.
Melo, C., Hermes, C. J. & Silva, D. L., 2011. Experimental study of frost accumulation on fan-supplied tube-fin evaporators. Applied Thermal Engineering, Volume 31, pp. 1013-1020.
Melo, C., Hermes, C. J. & Silva, D. L., 2017. Effect of frost morphology on the thermal-hydraulic performance of fan-supplied tube-fin evaporators. Applied Thermal Engineering, pp. 1060-1068. Muller, E. D., 1975. A new concept for defrosting refrigeration plants. Kalte, 28(2), pp. 52-54.
Wang, F., Liang, C. & Zhang, X., 2017. Research of anti-frosting technology in refrigeration and air conditioning fields: A review. Renewable and Sustainable Energy Reviews, Volume 81, pp. 707-722.
Wang, W. et al., 2011. Field test investigation of the characteristics for the air source heat pump under two typical mal-defrost phenomena. Applied Energy, Volume 88, p. 4470–4480.
Xiao, J., Wang, W., Guo, Q. C. & Zhao, Y. H., 2010. An experimental study of the correlation for predicting the frost height in applying the photoelectric technology. International Journal of Refrigeration, Volume 33, pp. 1006-1014.
Yang, D.-K., Lee, K.-s. & Cha, D.-J., 2006. Frost formation on a cold surface under turbulent flow. International Journal of Refrigeration, Volume 29, pp. 164-169.