Understanding the relevance of national culture in international business research: A quantitative analysis
López-Duarte, Cristina*
University of Oviedo, Department of Business
[email protected], +34985182179
Fc. Commerce, Tourism and Social Sciences Av. Luís Moya, 33203 Gijón, Asturias, Spain
Vidal-Suárez, Marta M.
University of Oviedo, Department of Business
[email protected], +34985182302
Fc Commerce, Tourism and Social Sciences Av. Luís Moya, 33203 Gijón, Asturias, Spain
González-Díaz, Belén.
University of Oviedo, Department of Accountancy
[email protected], +34985182176
Fc Commerce, Tourism and Social Sciences Av. Luís Moya, 33203 Gijón, Asturias, Spain
Nuno Rosa Reis
Instituto Politécnico de Leiria, Escola Superior de Tecnologia e Gestão,
[email protected], +351 244 820 300
Morro do Lena – Alto Vieiro 2411-901 Leiria, Portugal
* Corresponding author
Understanding the relevance of national culture in International Business research: A quantitative analysis
Abstract
This review is a comprehensive quantitative analysis of the International Business literature
whose focus is on national culture. The analysis relies on a broad range of bibliometric
techniques as productivity rankings, citation analysis (individual and cumulative), study of
collaborative research patterns, and analysis of the knowledge base. It provides insights on (I)
faculty and institutional research productivity and performance; (II) articles, institutions, and scholars’ influence in the contents of the field and its research agenda; and (III) national and
international collaborative research trends. The study also explores the body of literature that has
exerted the greatest impact on the researched set of selected articles.
Key words: Quantitative analysis, national culture, international business, bibliometric, citation
INTRODUCTION
The role played by national culture (NC) and cultural differences and distances (CD) in a wide
range of International Business (IB) decisions has been researched extensively in existing
literature. As a consequence, some recent literature reviews within the IB field have focused their
attention on this issue. Some of these reviews center their attention on a specific topic as, for
instance, the impact of cultural differences on the mode used to enter the target markets, the
performance of the internationalization processes, or the way of managing shared ventures —e.g.:
Harzing (2003); Morschett et al. (2010), Reus and Rottig (2009); Shenkar (2001); Tihanyi et al.
(2005). Others show a wider perspective, as the recent review published in the International
Journal of Management Reviews by López-Duarte, et al. (2015) —LVG from here— aimed at
mapping the entire field (e.g.: international growth decisions, choice of target countries,
alternative entry modes features and performance, human resource management, organizational
design, knowledge transfer).
LVG (2015) is a study developed from a subjective approach based on a qualitative analysis of
265 selected articles published in 26 leading IB and Management journals from 2000 to 20121.
As a qualitative study, it relies on a content analysis of the articles selected by the research team.
Therefore, it can be expected that the final output reflects the subjective views and interpretations
of its authors (Ramos-Rodríguez and Ruíz-Navarro, 2004). In other words, when a literature
review is developed from a qualitative approach, potential personal biases arise as the researchers
1 See LVG (2015) for an exhaustive description of the process and criteria followed to select both the journals and the articles included in the researched dataset. In short, the list of selected journals includes the International
Business Review (IBR), International Marketing Review (IMR), Journal of International Business Studies (JIBS), Journal of International Management (JIMn), Journal of International Marketing (JIMr), Journal of World Business (JWB), and Management International Review (MIR), as well as the 20-top academic management journals initially
classified by Gómez-Mejía and Balkin (1992) and later reviewed by Pisani (2011) and Werner (2002). The dataset of selected studies gathers full length articles that focus on firm-level business activity and management decisions in international contexts and show a specific focus on NC/CD.
interpret the field as a result of their experience. In fact, to fully understand the structure of any
field of study, qualitative/subjective analyses must be complemented with quantitative/objective
ones that prevent any personal biases of the researchers and provide objectivity and reliability of
results2 (Acedo and Casillas, 2005).
The purpose of this article is to perform a comprehensive quantitative analysis of the relevance of
NC/CD in IB literature. We use the same set of articles selected by LVG (2015) 3 in order to complement and improve LVG’s qualitative findings. We contribute to the IB literature by
providing insights on (I) faculty and institutional research productivity and performance; (II) articles, institutions, and scholars’ influence in the contents of the field and its research agenda;
and (III) the body of literature that has exerted the greatest impact on this set of selected articles.
We conduct a series of bibliometric analyses that rely on the application of quantitative methods
to a sample of articles (Pritchard, 1969). Examining the use of documents and publications
patterns (Diodato,1994; Hawkins, 1977) within existing literature on a topic permits measuring,
describing, and evaluating scientific publications (Hood and Wilson, 2001; Moed et al. 1995) and
provides a monitoring device for university research management and even science policy. Thus
we offer a quantitative, arguably objective, depiction of the field of study which may contribute
to track academic advancements and steer future research endeavors. The bibliometric techniques
used in this paper are productivity rankings (for both scholars and institutions), citation analysis,
study of collaborative research trends, and analysis of the knowledge base.
2 See Lahiri and Kumar (2012) for an exhaustive appraisal of the relevance of quantitative reviews on a wide variety of disciplinary areas.
3 An appendix gathering the 265 articles used in LVG (2015) is available in the on-line version of the article published in the journal’s website.
The article is organized as follows: first, we present the analysis of most prolific and productive
authors and institutions. Then the citation analysis identifying most influential works, authors,
and institutions is presented. The following section explores the collaborative research trends
within the field. Finally, the analysis of the knowledge base is performed and its results are
depicted. The last section displays main conclusions, reflections and limitations.
PRODUCTIVITY RANKINGS
Productivity rankings inform about the most prolific and productive authors/institutions within
the field. In order to provide a comprehensive overview, we rely on the total and adjusted number
of articles published by authors and institutions, their length, and their performance in terms of 9
different journal metrics. In order to build these rankings, data relative to each article was
collected and categorized by author/s, authors’ institutional affiliation at the time of publication, institutions’ host countries, year, journal, article length, and journals’ performance in the year of
publication.
Absolute and adjusted productivity of authors and institutions: number of published articles Paper counts are the most basic bibliometric measure; nevertheless, they are a first approach to compare the productivity and volume of research among scholars and institutions. A high number of publications in top journals indicates that a scholar/institution has been prolific and successful in generating high quality research within the field and high visibility output (Peng and Zhou (2006), as well as in submitting her/his research to the critical review of fellow researchers and gaining their approval (Ramos-Rodríguez and Ruíz-Navarro (2004). These scholars/institutions may hold considerable influence on the direction of future research and should receive special credit for facilitating advancement of knowledge within this area. In other words, this analysis provides insights into the state of scholarship in this subfield by identifying scholars and institutions driving the research contexts and agenda. This is a particularly interesting issue if we
take into account the increasing number of researchers and institutions that focus their attention on the IB field. Additionally, developing these rankings is useful for comparative purposes across different sub-fields or areas within the IB field, especially in verifying consistency in research productivity, as well as for analyzing the changing geographical scope of the institutions driving the research agenda.
Therefore, our first productivity measure gathers information about the number of published
articles by scholars and institutions. For each of the 265 articles within the database we recorded
information about the authors, their institutional affiliation at the time of publication, and the
home country of each individual institution —we considered both academic and non-academic
institutions. For each individual author/institution we considered both full (or total) and fractional
(or adjusted) counting (Glänzel, 2001). The total or raw number of contributions gathers the
absolute number of articles in which each author/institution is involved (regardless of the total
number of co-authors in the article), while the adjusted contribution takes into account the
number of different co-authors in an article. The adjustment process considers that an author
contributes more, individually, with a single author article than with a multi-author article.
Therefore, it recognizes, and adjusts for, that portion of the article attributable to the
scholar/institution alone (Inkpen and Beamish, 1994; Knight et al. 2000). Following prior
research (e.g.: Knight et al., 2000; Kumar and Kundu 2004; Quer et al. 2007, Treviño et al.,
2010): (I) if an article was co-authored by more than one author from the same institution, the
institution was credited with one appearance (total or adjusted) per author, (II) if an author listed
a multiple institutional affiliation4, full credit (total or adjusted) was given to each institution; and
(III) no distinction was made regarding the order of appearance of scholars.
A total of 523 different authors and 304 institutions are involved in the 265 selected articles.
More than 80% of the authors and 55% of the academic institutions contributed only one article
(absolute counting). Although the result for academic institutions is fairly consistent with Lotka’s
law5, the percentage of scholars contributing only once is quite higher than expected. Both
authors and institutions counting adjust quite well to the square root law6, so that a relative low
number of scholars/institutions (i.e.: 31 authors and 14 institutions) is involved in more than half
of the total amount of articles. These results point to (I) a wide variety of researchers working in
the area, but only a few being able to consistently publish in the selected top journals, (II) the
existence of intra-university clusters of researchers working in the field, and (III) a high
concentration ratio of authors and institutions that work in a persistent way in the field.
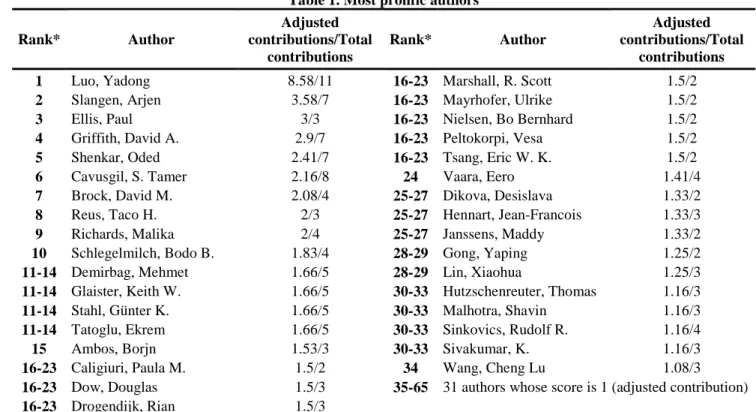
Tables 1 and 2 report the most prolific individual and institutional contributors to the field.
5 The first developemnt of this law was placed by Lotka in 1926 and it states that (I) the number (of authors) making n contributions is about 1/n² of those making one and (II) the proportion of all contributors that makes a single
contribution is about 60 per cent. See Glänzel and Schubert (1985) for an exhaustive review of the law contents and later updates.
6 Formerly placed by the De Solla in 1963, the square root law states that half of the scientific papers within a field/topic/area are contributed by the top square root of the total number of scientific authors —see Glänzel and Schubert (1985) for a review and updates.
Table 1. Most prolific authors Rank* Author Adjusted contributions/Total contributions Rank* Author Adjusted contributions/Total contributions 1 Luo, Yadong 8.58/11 16-23 Marshall, R. Scott 1.5/2 2 Slangen, Arjen 3.58/7 16-23 Mayrhofer, Ulrike 1.5/2 3 Ellis, Paul 3/3 16-23 Nielsen, Bo Bernhard 1.5/2 4 Griffith, David A. 2.9/7 16-23 Peltokorpi, Vesa 1.5/2 5 Shenkar, Oded 2.41/7 16-23 Tsang, Eric W. K. 1.5/2 6 Cavusgil, S. Tamer 2.16/8 24 Vaara, Eero 1.41/4 7 Brock, David M. 2.08/4 25-27 Dikova, Desislava 1.33/2 8 Reus, Taco H. 2/3 25-27 Hennart, Jean-Francois 1.33/3 9 Richards, Malika 2/4 25-27 Janssens, Maddy 1.33/2 10 Schlegelmilch, Bodo B. 1.83/4 28-29 Gong, Yaping 1.25/2 11-14 Demirbag, Mehmet 1.66/5 28-29 Lin, Xiaohua 1.25/3 11-14 Glaister, Keith W. 1.66/5 30-33 Hutzschenreuter, Thomas 1.16/3 11-14 Stahl, Günter K. 1.66/5 30-33 Malhotra, Shavin 1.16/3 11-14 Tatoglu, Ekrem 1.66/5 30-33 Sinkovics, Rudolf R. 1.16/4 15 Ambos, Borjn 1.53/3 30-33 Sivakumar, K. 1.16/3 16-23 Caligiuri, Paula M. 1.5/2 34 Wang, Cheng Lu 1.08/3 16-23 Dow, Douglas 1.5/3 35-65 31 authors whose score is 1 (adjusted contribution) 16-23 Drogendijk, Rian 1.5/3
As shown in Table 1, Yadong Luo, Arjen Slangen, Oded Shenkar and David Griffith are among
the top 5 most prolific authors considering both raw and adjusted counting, contributing more
than 2.4 times (adjusted contribution) to our selected list. Paul Ellis and S. Tamer Cavusgil are
among the top five when considering only adjusted or total contribution respectively7, but they
show a different profile: while Ellis contributes with 3 single authored articles to the database,
Cavusgil contributes with 8 articles, but participates repeatedly in intra and extramural research
teams. As shown in Table 1, large differences exist when comparing total and adjusted
contributions of most prolific authors pointing, once again, to the relevance of collaborative
research. Noteworthy is the collaboration among most prolific researchers (e.g.: Luo and
Shenkar, Griffith and Cavusgil). The magnitude of contribution of leading authors can best be
viewed in comparison to the average appearance of 0.51. Furthermore, taking into account their
total number of contributions, the wide spectrum of journals they have published in, as well as
existing distinctions among these journals in terms of aim and scope, we can affirm that some of
these prolific authors (e.g.: Luo, Shenkar) have reached a particularly extensive and diverse
audience.
7Luo has been identified as the most prolific author in different studies relative to the entire IB field (Lahiri and Kumar, 2012; Xu et al. 2008), as well as studies relative to a particular sub-field or area —e.g.: the study by Quer et al. (2007) relative to business and management in China. Cavusgil, Elllis, Griffith, Shenkar, and Tsang are also among the most prolific authors (adjusted counting) identified in Xu et al. (2008).
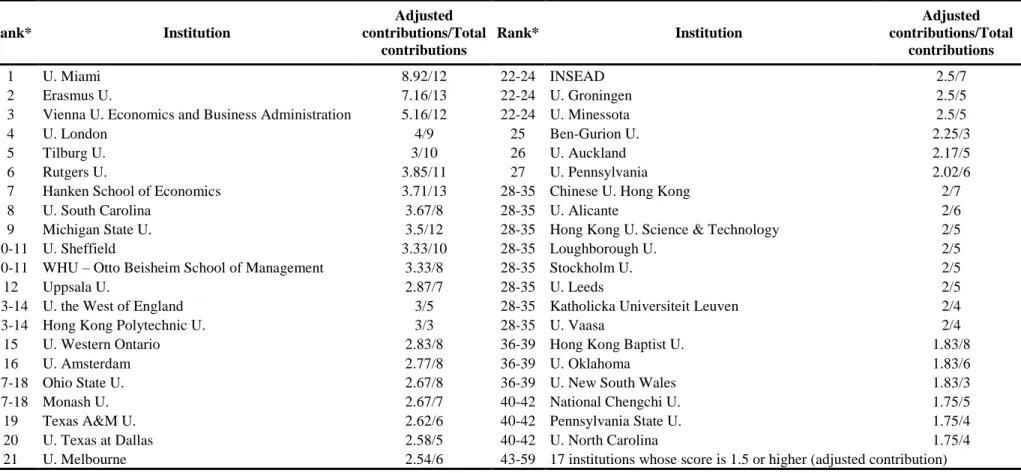
Table 2. Most prolific institutions Rank* Institution Adjusted contributions/Total contributions Rank* Institution Adjusted contributions/Total contributions 1 U. Miami 8.92/12 22-24 INSEAD 2.5/7 2 Erasmus U. 7.16/13 22-24 U. Groningen 2.5/5
3 Vienna U. Economics and Business Administration 5.16/12 22-24 U. Minessota 2.5/5
4 U. London 4/9 25 Ben-Gurion U. 2.25/3
5 Tilburg U. 3/10 26 U. Auckland 2.17/5
6 Rutgers U. 3.85/11 27 U. Pennsylvania 2.02/6
7 Hanken School of Economics 3.71/13 28-35 Chinese U. Hong Kong 2/7
8 U. South Carolina 3.67/8 28-35 U. Alicante 2/6
9 Michigan State U. 3.5/12 28-35 Hong Kong U. Science & Technology 2/5
10-11 U. Sheffield 3.33/10 28-35 Loughborough U. 2/5
10-11 WHU – Otto Beisheim School of Management 3.33/8 28-35 Stockholm U. 2/5
12 Uppsala U. 2.87/7 28-35 U. Leeds 2/5
13-14 U. the West of England 3/5 28-35 Katholicka Universiteit Leuven 2/4
13-14 Hong Kong Polytechnic U. 3/3 28-35 U. Vaasa 2/4
15 U. Western Ontario 2.83/8 36-39 Hong Kong Baptist U. 1.83/8
16 U. Amsterdam 2.77/8 36-39 U. Oklahoma 1.83/6
17-18 Ohio State U. 2.67/8 36-39 U. New South Wales 1.83/3
17-18 Monash U. 2.67/7 40-42 National Chengchi U. 1.75/5
19 Texas A&M U. 2.62/6 40-42 Pennsylvania State U. 1.75/4
20 U. Texas at Dallas 2.58/5 40-42 U. North Carolina 1.75/4
21 U. Melbourne 2.54/6 43-59 17 institutions whose score is 1.5 or higher (adjusted contribution) *Ranked by adjusted number of contributions.
The ranking of most prolific institutions is led by the University of Miami (USA), the Erasmus
University of Rotterdam (Netherlands), and the Vienna University of Economics and Business
Administration (Austria) both in terms of full and adjusted contribution. Actually, the set of
universities included in the top-10 are the same in both total and adjusted rankings, gathering six
European universities and four US universities. While the outstanding position of some of these
institutions is tightly linked to individual prolific authors (e.g.: University of Miami-Yadong
Luo), wider groups of authors contribute to the positioning of other academic institutions (e.g.:
Erasmus University-6 authors: Vienna University-5 authors). A wider exploration of the
geographic patterns shows that European institutions dominate this research area or sub-field —
40/45% (total/adjusted contribution, respectively) of the top-50 academic universities are
European—, while the US remains at a second place—37/32% representation. Conversely, the
presence of institutions from Asia-Pacific remains at about 20% in both rankings with no
institutions within the top-10. These results point to a wide internationalization of the knowledge
creation process within this sub-field, as institutions from around the globe are involved in this
body of research. Our findings corroborate only partially previous studies: although the
internationalization of knowledge creation was already predicted by Inkpen and Beamish (1994)8
and later corroborated by Lahiri and Kumar (2012), Treviño et al. (2010), and Xu et al. (2008)9,
these studies show a predominant role of North American institutions and an emerging and/or far
second (even third) place of European institutions. In addition, the most recent studies point to
institutions coming from Asia-Pacific as a growing force that is not corroborated in our study.
8 They found a slight increase in the weight of non-US institutions when comparing their results with those of a previous study by Morrison and Inkpen (1991).
Conversely, our findings point to the relevance of European institutions in driving the research
agenda within this particular sub-field in the analyzed period.
Absolute and adjusted productivity of authors and institutions based on journals’ performance
Journal metrics play a central role in most performance evaluations of research outputs as they
have become a highly used way to rank scientific journals. As stated in Glänzel and Moed
(2002), journal metrics are designed to assess the significance and performance of individual
journals, their role and position in the international formal communication network, and their
quality or prestige as perceived by scholars. Different metrics exist, each of them calibrated to
take into account specific features and focused on a particular (therefore, limited) perspective.
Bibliometricians agree on the complex and multi-dimensional nature of journal performance
(Moed et al., 2012). As a consequence, no single metric can effectively capture the entire spectrum of research performance; using Moed’s (2010, p. 274) words “there is no single perfect
indicator of journal performance”.
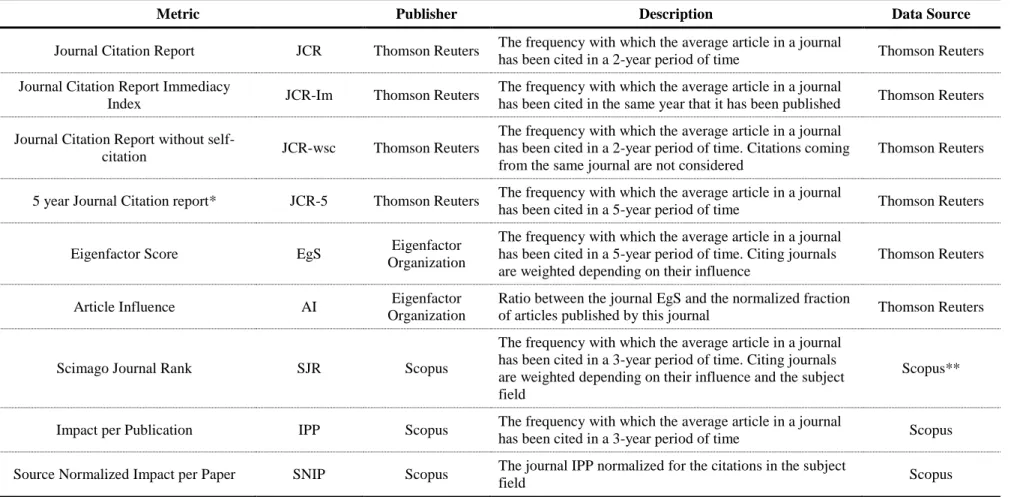
In order to provide a wide perspective of authors and institutions’ productivity based on journals
performance, and following suggestions in the White Paper on the Evolution of Journals
Assessment, our analysis is based on nine different metrics whose respective methodologies, data
sources, advantages, and drawbacks have been widely discussed in existing literature10. In
particular, we have based on the metrics calculated and published by Thomson Reuters —i.e.:
Journal Citations Reports (JCR)—, Eigenfactor Organization, and Scopus: JCR Annual-impact
factor (JCR), JCR Annual-impact factor without journal self-citation (JCR-wsc), JCR 5-year
10 See, among others, Bergstrom (2007), Bergstrom et al. (2008). Colledge et al. (2010), González-Pereira et al. (2010), Guerrero-Bote and Moya-Anegón (2012), Moed et al. (2012), Sicilia et al. (2011), and Waltman et al. (2013).
impact factor (JCR-5), JCR Immediacy index (JCR-im), Eigenfactor Score (EgS), Article
Influence Score (AI), Impact per Publication (IPP), Source Normalized Impact per Paper (SNIP),
Table 3. Overview of journal metrics
Metric Publisher Description Data Source
Journal Citation Report JCR Thomson Reuters The frequency with which the average article in a journal
has been cited in a 2-year period of time Thomson Reuters Journal Citation Report Immediacy
Index JCR-Im Thomson Reuters
The frequency with which the average article in a journal
has been cited in the same year that it has been published Thomson Reuters Journal Citation Report without
self-citation JCR-wsc Thomson Reuters
The frequency with which the average article in a journal has been cited in a 2-year period of time. Citations coming from the same journal are not considered
Thomson Reuters
5 year Journal Citation report* JCR-5 Thomson Reuters The frequency with which the average article in a journal
has been cited in a 5-year period of time Thomson Reuters Eigenfactor Score EgS Eigenfactor
Organization
The frequency with which the average article in a journal has been cited in a 5-year period of time. Citing journals are weighted depending on their influence
Thomson Reuters
Article Influence AI Eigenfactor Organization
Ratio between the journal EgS and the normalized fraction
of articles published by this journal Thomson Reuters
Scimago Journal Rank SJR Scopus
The frequency with which the average article in a journal has been cited in a 3-year period of time. Citing journals are weighted depending on their influence and the subject field
Scopus**
Impact per Publication IPP Scopus The frequency with which the average article in a journal
has been cited in a 3-year period of time Scopus Source Normalized Impact per Paper SNIP Scopus The journal IPP normalized for the citations in the subject
field Scopus
To assess institutions and authors’ productivity the following process was followed: as a first step
and for each of the 265 articles, we considered the nine different journal metrics in the year that
the article was published. Second, we weighted each of these metrics by the adjusted number of
authors and the standardized article’s length —the total number of pages per article was
standardized based on a conversion factor using the average number of pages of the articles
published in the Journal of International Business Studies. Then, a cumulative value was
estimated for each of the 523 authors by adding the scores relative to all the articles in which the
author was involved. The final output is an author’s cumulative productivity value for each of the
nine different metrics considered. The same process was applied in order to assess the
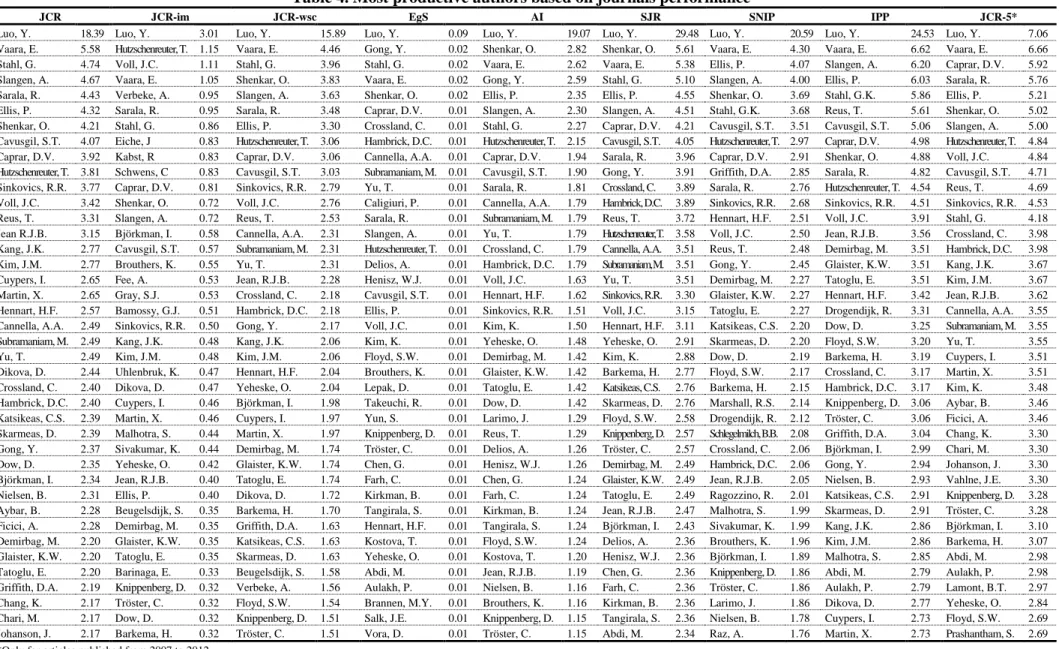
productivity of the 304 institutions. Tables 4 and 5 present these cumulative values for the most
productive authors and institutions respectively.
As said before, each metric aims at favoring a particular perspective; therefore, rankings differ
from one another. Although correlations exist, they are far from perfect. Focusing on the
leadership positions in each ranking, we find 2 authors that keep consistently among the top-10
regardless of the metric considered: Luo Yadong and Eero Vaara11. As they keep this position
even in the JCR-5 that is only calculated for articles published after 2007, we can affirm that their
leadership keeps consistent all along the analyzed period. Gunter Stahl keeps within this top-10
group for all metrics except JCR-5, pointing to a leadership position similar to that of the former
two, but in the first sub-period (2000-2006). Conversely, other authors (e.g. Johannes C. Voll)
enter the top-10 only for JCR-5, pointing to the opposite situation. Oded Shenkar and Dan V.
11 Up to 9 of our top-50 most productive scholars (JCR) are also among the most productive authors in the entire IB field in the period 1996-2008 as shown in the study by Treviño et al. (2010).
Caprar keep a consistent prominent position except for immediacy index; while Alain Verbeke,
Julia Eiche, Christian Schwens, and Ruediger Kabst enter this top-10 list only when considering
the immediacy degree of the citation process, pointing to cutting-the-edge research quickly
acknowledged and cited by colleagues. Nevertheless, it must be noted that the immediacy index
is biased by the number of issues per year published by the journal: articles in journals that
publish a high number of issues per year (e.g.: Strategic Management Journal, Journal of
Management Studies) are more likely to be cited within the same year than articles published in
journals that publish a low number of issues per year (e.g.: Academy of Management Review,
Journal of World Business).
As shown in Table 4, some authors enter this top-10 selected group when the citing journals
influence is considered (e.g.: Yaping Gong, Craig Crossland, Donald Hambrick, Albert Cannella,
Mohan Subramanian), while other authors enter this group when the data source is broadened
(e.g.: David Griffith, Taco Reus). Arjen Slangen, Riika Sarala, Paul Ellis, S. Tamer Cavusgil, and
Thomas Hutzschenreuter are also consistently among the top-10 in terms of productivity based
Table 4. Most productive authors based on journals performance
JCR JCR-im JCR-wsc EgS AI SJR SNIP IPP JCR-5*
Luo, Y. 18.39 Luo, Y. 3.01 Luo, Y. 15.89 Luo, Y. 0.09 Luo, Y. 19.07 Luo, Y. 29.48 Luo, Y. 20.59 Luo, Y. 24.53 Luo, Y. 7.06 Vaara, E. 5.58 Hutzschenreuter, T. 1.15 Vaara, E. 4.46 Gong, Y. 0.02 Shenkar, O. 2.82 Shenkar, O. 5.61 Vaara, E. 4.30 Vaara, E. 6.62 Vaara, E. 6.66 Stahl, G. 4.74 Voll, J.C. 1.11 Stahl, G. 3.96 Stahl, G. 0.02 Vaara, E. 2.62 Vaara, E. 5.38 Ellis, P. 4.07 Slangen, A. 6.20 Caprar, D.V. 5.92 Slangen, A. 4.67 Vaara, E. 1.05 Shenkar, O. 3.83 Vaara, E. 0.02 Gong, Y. 2.59 Stahl, G. 5.10 Slangen, A. 4.00 Ellis, P. 6.03 Sarala, R. 5.76 Sarala, R. 4.43 Verbeke, A. 0.95 Slangen, A. 3.63 Shenkar, O. 0.02 Ellis, P. 2.35 Ellis, P. 4.55 Shenkar, O. 3.69 Stahl, G.K. 5.86 Ellis, P. 5.21 Ellis, P. 4.32 Sarala, R. 0.95 Sarala, R. 3.48 Caprar, D.V. 0.01 Slangen, A. 2.30 Slangen, A. 4.51 Stahl, G.K. 3.68 Reus, T. 5.61 Shenkar, O. 5.02 Shenkar, O. 4.21 Stahl, G. 0.86 Ellis, P. 3.30 Crossland, C. 0.01 Stahl, G. 2.27 Caprar, D.V. 4.21 Cavusgil, S.T. 3.51 Cavusgil, S.T. 5.06 Slangen, A. 5.00 Cavusgil, S.T. 4.07 Eiche, J 0.83 Hutzschenreuter, T. 3.06 Hambrick, D.C. 0.01 Hutzschenreuter, T. 2.15 Cavusgil, S.T. 4.05 Hutzschenreuter, T. 2.97 Caprar, D.V. 4.98 Hutzschenreuter, T. 4.84 Caprar, D.V. 3.92 Kabst, R 0.83 Caprar, D.V. 3.06 Cannella, A.A. 0.01 Caprar, D.V. 1.94 Sarala, R. 3.96 Caprar, D.V. 2.91 Shenkar, O. 4.88 Voll, J.C. 4.84 Hutzschenreuter, T. 3.81 Schwens, C 0.83 Cavusgil, S.T. 3.03 Subramaniam, M. 0.01 Cavusgil, S.T. 1.90 Gong, Y. 3.91 Griffith, D.A. 2.85 Sarala, R. 4.82 Cavusgil, S.T. 4.71 Sinkovics, R.R. 3.77 Caprar, D.V. 0.81 Sinkovics, R.R. 2.79 Yu, T. 0.01 Sarala, R. 1.81 Crossland, C. 3.89 Sarala, R. 2.76 Hutzschenreuter, T. 4.54 Reus, T. 4.69 Voll, J.C. 3.42 Shenkar, O. 0.72 Voll, J.C. 2.76 Caligiuri, P. 0.01 Cannella, A.A. 1.79 Hambrick, D.C. 3.89 Sinkovics, R.R. 2.68 Sinkovics, R.R. 4.51 Sinkovics, R.R. 4.53 Reus, T. 3.31 Slangen, A. 0.72 Reus, T. 2.53 Sarala, R. 0.01 Subramaniam, M. 1.79 Reus, T. 3.72 Hennart, H.F. 2.51 Voll, J.C. 3.91 Stahl, G. 4.18 Jean R.J.B. 3.15 Björkman, I. 0.58 Cannella, A.A. 2.31 Slangen, A. 0.01 Yu, T. 1.79 Hutzschenreuter, T. 3.58 Voll, J.C. 2.50 Jean, R.J.B. 3.56 Crossland, C. 3.98 Kang, J.K. 2.77 Cavusgil, S.T. 0.57 Subramaniam, M. 2.31 Hutzschenreuter, T. 0.01 Crossland, C. 1.79 Cannella, A.A. 3.51 Reus, T. 2.48 Demirbag, M. 3.51 Hambrick, D.C. 3.98 Kim, J.M. 2.77 Brouthers, K. 0.55 Yu, T. 2.31 Delios, A. 0.01 Hambrick, D.C. 1.79 Subramaniam, M. 3.51 Gong, Y. 2.45 Glaister, K.W. 3.51 Kang, J.K. 3.67 Cuypers, I. 2.65 Fee, A. 0.53 Jean, R.J.B. 2.28 Henisz, W.J. 0.01 Voll, J.C. 1.63 Yu, T. 3.51 Demirbag, M. 2.27 Tatoglu, E. 3.51 Kim, J.M. 3.67 Martin, X. 2.65 Gray, S.J. 0.53 Crossland, C. 2.18 Cavusgil, S.T. 0.01 Hennart, H.F. 1.62 Sinkovics, R.R. 3.30 Glaister, K.W. 2.27 Hennart, H.F. 3.42 Jean, R.J.B. 3.62 Hennart, H.F. 2.57 Bamossy, G.J. 0.51 Hambrick, D.C. 2.18 Ellis, P. 0.01 Sinkovics, R.R. 1.51 Voll, J.C. 3.15 Tatoglu, E. 2.27 Drogendijk, R. 3.31 Cannella, A.A. 3.55 Cannella, A.A. 2.49 Sinkovics, R.R. 0.50 Gong, Y. 2.17 Voll, J.C. 0.01 Kim, K. 1.50 Hennart, H.F. 3.11 Katsikeas, C.S. 2.20 Dow, D. 3.25 Subramaniam, M. 3.55 Subramaniam, M. 2.49 Kang, J.K. 0.48 Kang, J.K. 2.06 Kim, K. 0.01 Yeheske, O. 1.48 Yeheske, O. 2.91 Skarmeas, D. 2.20 Floyd, S.W. 3.20 Yu, T. 3.55 Yu, T. 2.49 Kim, J.M. 0.48 Kim, J.M. 2.06 Floyd, S.W. 0.01 Demirbag, M. 1.42 Kim, K. 2.88 Dow, D. 2.19 Barkema, H. 3.19 Cuypers, I. 3.51 Dikova, D. 2.44 Uhlenbruk, K. 0.47 Hennart, H.F. 2.04 Brouthers, K. 0.01 Glaister, K.W. 1.42 Barkema, H. 2.77 Floyd, S.W. 2.17 Crossland, C. 3.17 Martin, X. 3.51 Crossland, C. 2.40 Dikova, D. 0.47 Yeheske, O. 2.04 Lepak, D. 0.01 Tatoglu, E. 1.42 Katsikeas, C.S. 2.76 Barkema, H. 2.15 Hambrick, D.C. 3.17 Kim, K. 3.48 Hambrick, D.C. 2.40 Cuypers, I. 0.46 Björkman, I. 1.98 Takeuchi, R. 0.01 Dow, D. 1.42 Skarmeas, D. 2.76 Marshall, R.S. 2.14 Knippenberg, D. 3.06 Aybar, B. 3.46 Katsikeas, C.S. 2.39 Martin, X. 0.46 Cuypers, I. 1.97 Yun, S. 0.01 Larimo, J. 1.29 Floyd, S.W. 2.58 Drogendijk, R. 2.12 Tröster, C. 3.06 Ficici, A. 3.46 Skarmeas, D. 2.39 Malhotra, S. 0.44 Martin, X. 1.97 Knippenberg, D. 0.01 Reus, T. 1.29 Knippenberg, D. 2.57 Schlegelmilch, B.B. 2.08 Griffith, D.A. 3.04 Chang, K. 3.30 Gong, Y. 2.37 Sivakumar, K. 0.44 Demirbag, M. 1.74 Tröster, C. 0.01 Delios, A. 1.26 Tröster, C. 2.57 Crossland, C. 2.06 Björkman, I. 2.99 Chari, M. 3.30 Dow, D. 2.35 Yeheske, O. 0.42 Glaister, K.W. 1.74 Chen, G. 0.01 Henisz, W.J. 1.26 Demirbag, M. 2.49 Hambrick, D.C. 2.06 Gong, Y. 2.94 Johanson, J. 3.30 Björkman, I. 2.34 Jean, R.J.B. 0.40 Tatoglu, E. 1.74 Farh, C. 0.01 Chen, G. 1.24 Glaister, K.W. 2.49 Jean, R.J.B. 2.05 Nielsen, B. 2.93 Vahlne, J.E. 3.30 Nielsen, B. 2.31 Ellis, P. 0.40 Dikova, D. 1.72 Kirkman, B. 0.01 Farh, C. 1.24 Tatoglu, E. 2.49 Ragozzino, R. 2.01 Katsikeas, C.S. 2.91 Knippenberg, D. 3.28 Aybar, B. 2.28 Beugelsdijk, S. 0.35 Barkema, H. 1.70 Tangirala, S. 0.01 Kirkman, B. 1.24 Jean, R.J.B. 2.47 Malhotra, S. 1.99 Skarmeas, D. 2.91 Tröster, C. 3.28 Ficici, A. 2.28 Demirbag, M. 0.35 Griffith, D.A. 1.63 Hennart, H.F. 0.01 Tangirala, S. 1.24 Björkman, I. 2.43 Sivakumar, K. 1.99 Kang, J.K. 2.86 Björkman, I. 3.10 Demirbag, M. 2.20 Glaister, K.W. 0.35 Katsikeas, C.S. 1.63 Kostova, T. 0.01 Floyd, S.W. 1.24 Delios, A. 2.36 Brouthers, K. 1.96 Kim, J.M. 2.86 Barkema, H. 3.07 Glaister, K.W. 2.20 Tatoglu, E. 0.35 Skarmeas, D. 1.63 Yeheske, O. 0.01 Kostova, T. 1.20 Henisz, W.J. 2.36 Björkman, I. 1.89 Malhotra, S. 2.85 Abdi, M. 2.98 Tatoglu, E. 2.20 Barinaga, E. 0.33 Beugelsdijk, S. 1.58 Abdi, M. 0.01 Jean, R.J.B. 1.19 Chen, G. 2.36 Knippenberg, D. 1.86 Abdi, M. 2.79 Aulakh, P. 2.98 Griffith, D.A. 2.19 Knippenberg, D. 0.32 Verbeke, A. 1.56 Aulakh, P. 0.01 Nielsen, B. 1.16 Farh, C. 2.36 Tröster, C. 1.86 Aulakh, P. 2.79 Lamont, B.T. 2.97 Chang, K. 2.17 Tröster, C. 0.32 Floyd, S.W. 1.54 Brannen, M.Y. 0.01 Brouthers, K. 1.16 Kirkman, B. 2.36 Larimo, J. 1.86 Dikova, D. 2.77 Yeheske, O. 2.84 Chari, M. 2.17 Dow, D. 0.32 Knippenberg, D. 1.51 Salk, J.E. 0.01 Knippenberg, D. 1.15 Tangirala, S. 2.36 Nielsen, B. 1.78 Cuypers, I. 2.73 Floyd, S.W. 2.69 Johanson, J. 2.17 Barkema, H. 0.32 Tröster, C. 1.51 Vora, D. 0.01 Tröster, C. 1.15 Abdi, M. 2.34 Raz, A. 1.76 Martin, X. 2.73 Prashantham, S. 2.69 *Only for articles published from 2007 to 2012.
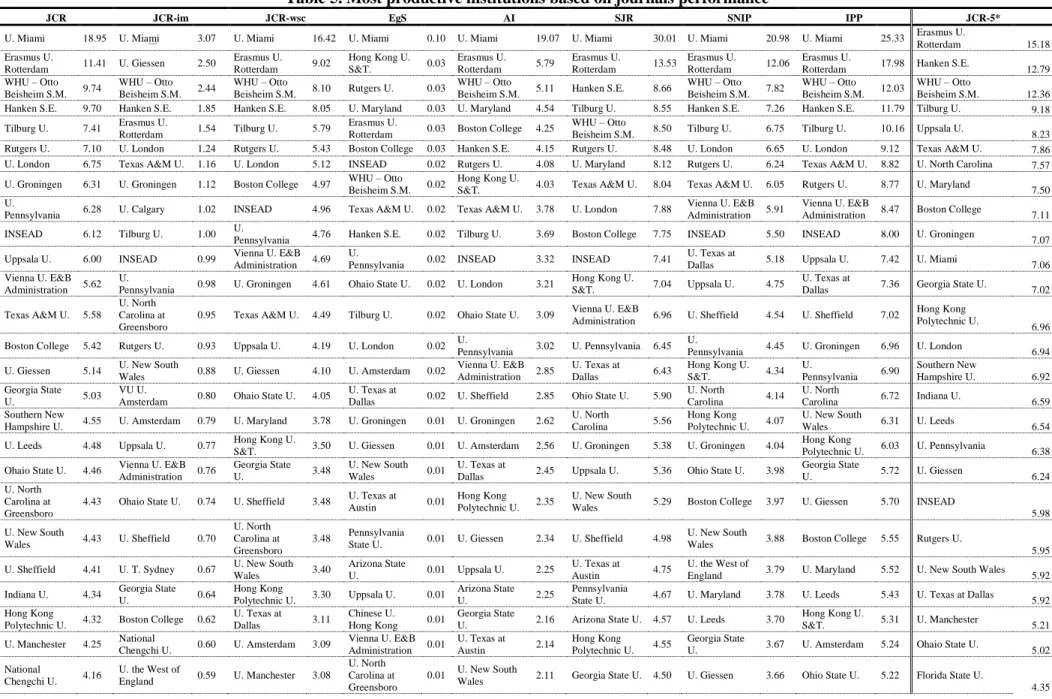
Heterogeneity among institutional rankings is less striking than among authors’ ones (Table 5). 3
European universities keep among the top-10 regardless of the metrics considered —the Erasmus
University of Rotterdam (Netherlands), the Hanken School of Economics (Finland), and the
WHU Otto Beisheim School of Management (Germany). The University of Miami (USA) also
remains within the top-10 for all journal metrics except for the JCR-5 (only available for articles
published in the last years of the analyzed period). The Tilburg University (Netherlands), the
Rutgers University (USA), and the University of London (UK) also show particularly prominent
positions. Diversity is found when dealing with the immediacy of citation, weighting citing
journals influence or broadening the data source; for instance, the Giessen University (Germany),
the Texas A&M University (USA), the University of Groningen (Netherlands), and the
University of Calgary (Canada) arise within the institutions publishing quickly cited research, the
Hong Kong University of Sciences and Technology (Hong Kong), the Boston College (USA),
and the University of Maryland (USA) remain within the top-10 when citing journals are
weighted; and the Vienna University of Economics and Business (Austria) and the INSEAD
(France) arise among the top-10 when the citing database is broader. Some academic institutions
clearly improve their position when the analysis focuses only on the last sub-period of study, that
is on JCR-5 (e.g.: Uppsala University-Sweden, the University of North Carolina-USA); while
others (e.g. the University of Pennsylvania-USA) are among the top-10 in JCR and JCRws, but
Table 5. Most productive institutions based on journals performance
JCR JCR-im JCR-wsc EgS AI SJR SNIP IPP JCR-5*
U. Miami 18.95 U. Miami 3.07 U. Miami 16.42 U. Miami 0.10 U. Miami 19.07 U. Miami 30.01 U. Miami 20.98 U. Miami 25.33 Erasmus U.
Rotterdam 15.18 Erasmus U. Rotterdam 11.41 U. Giessen 2.50 Erasmus U. Rotterdam 9.02 Hong Kong U. S&T. 0.03 Erasmus U. Rotterdam 5.79 Erasmus U. Rotterdam 13.53 Erasmus U. Rotterdam 12.06 Erasmus U.
Rotterdam 17.98 Hanken S.E. 12.79 WHU – Otto Beisheim S.M. 9.74 WHU – Otto Beisheim S.M. 2.44 WHU – Otto Beisheim S.M. 8.10 Rutgers U. 0.03 WHU – Otto
Beisheim S.M. 5.11 Hanken S.E. 8.66
WHU – Otto Beisheim S.M. 7.82 WHU – Otto Beisheim S.M. 12.03 WHU – Otto Beisheim S.M. 12.36 Hanken S.E. 9.70 Hanken S.E. 1.85 Hanken S.E. 8.05 U. Maryland 0.03 U. Maryland 4.54 Tilburg U. 8.55 Hanken S.E. 7.26 Hanken S.E. 11.79 Tilburg U. 9.18 Tilburg U. 7.41 Erasmus U.
Rotterdam 1.54 Tilburg U. 5.79
Erasmus U.
Rotterdam 0.03 Boston College 4.25
WHU – Otto
Beisheim S.M. 8.50 Tilburg U. 6.75 Tilburg U. 10.16 Uppsala U. 8.23 Rutgers U. 7.10 U. London 1.24 Rutgers U. 5.43 Boston College 0.03 Hanken S.E. 4.15 Rutgers U. 8.48 U. London 6.65 U. London 9.12 Texas A&M U. 7.86 U. London 6.75 Texas A&M U. 1.16 U. London 5.12 INSEAD 0.02 Rutgers U. 4.08 U. Maryland 8.12 Rutgers U. 6.24 Texas A&M U. 8.82 U. North Carolina 7.57 U. Groningen 6.31 U. Groningen 1.12 Boston College 4.97 WHU – Otto
Beisheim S.M. 0.02
Hong Kong U.
S&T. 4.03 Texas A&M U. 8.04 Texas A&M U. 6.05 Rutgers U. 8.77 U. Maryland 7.50 U.
Pennsylvania 6.28 U. Calgary 1.02 INSEAD 4.96 Texas A&M U. 0.02 Texas A&M U. 3.78 U. London 7.88
Vienna U. E&B Administration 5.91
Vienna U. E&B
Administration 8.47 Boston College 7.11 INSEAD 6.12 Tilburg U. 1.00 U.
Pennsylvania 4.76 Hanken S.E. 0.02 Tilburg U. 3.69 Boston College 7.75 INSEAD 5.50 INSEAD 8.00 U. Groningen 7.07 Uppsala U. 6.00 INSEAD 0.99 Vienna U. E&B
Administration 4.69 U.
Pennsylvania 0.02 INSEAD 3.32 INSEAD 7.41
U. Texas at
Dallas 5.18 Uppsala U. 7.42 U. Miami 7.06 Vienna U. E&B
Administration 5.62 U.
Pennsylvania 0.98 U. Groningen 4.61 Ohaio State U. 0.02 U. London 3.21
Hong Kong U.
S&T. 7.04 Uppsala U. 4.75
U. Texas at
Dallas 7.36 Georgia State U. 7.02 Texas A&M U. 5.58
U. North Carolina at Greensboro
0.95 Texas A&M U. 4.49 Tilburg U. 0.02 Ohaio State U. 3.09 Vienna U. E&B
Administration 6.96 U. Sheffield 4.54 U. Sheffield 7.02
Hong Kong Polytechnic U.
6.96 Boston College 5.42 Rutgers U. 0.93 Uppsala U. 4.19 U. London 0.02 U.
Pennsylvania 3.02 U. Pennsylvania 6.45 U.
Pennsylvania 4.45 U. Groningen 6.96 U. London 6.94 U. Giessen 5.14 U. New South
Wales 0.88 U. Giessen 4.10 U. Amsterdam 0.02
Vienna U. E&B Administration 2.85 U. Texas at Dallas 6.43 Hong Kong U. S&T. 4.34 U. Pennsylvania 6.90 Southern New Hampshire U. 6.92 Georgia State U. 5.03 VU U.
Amsterdam 0.80 Ohaio State U. 4.05
U. Texas at
Dallas 0.02 U. Sheffield 2.85 Ohio State U. 5.90
U. North
Carolina 4.14
U. North
Carolina 6.72 Indiana U. 6.59 Southern New
Hampshire U. 4.55 U. Amsterdam 0.79 U. Maryland 3.78 U. Groningen 0.01 U. Groningen 2.62
U. North Carolina 5.56 Hong Kong Polytechnic U. 4.07 U. New South Wales 6.31 U. Leeds 6.54 U. Leeds 4.48 Uppsala U. 0.77 Hong Kong U.
S&T. 3.50 U. Giessen 0.01 U. Amsterdam 2.56 U. Groningen 5.38 U. Groningen 4.04
Hong Kong
Polytechnic U. 6.03 U. Pennsylvania 6.38 Ohaio State U. 4.46 Vienna U. E&B
Administration 0.76 Georgia State U. 3.48 U. New South Wales 0.01 U. Texas at
Dallas 2.45 Uppsala U. 5.36 Ohio State U. 3.98
Georgia State
U. 5.72 U. Giessen 6.24 U. North
Carolina at Greensboro
4.43 Ohaio State U. 0.74 U. Sheffield 3.48 U. Texas at Austin 0.01
Hong Kong Polytechnic U. 2.35
U. New South
Wales 5.29 Boston College 3.97 U. Giessen 5.70 INSEAD
5.98 U. New South Wales 4.43 U. Sheffield 0.70 U. North Carolina at Greensboro 3.48 Pennsylvania
State U. 0.01 U. Giessen 2.34 U. Sheffield 4.98
U. New South
Wales 3.88 Boston College 5.55 Rutgers U.
5.95 U. Sheffield 4.41 U. T. Sydney 0.67 U. New South
Wales 3.40 Arizona State U. 0.01 Uppsala U. 2.25 U. Texas at Austin 4.75 U. the West of
England 3.79 U. Maryland 5.52 U. New South Wales 5.92 Indiana U. 4.34 Georgia State U. 0.64 Hong Kong Polytechnic U. 3.30 Uppsala U. 0.01 U. Arizona State 2.25 Pennsylvania State U. 4.67 U. Maryland 3.78 U. Leeds 5.43 U. Texas at Dallas 5.92 Hong Kong
Polytechnic U. 4.32 Boston College 0.62
U. Texas at Dallas 3.11
Chinese U.
Hong Kong 0.01
Georgia State
U. 2.16 Arizona State U. 4.57 U. Leeds 3.70
Hong Kong U. S&T. 5.31 U. Manchester 5.21 U. Manchester 4.25 National Chengchi U. 0.60 U. Amsterdam 3.09 Vienna U. E&B Administration 0.01 U. Texas at Austin 2.14 Hong Kong Polytechnic U. 4.55 Georgia State
U. 3.67 U. Amsterdam 5.24 Ohaio State U. 5.02 National Chengchi U. 4.16 U. the West of England 0.59 U. Manchester 3.08 U. North Carolina at Greensboro 0.01 U. New South
Wales 2.11 Georgia State U. 4.50 U. Giessen 3.66 Ohio State U. 5.22 Florida State U.
JCR JCR-im JCR-wsc EgS AI SJR SNIP IPP JCR-5*
U. Maryland 4.15 U. Manchester 0.58 National
Chengchi U. 3.02 Georgia State U. 0.01 Pennsylvania State U. 2.09 U. Amsterdam 4.50 Michigan State U. 3.65 U. Manchester 5.03 National Chengchi U. 4.16 U. Amsterdam 4.12 U. Texas at
Dallas 0.57 U. Leeds 2.96 U. Iowa 0.01
Chinese U.
Hong Kong 2.00 U. Giessen 4.42
U. South Carolina 3.57 Southern New Hampshire U. 4.94 U. Newcastle 4.06 Hong Kong U. S&T. 3.97 Loughborough U. 0.54 Southern New Hampshire U. 2.95 Nottingham U. B.S. China 0.01 U. Washington 1.89 Southern New Hampshire U. 4.13 U. Amsterdam 3.42 National Chengchi U. 4.71 Pennsylvania State U. 3.98 U. Texas at Dallas 3.63 U. Maryland 0.53 Arizona State U. 2.85 Southern New
Hampshire U. 0.01 U. Melbourne 1.88 Indiana U. 3.93
Southern New
Hampshire U. 3.35 Indiana U. 4.71 U. Texas at Austin 3.98 Michigan State U. 3.37 U. Sydney 0.53 U. Texas at Austin 2.85 National U. Singapore 0.01 U. North Carolina at Greensboro 1.81 U. Leeds 3.76 Chinese U. Hong Kong 3.22 U. the West of England 4.61 Korea U. 3.93 Florida State U. 3.21 Ryerson U. 0.52 Indiana U. 2.81 Indiana U. 0.01 Southern New
Hampshire U. 1.80 U. Manchester 3.55 Indiana U. 3.19
Pennsylvania State U. 4.57 Loughborough U. 3.91 U. Texas at Austin 3.17 U. Utah 0.51 Pennsylvania State U. 2.77 Hong Kong Polytechnic U. 0.01 U. South Carolina 1.76 U. South Carolina 3.32 U. Melbourne 3.19 U. South Carolina 4.57 Nanyang T. U. 3.67 U. Melbourne 3.16 U. Leeds 0.50 Michigan State
U. 2.69 U. Washington 0.01 U. Oklahoma 1.75 U. the West of England 3.27 U. Texas at Austin 3.17 U. Texas at
Austin 4.47 Arizona State U. 3.55 Arizona State
U. 3.12 Nanyang T. U. 0.48
U. the West of England 2.49
U. the West of
England 0.01 Indiana U. 1.71 Cardiff U. 3.18
Pennsylvania State U. 3.12 U. Melbourne 4.38 Singapore Management U. 3.51 Pennsylvania State U. 3.08 Southern New Hampshire U. 0.47 U. South Carolina 2.37 École de Management de Lyon 0.01 U. Vaasa 1.68 National Chengchi U. 3.15 U. Oklahoma 3.07 Michigan State U. 4.32 Gothenburg U. 3.30 U. the West of England 3.01 Singapore
Management U. 0.46 U. Vaasa 2.20 York U. 0.01 U. Leeds 1.68
Michigan State
U. 3.12 Cardiff U. 3.03 U. Newcastle 4.02 Vienna U. E&B 3.29 U. Vaasa 2.93 Pennsylvania
State U. 0.46 Florida State U. 2.13
U. South
Carolina 0.01 U. Manchester 1.64 Korea U. 3.10 Ben-Gurion U. 3.02 Cardiff U. 3.88 Kühne Logistics U. 3.28 U. South
Carolina 2.80
Michigan State
U. 0.46 U. Melbourne 2.11 Korea U. 0.01 Korea U. 1.58 Tel Aviv U. 3.06 U. Manchester 3.00
Nottingham U.
B.S. China 3.81 IMD 3.03 Nanyang T. U. 2.77 Indiana U. 0.45 U. Calgary 2.09 U. Leeds 0.01 Michigan State
U. 1.55 U. Melbourne 3.04
Kent State
Univerity 2.99 U. Vaasa 3.76 U. T. Sydney 2.99 *Only for articles published from 2007 to 2012.
The prominent position of European institutions and the scarce presence of Asia-Pacific
institutions must again be acknowledged. As it was the case for prolific institutions, our results
are not in line with existing analyses relative to the entire IB field —see, for instance, Treviño et
al. (2010). It seems that academic institutions coming from the Asia-Pacific play (or are expected
to play) a key role within IB research and agenda, but not in the particular area dealing with the
role of NC/CD in IB decisions.
CITATION ANALYSIS
Understanding what are the key approaches which drive a research field requires observing the influence of the published research, i.e. the most cited works. While the most prolific authors are recognized for producing high quality research, the most influential pieces of research may be authored by less prolific authors (for an example see Pinto et al. (2014). Thus it is important to analyze the citations each paper has received since any citation included in an article reflects some influence on the author’s results and/or perspective, posited as an explicit recognition of an intellectual debt (Kochen, 1987). Even assuming the list of reasons for citing a work is extensive, and some negative reasons exist within this list, citations provide a formalized account of the information use and can be taken as a strong indicator of the work’s reception by colleagues (Glänzel and Schoepflin, 1999). Therefore we use citation analysis as an objective way to measure the contributions of articles, and has previously been used to assess the influence not only of articles but also individuals, institutions, and journals to a particular field of knowledge – see, for instance, Acedo and Casillas (2005), Chandy and Williams, 1994; Li and Tsui (2002), Peng and Zhou (2006), Quer et al. (2007).
An analysis of the most influential works
In order to assess the actual impact of the articles gathered in our database, we conducted a
citation analysis up to 31 December 2015 using the Scopus database. Citations were not counted
for articles published in journals not included in this database for some particular years12, so that
we finally measured citation for 256 articles that gathered a total of 9,430 cites (8,821 excluding
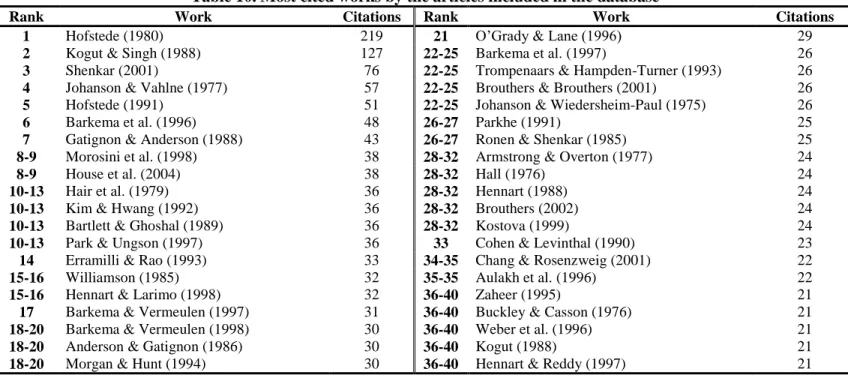
self-citation), an average of more than 36/34 cites per article. Table 6 reports the list of 55
articles with at least 50 cites. Although we have provided at least a three-year period for articles
to be cited, it must be acknowledged that this analysis does not do full justice to articles
published in most recent years: no article published in 2012 is in this list and only one article
published in 2011 is among the most cited ones (Crossland and Hambrick, 2011). In order to take
into account this bias we have considered also a relative citation ratio (i.e.: the ratio of citations
per year, considering the number of years since the article was published).
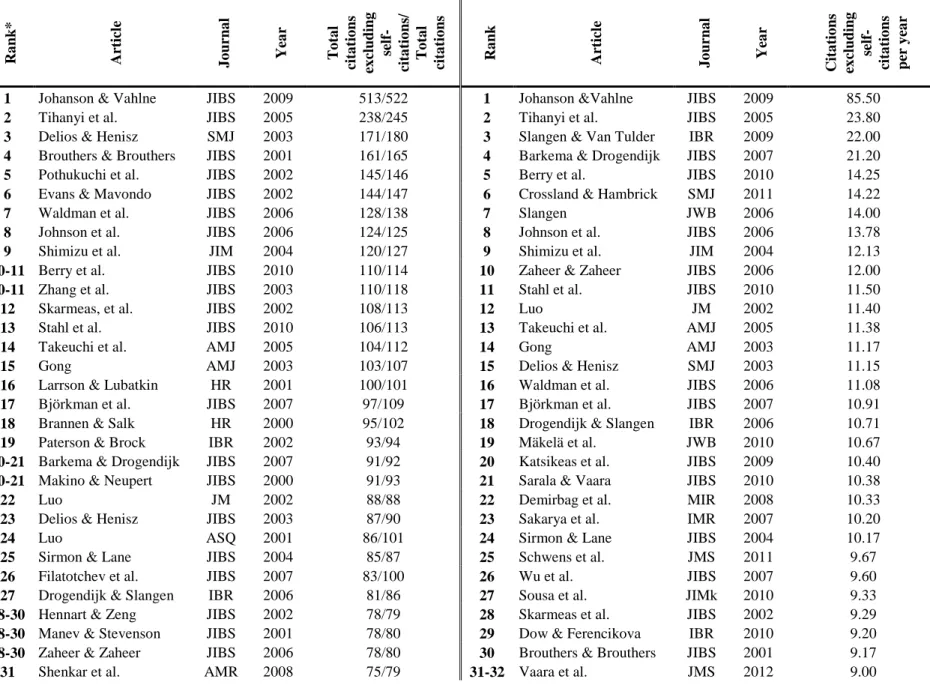
Table 6. Most cited articles Ra nk * Art icle J o urna l Yea r T o ta l cit a tio ns ex cludi ng self -cit a tio ns / T o ta l cit a tio ns Ra nk Art icle J o urna l Yea r Cit a tio ns ex cludi ng self -cit a tio ns per y ea r
1 Johanson & Vahlne JIBS 2009 513/522 1 Johanson &Vahlne JIBS 2009 85.50 2 Tihanyi et al. JIBS 2005 238/245 2 Tihanyi et al. JIBS 2005 23.80 3 Delios & Henisz SMJ 2003 171/180 3 Slangen & Van Tulder IBR 2009 22.00 4 Brouthers & Brouthers JIBS 2001 161/165 4 Barkema & Drogendijk JIBS 2007 21.20 5 Pothukuchi et al. JIBS 2002 145/146 5 Berry et al. JIBS 2010 14.25 6 Evans & Mavondo JIBS 2002 144/147 6 Crossland & Hambrick SMJ 2011 14.22
7 Waldman et al. JIBS 2006 128/138 7 Slangen JWB 2006 14.00
8 Johnson et al. JIBS 2006 124/125 8 Johnson et al. JIBS 2006 13.78 9 Shimizu et al. JIM 2004 120/127 9 Shimizu et al. JIM 2004 12.13 10-11 Berry et al. JIBS 2010 110/114 10 Zaheer & Zaheer JIBS 2006 12.00 10-11 Zhang et al. JIBS 2003 110/118 11 Stahl et al. JIBS 2010 11.50
12 Skarmeas, et al. JIBS 2002 108/113 12 Luo JM 2002 11.40
13 Stahl et al. JIBS 2010 106/113 13 Takeuchi et al. AMJ 2005 11.38
14 Takeuchi et al. AMJ 2005 104/112 14 Gong AMJ 2003 11.17
15 Gong AMJ 2003 103/107 15 Delios & Henisz SMJ 2003 11.15 16 Larrson & Lubatkin HR 2001 100/101 16 Waldman et al. JIBS 2006 11.08 17 Björkman et al. JIBS 2007 97/109 17 Björkman et al. JIBS 2007 10.91 18 Brannen & Salk HR 2000 95/102 18 Drogendijk & Slangen IBR 2006 10.71 19 Paterson & Brock IBR 2002 93/94 19 Mäkelä et al. JWB 2010 10.67 20-21 Barkema & Drogendijk JIBS 2007 91/92 20 Katsikeas et al. JIBS 2009 10.40 20-21 Makino & Neupert JIBS 2000 91/93 21 Sarala & Vaara JIBS 2010 10.38
22 Luo JM 2002 88/88 22 Demirbag et al. MIR 2008 10.33
23 Delios & Henisz JIBS 2003 87/90 23 Sakarya et al. IMR 2007 10.20
24 Luo ASQ 2001 86/101 24 Sirmon & Lane JIBS 2004 10.17
25 Sirmon & Lane JIBS 2004 85/87 25 Schwens et al. JMS 2011 9.67 26 Filatotchev et al. JIBS 2007 83/100 26 Wu et al. JIBS 2007 9.60 27 Drogendijk & Slangen IBR 2006 81/86 27 Sousa et al. JIMk 2010 9.33 28-30 Hennart & Zeng JIBS 2002 78/79 28 Skarmeas et al. JIBS 2002 9.29 28-30 Manev & Stevenson JIBS 2001 78/80 29 Dow & Ferencikova IBR 2010 9.20 28-30 Zaheer & Zaheer JIBS 2006 78/80 30 Brouthers & Brouthers JIBS 2001 9.17 31 Shenkar et al. AMR 2008 75/79 31-32 Vaara et al. JMS 2012 9.00
Ra nk * Art icle J o urna l Yea r T o ta l cit a tio ns ex cludi ng self -cit a tio ns / T o ta l cit a tio ns Ra nk Art icle J o urna l Yea r Cit a tio ns ex cludi ng self -cit a tio ns per y ea r
32-33 Blomstermo et al. IMR 2006 72/72 31-32 Luo AMJ 2005 9.00
32-33 Slangen & Van Tulder IBR 2009 72/75 33 Zhang et al. JIBS 2003 8.67 34-36 Katsikeas et al. JIBS 2009 67/72 34 Pothukuchi et al. JIBS 2002 8.58
34-36 Li et al. JIBS 2001 67/76 35-36 Jean et al. JIMk 2010 8.40
34-36 Van Vianen et al. AMJ 2004 67/69 35-36 Brock et al. JIBS 2008 8.40
37 Ellis JIBS 2008 65/66 37 Chen et al. AMJ 2010 8.31
38-40 Ferner et al. JWB 2001 64/67 38-40 Dow & Larimo JIMk 2009 8.00
38-40 Luo AMJ 2005 64/70 38-40 Makino & Neupert JIBS 2000 8.00
38-40 Reus & Lamont JIBS 2009 64/67 38-40 Hutzschenreuter &Voll JIBS 2008 8.00 41 Ambos & Ambos JIM 2009 61/64 41 Chakrabarti et al. JIBS 2009 7.73 42 Slangen JWB 2006 60/61 42 Stahl & Caligiuri JAP 2005 7.60 43-45 Evans et al. IMR 2000 59/60 43 Delios & Henisz JIBS 2003 7.38 43-45 Tong & Reuer JIBS 2007 59/64 44 Morschett et al. JIM 2010 7.25
43-45 Uhlenbruc JIBS 2004 59/59 45 Reus & Lamont JIBS 2009 7.15
46-48 Arora & Fosfuri JIBS 2000 58/59 46 Evans & Mavondo JIBS 2002 7.14 46-48 Chakrabarti et al. JIBS 2009 58/60 47 Arora & Fosfuri JIBS 2000 7.00
46-48 Vaara et al. HR 2003 58/63 48 Demirbag et al. JWB 2007 6.86
49 Chen et al. AMJ 2010 57/57 49 Campbell et al. JIBS 2012 6.77 50-51 Crossland & Hambrick SMJ 2011 56/59 50 Hartmann et al. JWB 2010 6.67 50-51 Griffith et al. JIBS 2000 56/64 51 Chari & Chang JIBS 2009 6.57 52-53 Dow & Larimo JIMk 2009 54/57 52 Aybar& Ficici JIBS 2009 6.40 52-53 Schlegelmilch & Chini IBR 2003 54/54 53 Shenkar et al. AMR 2008 6.33 54 Stahl & Caligiuri JAP 2005 52/53 54 Ambos & Ambos JIM 2009 6.14 55 Morschett et al. JIM 2010 51/53 55 Van Vianen et al. AMJ 2004 6.13 *Ranked by total number of citation, excluded self-citations.
Observing Table 6 we may identify some particularly recent articles are among the most cited ones in relative terms. The subjects of the most recent papers are rather mixed, but we may identify a growing interest in the institutional approach. For instance, Crossland and Hambrick’s (2011) study on the influence of formal and informal national institutions on managerial discretion of CEOs; Schwens et al.’s (2011) study of the influence of formal and informal institutions in the choice of entry mode by small and medium size firms; and Berry et al.’s (2010) proposal of a multidimensional measure of institutional distance. Other recent articles which are highly influential include papers which focus on psychic distance (e.g. Dow and Ferencikova, 2010; Dow and Larimo, 2009) which is includes national cultural differences but also other national-level differences (Johanson and Vahlne, 1977). More recently published articles which are gaining quick influence, specifically Campbell et al. (2012) —an analysis of the influence of CD in multinationals corporate social responsibility activities— and Vaara et al. (2012) —a study on the impact of organizational and national cultural differences on social conflict and knowledge transfer in international acquisitions, address other host-country dimensions which are posited to influence firms’ operations abroad. These articles are not among the most cited ones in absolute terms; however, their high relative citation ratio points to an expected high influence in the near future. Therefore we may identify a growing influence of research addressing the multiple challenges of international business environment which go beyond national cultural differences.
Although one of the most common criticism placed on citation analysis is the unequal frequency
of citation of conceptual and empirical articles (Chandy and Williams. 1994; Harzing, 2002), the
percentage of conceptual articles within this selected list —18%— is not too far from the
is worth nothing that this percentage raises to 27% when focusing on the top-10 most cited
articles. Among these it is the most cited article within the database: the piece of research by
Johanson and Vahlne (2009) aimed at revisiting the Uppsala internationalization model in the
light of new business practices and recent theoretical advances (over 500 citations in just 6
years). Johnson et al. (2006) —an article that develops a model of cross cultural competences to
be applied in international business and international human resource management— and
Shimizu et al. (2004) —an analysis of cross border mergers and acquisitions as entry mode in
foreign markets, dynamic learning process from a foreign culture, and value creating strategy—
are the other two conceptual articles within the top-10 list.
One third of the top-10 most cited articles deal with foreign direct investments: the meta-analysis
by Tihanyi et al. (2005) focused on the impact of CD on entry mode choice and performance, the
study by Brouthers and Brouthers (2001) centered on the role played by the interaction between
CD and host country risk on the choice between wholly owned subsidiaries and joint ventures, and Delios and Henisz’s (2003b) study aimed at extending the sequential model of
internationalization by incorporating the policy environment as a source of uncertainty to a firm
whose relevance can be similar to that of cultural and social environment. There is only one work
related to international alliances within this top-10 list: Pothukuchi et al.’s (2002) study centered
on the analysis of national and organizational culture differences on international joint ventures
performance. The articles by Evans and Mavondo (2002) —an exploration of a comprehensive
measure of psychic distance and its influence in organizational performance—, Waldman et al.
(2006) —an analysis of the cultural and leadership variables associated with corporate social
responsibility values—, Berry et al. (2010) —a proposal of a multidimensional measure of cross
and Zhang et al. (2003) —a study of the influence of cultural an country differences on relational
norms and trust-building activities between cuyers and sellers— complete the top-10 list of most
cited articles.
An analysis of the most influential authors and institutions
A total of 120 authors and 80 academic institutions13 are involved in the most cited articles
gathered in Table 6. From this list we selected the top 25-most-cited authors by estimating
cumulative cites based on these 55 articles (actually 28 authors, as 4 different scholars share the
25th position; see Table 7).
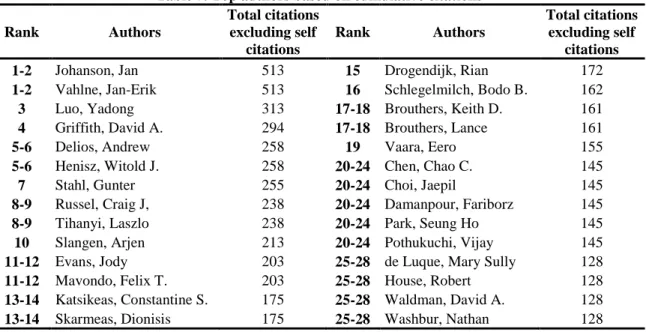
Table 7. Top authors based on cumulative citations Rank Authors Total citations excluding self citations Rank Authors Total citations excluding self citations 1-2 Johanson, Jan 513 15 Drogendijk, Rian 172 1-2 Vahlne, Jan-Erik 513 16 Schlegelmilch, Bodo B. 162 3 Luo, Yadong 313 17-18 Brouthers, Keith D. 161 4 Griffith, David A. 294 17-18 Brouthers, Lance 161
5-6 Delios, Andrew 258 19 Vaara, Eero 155
5-6 Henisz, Witold J. 258 20-24 Chen, Chao C. 145 7 Stahl, Gunter 255 20-24 Choi, Jaepil 145 8-9 Russel, Craig J, 238 20-24 Damanpour, Fariborz 145 8-9 Tihanyi, Laszlo 238 20-24 Park, Seung Ho 145 10 Slangen, Arjen 213 20-24 Pothukuchi, Vijay 145 11-12 Evans, Jody 203 25-28 de Luque, Mary Sully 128 11-12 Mavondo, Felix T. 203 25-28 House, Robert 128 13-14 Katsikeas, Constantine S. 175 25-28 Waldman, David A. 128 13-14 Skarmeas, Dionisis 175 25-28 Washbur, Nathan 128
As shown in Li and Tsui (2002), this is a conservative estimate of the impact of these authors’
work, as we did not include in this cumulative counter other articles they published that did not
survive the selected cutoff of 50 citations. Table 7 shows that Johanson and Vahlne are the only
authors with over 500 citations of their work, Luo has more than 300 citations, and 9 different
13The article by Waldman et al. (2006) has 4 main authors and 37 additional collaborators. Only the main authors and their respective institutions have been included in this ranking.
authors gather more than 200 citations (Griffith, Delios, Henisz, Stahl, Russel, Tihanyi, Slangen,
Evans, and Mavondo). It is noteworthy to point that Johanson and Vahlne have only one article
(co-authored by both of them) within this selected list, so that their clear prominent position is
exclusively due to this particular piece of research. Following Xu et al. (2008), we have gathered
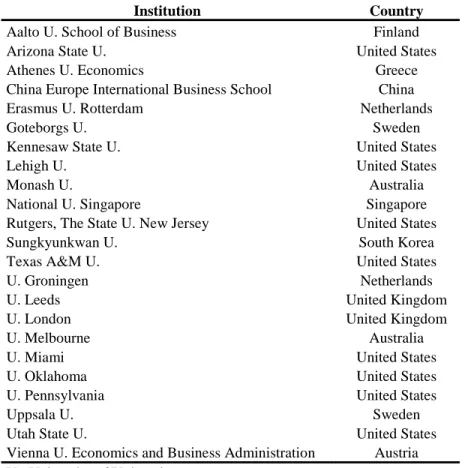
Table 8. Institutions currently hosting the most cited authors
Institution Country
Aalto U. School of Business Finland
Arizona State U. United States
Athenes U. Economics Greece
China Europe International Business School China Erasmus U. Rotterdam Netherlands
Goteborgs U. Sweden
Kennesaw State U. United States
Lehigh U. United States
Monash U. Australia
National U. Singapore Singapore
Rutgers, The State U. New Jersey United States
Sungkyunkwan U. South Korea
Texas A&M U. United States
U. Groningen Netherlands
U. Leeds United Kingdom
U. London United Kingdom
U. Melbourne Australia
U. Miami United States
U. Oklahoma United States
U. Pennsylvania United States
Uppsala U. Sweden
Utah State U. United States
Vienna U. Economics and Business Administration Austria U.: University of/University
It is to be expected that the institutions where these scholars are currently working hold
considerable influence on the research field in the near future. As we can see in the table, it may
be expected that some institutions that are not currently in top positions within the
volume/productivity/citation rankings emerge and/or improve their positioning. We may identify
European (e.g.: Aalto University-Finland, Athens University of Economics and Business-Greece,
University of Groningen-Netherlands, Göteborgs University-Sweden), US (e.g.: Kennesaw State
University, Lehigh University, Utah State University) and Asia-Pacific institutions (e.g.: China
Europe International Business School-China, National University of Singapore-Singapore,
pattern shows a balanced distribution among European and North American institutions, as well
as a slight increase in the weight of academic institutions coming from the Asia-Pacific region.
SCIENTIFIC COLLABORATION
The study of collaboration trends informs about the relevance of research teams and networks, as
well as about the relevance of different kinds of collaborative research (intramural, national, and
international). Less than 20% of the 265 articles are single-authored. This result points to the
relevance of team-projects and networks of scholars that facilitate access to resources (i.e.:
expertise, new skills, equipment, funds), increase efficiency, allow tackling “bigger” problems or
challenges, and/or improve scholars’ prestige and visibility (Beaver, 2001). This particularly high
rate of co-authored articles is consistent with the publication trends already pointed by Inkpen
and Beamish (1994) and Floyd et al. (1994) in IB and Management journals respectively. As
shown in both studies, the publication pattern has consistently evolved towards collaborative
research. Furthermore, this tendency is not exclusive of the business and management fields, as
scientific collaboration –as measured by means of co-authorship patterns– has considerably
increased during the last decades at all levels of aggregation in a wide range of scientific fields
(Glänzel, 2001).
Our analysis points to a particularly high number of multi-authored articles (more than 42% of
the articles are co-authored by 3 or more researchers). This publication pattern points to the
relevance of participating in large research teams or networks in order to achieve publishing in
the top-tier journals analyzed in this study. This pattern can be related to the low rate of exclusive
intramural collaborative research (collaboration among authors working at the same academic
Conversely, up to 41.5% of total articles and 50% of co-authored articles reflect international
collaboration (i.e.: the authors’ institutional affiliation includes more than one country). Both the
increase of the density of the networks and the intensification of international collaboration are
patterns also identified in different studies related to other research fields (Glänzel, 2001), but
scarcely explored in the IB and Management fields. A cross-tab analysis of the international
collaboration ratio in the articles gathered in the database and the year/journal International
Collaboration ratios provided by Scopus for the selected list of journals searched in this study
shows that the presence of international collaboration within this research area is higher than
average.
In order to analyze the potential influence of international collaboration on scholars’ productivity
as measured by journal impact factors, we divided the database in two sub-samples based on
presence/absence of international collaboration. We then performed a mean difference analysis
for each of the 9 journal metrics mentioned before. No statistical differences have been found.
Therefore, our study does not show a positive effect of international collaboration on achieving
journals with higher impact factors. Conversely, international collaboration seems to play a
positive influence on articles actual impact as measured by number of citations: the percentage of
articles showing an international co-authorship pattern raises to 52% among the most cited
articles.
ANALYSIS OF THE KNOWLEDGE BASE
The analysis of the knowledge base studies the bibliographic references included in the set of
researched articles in order to identify not only the most relevant individual references, but also
As a first step, it examines the bibliographic references cited in research documents as an
indicator of the sources of information used and the approaches connected or integrated in their
work (Garfield, 1979; Kochen, 1987; Smith, 1981). Therefore, this analysis allows identifying
the works that have exerted the highest influence on the perspectives, development, and results of
the articles being studied. It bases on the same assumption as the citation analysis —a work cited
more often is more influential to a given field—, but as a reverse process as it analyzes the works
that have been cited by the articles included in the database.
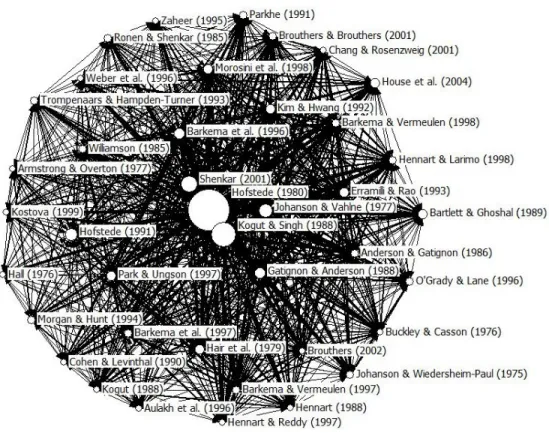
As a second step and in order to examine potential interrelations, we also computed the number
of times that two documents appear jointly cited (i.e.: co-citation analysis). This allows
identifying clusters of related documents and their potential interrelation. Clusters are formed by
selecting all papers that can be linked together by a specified joint-use threshold. This analysis
explores the research fronts of the field under study; that is, the groups of highly cited and
interrelated papers referred to as core papers in the field. It is worth noting that although the
works within a specific research front address the same questions, they do not necessarily have to
share the same perspective or agree with each other. This is a technique used widely to identify
the structure of knowledge in different fields of study —see Acedo and Casillas (2005) and
Dagnino et al. (2015) for exhaustive reviews.
To perform these analyses we retrieved the relevant meta-information (Zupic and Cater, 2014)
from the 265 articles in our sample, including the 18,593 unique references (averaging 70.2 per
article). We examined all the references to consolidate any duplicate versions, misspellings of the authors’ names or inconsistencies of the volumes or page numbers. We also consolidated every