Tese de Mestrado
Mestrado em Biologia Molecular, Biotecnologia
e Bioempreendedorismo em Plantas
Trabalho efetuado sob a orientação de
Professora Doutora Maria Teresa Correia Guedes Lino Neto
Professora Doutora Paula Cristina dos Santos Baptista
Abril, 2015
Ângela Moreira Soares
Saprotrophic fungi
Hypholoma fasciculare
effect on
the fungal community associated to
Castanea sativa
ii Nome: Ângela Moreira Soares
Endereço eletrónico: soaresm.angela@gmail.com Telefone: +351 913 671 173
Nº Cartão Cidadão: 13954673
Título da Tese de Mestrado:
Saprotrophic fungi Hypholoma fasciculare effect on the fungal community associated to Castanea sativa
Orientadores:
Professora Doutora Maria Teresa Correia Guedes Lino Neto Professora Doutora Paula Cristina dos Santos Baptista
Ano de Conclusão: 2015 Designação do Mestrado:
Mestrado em Biologia Molecular, Biotecnologia e Bioempreendedorismo em Plantas
DE ACORDO COM A LEGISLAÇÃO EM VIGOR, NÃO É PERMITIDA A REPRODUÇÃO DE QUALQUER PARTE DESTA TESE
Universidade do Minho, 30 de Abril de 2015 Assinatura:___________________________
iii Muitas foram as pessoas que, das mais variadas formas, contribuíram para a elaboração deste projeto, às quais quero manifestar a minha gratidão.
À Professora Teresa Lino Neto, gostaria em primeiro lugar agradecer por ter aceite ser minha orientadora. E mostrar o meu total reconhecimento pelos ensinamentos e conselhos, estímulos e empenho na minha evolução científica, assim como o rigor e organização científica transmitida. Obrigada ainda pelas suas palavras de apreço e encorajamento, e ainda pela compreensão e ajuda ao longo deste meu percurso académico.
À Professora Paula Baptista, pela disponibilidade total, por toda a sua atenção e incentivo para a minha progressão. Pelos conselhos, críticas e rigor transmitidos nesta experiência.
À Francisca por toda a sua disponibilidade, ajuda e amabilidade em todo o trabalho, bem como pelo precioso tempo dispendido comigo.
Aos amigos que nunca descuidaram, que apesar de toda a distância estiveram sempre presentes. Por toda amizade, boa disposição e disponibilidade interminável. Pela constante presença no meu quotidiano e pela força que sempre me transmitiram.
Ao Ricardo, pela sua presença. Por simplificar e reconhecer as palavras e gestos certos nas mais variadas situações, pela lição de vida, valores e energia dada sem condições em troca. O mais sincero obrigada pelo seu significado.
Ao Igor, pela força, coragem e loucura de todos os dias. Pelos valores e sonhos que tão orgulhosamente me transmitiu, desde as brincadeiras de criança até aos desafios atuais.
E em especial, à minha Mãe. Não há palavras para descrever o seu apoio incondicional e altruísmo excessivo. Agradeço pelo exemplo de força e de luta constante, perante as adversidades; e de alegria e sorrisos após cada batalha. Sem ela não teria conseguido.
iv
associated to
Castanea sativa
ABSTRACT
The European chestnut (Castanea sativa) is a plant species with eminent importance, due to the high gastronomic value attributed to its fruit, as well as for being a high quality wood source. Associated to the chestnut orchards soils of the region of Trás-os-Montes (Bragança, Portugal) is commonly found the saprotrophic fungi, Hypholoma fasciculare. Some preliminary studies have suggested that the presence of this fungus in the soil can damage chestnut trees and reshape the soil microbial community, due to the strong antagonist activity that H. fasciculare displays against soil-borne fungi from orchard. In order to acknowledge the effect of H. fasciculare in soil fungal community, a metabarcoding project was performed by pyrosequencing the ITS1 barcodes of DNA obtained from different soil samples. Chestnut orchard soil was collected and used for chestnut plant growing. Two months after transplantation, plants were inoculated with H. fasciculare, being harvested after six-months or one-year upon inoculation. As controls, non-inoculated plants were used. In order to study the effect of the well-established fungal community on H. fasciculare constraints, sterile orchard soils were use in a parallel assay.
In this study, 458 OTUs (operational taxonomic units) were identified comprising 78,029 reads. The richest phylum was the Ascomycota (58.9%), followed by the Basidiomycota (38.9%). However, the Basidiomycota was the most abundant phylum (57.4%), followed by the Ascomycota (40.9%). In order to evaluate the habitat quality, alpha and beta diversity were evaluated, which allowed to determine the richness in species within each soil sample and the species turnover between conditions, respectively. Sterile soil samples were less rich and diverse than non-sterile soil samples, but non-sterile soil samples were more homogeneous among them. The variation of functional groups of the most well-represented OTUs was also analyzed, being the parasites the most rich and abundant, followed by saprotrophic and mycorrhizal functional groups. Correlations between functional groups were also computed and the most positive correlation was found between saprotrophs and parasites. At the end, a clear effect of H. fasciculare was not detected, although specific microbial interactions could have taken place. The use of sterile soils allowed the recognition of a buffering-like effect, in which microbial community is not so easily affected in its equilibrium, neither by the fungal inoculation nor by the chestnut growing. This effect could be of major importance from the agronomic point of view.
v ecological; diversity; fungal community
vi
associada a
Castanea sativa
RESUMO
O castanheiro europeu (Castanea sativa) é uma espécie com notória importância, devido ao elevado valor gastronómico atribuído ao seu fruto, bem como pela elevada qualidade da sua madeira. Associados aos soutos da região de Trás-os-Montes (Bragança, Portugal) encontra-se frequentemente o macrofungo saprófita Hypholoma fasciculare. Alguns estudos preliminares sugeriram que a presença deste fungo no solo poderia causar sérios danos aos castanheiros e remodelar a comunidade microbiana do solo, devido à elevada atividade antagonista que apresenta contra fungos presentes nos solos dos soutos. De modo a reconhecer o efeito de H. fasciculare na comunidade fúngica do solo foi efetuado um projeto de metabarcoding, no qual foram pirosequenciados ITS1 barcodes a partir de DNA obtido de diferentes amostras de solos. O solo de soutos transmontanos foi colhido e utilizado para o crescimento de castanheiro. Dois meses após a transplantação, as plantas foram inoculadas com H. fasciculare, sendo colhidas seis meses e um ano após inoculação. As plantas não inoculadas foram utilizadas como controlos. A fim de estudar o efeito da comunidade fúngica bem estabelecida na capacidade deletéria de H. fasciculare, os solos estéreis foram utilizados num ensaio paralelo.
Neste estudo, 458 OTUs (unidades taxonómicas operacionais) foram identificadas compreendendo 78,029 sequências identificadas. Ascomycota foi o filo mais rico (58.9%), seguido por Basidiomycota (38.9%). Contudo, o filo Basidiomycota foi o mais abundante (57.4%) seguido pelo Ascomycota (40.9%). De forma a avaliar a qualidade do habitat, diversidades alfa e beta foram consideradas, contribuindo para a determinação da riqueza de espécies em cada amostra de solo e a variação de espécies entre as condições, respetivamente. As amostras de solo estéril apresentaram ser menos ricas e diversas que as amostras de solo não estéril, além de que amostras de solo não estéril apresentaram ser mais homogéneas entre si. A variação dos grupos funcionais das espécies mais representadas foi analizada, sendo as espécies parasíticas as mais ricas e abundantes, seguida pelos saprófitas e micorrízicos. As correlações entre os grupos funcionais foram igualmente calculadas e a correlação mais positiva foi encontrada entre os saprófitas e parasitas. No geral, não foi evidenciado um claro efeito de H. fasciculare, sobre a restante comunidade microbiana do solo, apesar de específicas interações pussam ter ocorrido. O uso de solos estéreis permitiu o reconhecimento de um efeito semelhante ao efeito tampão,
vii inoculação do fungo nem pela presença do crescimento do castanheiro. Este efeito pode ter importância de um ponto de vista agronómico.
Palavras-chave: solos de soutos; Castanea sativa; Hypholoma fasciculare; metagenómica; ecológico; diversidade; comunidade microbiana
viii
Acknowledgments ... iii
Abstract ... iv
Resumo ... vi
Abbreviations and Acronyms ... x
Chapter I ...1
Introduction ... 1
1. Fungal communities associated to plants ... 4
Ecological guilds of fungi ... 5
Mycorrhizal associations ... 5
Parasitism ... 6
Saprotrophism ... 6
Hypholoma fasciculare: consequences for chestnut tree microbial community ... 7
2. Evaluating soil fungal communities by metabarcoding analysis ... 8
DNA barcoding for evaluating fungal communities ... 9
Next generation sequencing (NGS) in metabarcoding studies ... 11
3. Aims of the thesis ... 13
Chapter II ...14
Material and methods ... 14
1. Chestnut and soil sampling ... 15
2. Experimental design... 15
Production of Castanea sativa plantlets ... 15
Fungal inoculation of Castanea sativa plantlets ... 15
3. DNA extraction ... 17
4. DNA amplification ... 17
5. Agarose gel electrophoresis ... 19
6. High throughput sequencing - 454 pyrosequencing ... 19
ix
Chapter III ...26
Results and Discussion ... 26
1. Impact of Hypholoma fasciculare on chestnut tree development ... 27
2. Analysis of soil fungal biodiversity by metabarcoding ... 32
Preparation of DNA samples for metabarcoding analysis ... 32
Reads filtering from 454 pyrosequencing data ... 34
Phylogenetic analysis of identified OTUs ... 35
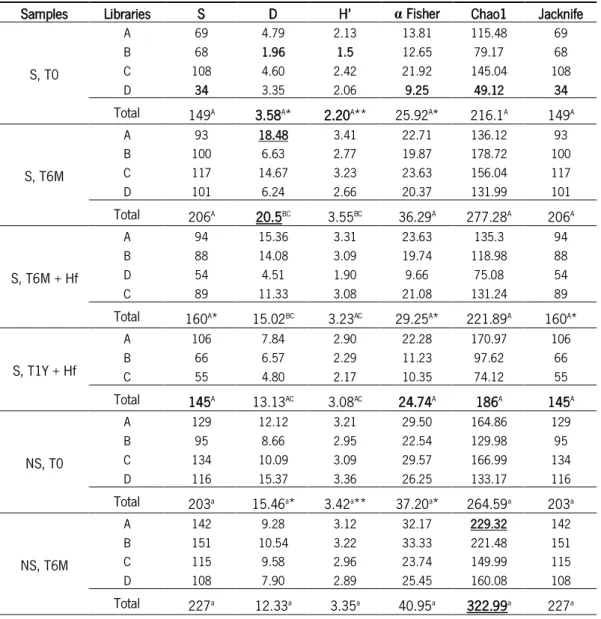
Fungal diversity of soil samples ... 39
3. Impact of Hypholoma fasciculare on soil fungal community ... 49
Comparison between sterile and non-sterile soils ... 50
Comparison between chestnut growing times ... 53
Comparison between Hypholoma fasciculare inoculation treatments ... 56
Evaluation of the dynamics of fungal community after inoculation ... 60
Hypholoma fasciculare effect on different fungal functional groups ... 65
Chapter IV ...70
Conclusions and Perspectives ... 70
Chapter V ...75
References ... 75
Chapter VI ...84
x bp –Base pair
CCD – Charge-coupled device DNA –Deoxyribonucleic Acid
dNTPs – Deoxynucleotide Triphosphates DWD – Daily increase of shoot dry weight EDTA – Ethylenediamine Tetraacetic Acid FAO – Food and Agriculture Organization ha – Hectare
IGS – Intergenic Spacer
ITS – Internal transcribed spacer Gb – Giga base pair
m – Metre M – Molar
MID – Multiplex Identifier min – Minute
N - North
NGS – Next-Generation Sequencing OTU - Operational taxonomic unit PCR - Polymerase Chain Reaction PDO - Protected Designation of Origin PTP – Picotiter plates
rDNA - Ribosomal Deoxyribonucleic Acid s – Second
SMS – ‘Single-molecule’ sequencing SSU - Ribosomal small subunit rRNA gene V - Volt
1
CHAPTER I
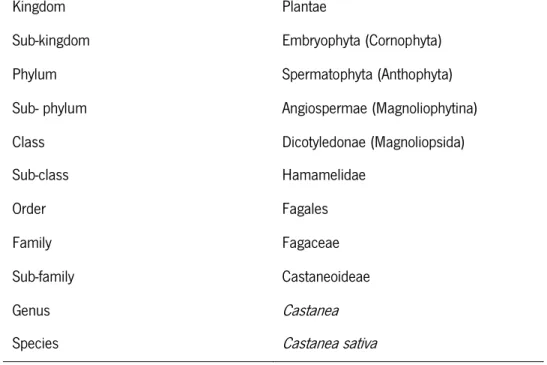
2 Chestnut tree is mainly distributed in three major areas: Europe (Castanea sativa Mill.), Asia (Castanea crenata Sieb. and Zucc. in Japan; Castanea mollissima BI. in China and Korea) and North America (Castanea dentata Borkh) (table 1). The genus Castanea is represented by thirteen species that have a wide range of different dimensions. Castanea dentata, C. henry and C. sativa (fig. 1) comprise the largest individuals, while C. pumila (var. ozarkiensis and var. pumila), C. mollissima and C. crenata include adult plants with only 15-20 m (Gomes-Laranjo and Crespí, 2007). Castanea sativa Mill. is the predominant cultivated species, in Europe, but recently some hybrids from the genetic cross with other species of chestnut have been developed for increasing the resistance to ink disease and chestnut tree cancer, caused by Phytophthora spp. and Cryphonectria parasitica, respectively (Vasconcelos et al., 2010). In order to have a good development and fruiting, the chestnut tree demands favorable weather conditions. The ideal conditions for its development are high altitudes (higher than 500 m) and winter low temperatures (Ribeiro et al., 2007) and its dispersion is limited above the 40º N parallel (Gomes-Laranjo et al., 2007).
Table 1 – Taxonomic identification of European chestnut according to Cronquist (1968).
Kingdom Plantae
Sub-kingdom Embryophyta (Cornophyta)
Phylum Spermatophyta (Anthophyta)
Sub- phylum Angiospermae (Magnoliophytina)
Class Dicotyledonae (Magnoliopsida)
Sub-class Hamamelidae
Order Fagales
Family Fagaceae
Sub-family Castaneoideae
Genus Castanea
Species Castanea sativa
The consumption of chestnut fruits has increased in many European countries, mainly due to the recognition of their nutritional qualities and potential beneficial health effects, and in particular the protection that is provided by their antioxidant compounds (Borges et al., 2008). In some rural regions of a few European countries, besides their agro-ecological importance,
3 chestnut trees also have the protection role against fire and erosion, as well as providing a supportive habitat for biodiversity and recreation (Blom et al., 2009). The chestnut forests and groves have a notable diversity of wildlife, mainly due to their inaccessibility, density and nutritious nuts (Diamandis and Perlerou, 2001).
In Portugal, the main chestnut production area is located in Trás-os-Montes, although a high distribution of chestnut trees is also found in Beira Interior (Borges et al., 2008). A lower density of chestnuts orchards is found in the Northeast Alentejo, North Algarve and Interior Minho (Ferreira-Cardoso and Pimentel-Pereira, 2007). Once it is a deciduous species (shedding of leaves and limited vegetative growth in winter), the hot temperatures can be a limitation for its growth and development, hence the area that fits better this feature is in the Northeast of Portugal (Gomes-Laranjo et al., 2007).
The production of chestnuts represents a crucial role for the Portuguese economy and patrimony (Borges et al., 2008). According to data available in Food and Agriculture Organization of the United Nations (FAO, 2012), Portugal presented the major chestnut producing area in Europe, with 34,800 ha, followed by Italy with 25,000 ha and France with 7,165 ha. Chestnut production in Portugal corresponded to 19,130 tons in 2012 and 24,739 tons in 2013 (INE, 2013). According to its importance, in Portugal, there are four different regions that produce high quality chestnut, which have been considered as Protected Designation of Origin (PDO) product: Castanha da Terra Fria, Castanha da Padrela, Castanha dos Soutos da Lapa and Castanha de Marvão (Ferreira-Cardoso and Pimentel-Pereira, 2007).
Two distinct types of chestnut tree plantation can be distinguished by their purpose: plantation for fruit production – “souto” – or plantation for wood production - “castinçal” (figure 1). In addition to their value for furniture industry, chestnut wood is also used for tannin production and source of renewable energy (Corredoira et al., 2015). Besides the importance of fruit and timber there is also a notable interest in edible mushrooms, which is highly valued in international markets and comprise one of the main secondary products of chestnut forest. Due to the production of chestnuts and wood, as well as mushroom collection, the exploitation of “soutos” and “castinçais” has been increasing (Diamandis and Perlerou, 2001).
4
Figure 1 - European chestnut, Castanea sativa plantation as a “souto” (a) and as a “castinçal” (b).
1. Fungal communities associated to plants
Fungi are considered to be a very important component of an ecosystem due to the roles they play. The primary and best understood role of soil fungi is as decomposers. However, besides also playing a fundamental role in terrestrial ecosystems as plants mutualists and parasites, they have an important implication in the agriculture, pharmacology and other environmental technologies (Anderson et al., 2003; Buée et al., 2009; Toju et al., 2012). Fungi are likewise capable of controlling soil water content and soil structure (Lim et al., 2010; Orgiazzi et al., 2012, 2013). Fungal symbionts are capable of developing themselves in the rhizosphere due to the presence of propagules, meaning spores, hyphae and rhizomorphs. Therefore they have the capacity to manipulate the nutrient fluxes in natural ecosystems by their extensive below-ground mycelial networks (Anderson et al., 2003). Fungi also play an important role in plant development, since they have the important role of establishing the connection between plant roots and the soil, allowing them to take advantage from their nutrient and water uptake capacity (Klein and Paschke, 2004; Bonfante and Anca, 2009). Besides these advantageous associations to plants, fungi can also harm them, being the cause of severe diseases that can lead to their dead. For example, in the chestnut forest ecosystem, Cryphonectria parasitica (Murr.) Barr. is responsible for the chestnut blight, which has been the cause of the most C. sativa Mill. decay (Bissegger et al., 1997). Also, Phytophthora spp. are considered harmful to woody plants, specifically P. cambivora (Petri) Buis. and P. cinnamomi Rands, which are the two most common oomycetes species responsible for the ink disease in European chestnut trees (Vannini and Vettraino, 2001; Vettraino et al., 2005).
5 Ecological guilds of fungi
Fungi can be divided into several trophic levels, according to their ecological functions and specialization. The main ecological groups of soil fungi are mycorrizhal, parasites and saprotrophic.
Mycorrhizal associations
The mycorrhizal associations are typically found on most annual and perennial plants (Martin, 2007). The term mycorrhiza describes diverse root-fungus associations, in which both partners benefit (Deacon, 2006; Bonfante and Anca, 2009). Actually, mycorrhizal fungi have a strong impact on plant development, since they provide an wide hyphal network for the capture and transport of water and mineral nutrients to plant roots (Chang and Miles, 2004; Deacon, 2006). Besides improving the availability of nutrients to the plant, mycorrhizal fungi also enhance the rooting of host plants and improve the structure of the soil. In addition, they protect the plant from biotic and abiotic stresses by upgrading its resistance and tolerance to pathogens, dryness, nutrient deficiency, among others (Jeffries et al., 2003; Barea et al., 2005). The importance of these fungi is greatly recognized by their influence on plant biodiversity, by their assistance in control of pests and also enhancement of plant fitness in polluted environments (Schüβler et al., 2001). In return the fungi receive carbohydrates from the plant.
According to the plant and fungal partners, different types of mycorrhiza can be recognized, which can be generally divided between ectomycorrhizae and endomycorrhizae. Endomycorrhizae can be further divided into three sub-classes, arbuscular, orchidoid and ericoid mycorrhizae, but all of which have hyphae which penetrates the roots cells and establish an intracellular symbiosis (Bonfante and Anca, 2009). Arbuscular mycorrhizae are common among various plant taxa, while ericoid and orchidoid, mycorrhizae are confined to the Ericales order and family Orchidaceae, respectively. Arbuscular mycorrhizal (AM) fungi are included in the Glomerales order and Zygomycota phyla. The orchidoid mycorrhizal fungi belong to the Basidiomycete phyla are determinant in supplying inorganic and organic nutrients to their host (Smith and Read, 1997). An intrinsic characteristic of these mycorrhizal fungi is the penetration of their hyphae inside the cells of the root cortex forming elaborated tangles (Boldrini et al., 2010). Ericoid mycorrhizae have great ecological importance due to its capacity as an efficient organic matter decomposer (Martin, 2007). They are distinguished by presenting an averagely dense coil of mycelium within the cells of the root cortex (Perotto et al., 2002).
6 Following arbuscular mycorrhizae, the second most abundant mycorrhizae are ectomycorrhizae (ECM), whose fungi belong to Asco-, Basidio- and Zygomycete phylum (Horton and Bruns, 2001). Their extracellular hyphae induce changes to root morphogenesis, leading to subtle alterations in epidermal or cortical cells (Bonfante and Anca, 2009). Hyphae develop between the intercellular spaces of root cells, at the epidermis level, where they form the Hartig net (Smith and Read, 1997). There is still a third class of mycorrhizae, the ectendomycorrhizae, which presents fungal characteristics from both endo- and ectomycorrhizae, whose fungi belong to the Basidiomycete class. Ectendomycorrhizae can be sub-divided into arbutoid and monotropoid mycorrhizae, whose fungal species belong the Arbutoidaea and Monotropoidaea sub-families, respectively (Smith and Read, 1997; Yu et al., 2001).
Parasitism
The relationship of parasitism is always at the expense of the host, from which the parasites obtain their nutrients for their development. However, the tolerance of plant host to the parasite is variable, some supporting a limited fungal growth, while others become diseased or even dye just by the presence of fungi (Chang and Miles, 2004; Baptista, 2007). This kind of fungi can damage some important crops and frenquently lead to food shortages (Chang and Miles, 2004).
Saprotrophism
The role of saprotrophic fungi as decomposers is very important for the soil ecosystem, since they release important nutrients for the sustained and promoted plant growth (Pereira et al., 2012). The reason why these fungi are described as saprotrophic is due to the way they obtain nutrients, which is from dead or decaying organic matter (Chang and Miles, 2004). Saprotrophic are also important for improving the amount of mineral nutrients present in the soil (reviewed by Baptista, 2007). Some saprotrophic basidiomycetes are capable of forming large mycelia that can extend over tens centimeters or meters, making these organisms well adapted for terrestrial environments (Šnajdr et al., 2011).
Castanea sativa establishes different types of interaction with soil fungi. The knowledge of fungal diversity associated to chestnut trees has been gained by macrofungal surveys and recent molecular approaches (Baptista et al., 2015). The high abundance of Hypholoma fasciculare in
7 C. sativa forest soils and its influence on the fungal community is an important aspect to consider for the sustainability of chestnut orchards.
Hypholoma fasciculare: consequences for chestnut tree microbial community
The genus Hypholoma comprises around 30 species that are distributed worldwide from temperate to tropical zones. This fungus grows on decomposing wood, above living trees and mosses, or even on the soil (Cortez and Silveira, 2007).
The Hypholoma species that is commonly associated to C. sativa forest soils is H. fasciculare (Huds.: Fr.) P. Kumm (table 2), which is a saprothophic basidiomycete considered to be a litter decomposing (Šnajdr et al., 2008, 2011) and a white-rot fungal species (Valásková et al., 2009). Hypholoma fasciculare is a wood and litter decomposer that plays a major role in the forest ecosystem, acting on the biological control of phytopathogenic fungi (Cortez and Silveira, 2007). According to the Index Fungorum database (http://www.indexfungorum.org/) H. fasciculare has now a new designation, H. acutum (Sacc.) E. Horak. In this work, when referring to this fungus, the older classification will still be used.
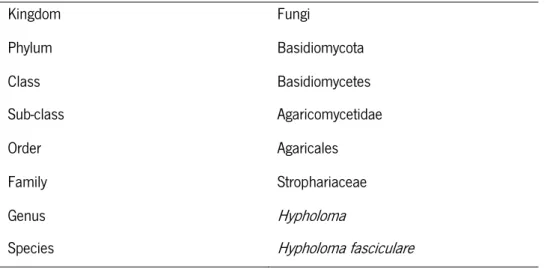
Table 2 - Taxonomic identification of saprotrophic fungi Hypholoma fasciculare according to Kirk et
al. (2001). Kingdom Fungi Phylum Basidiomycota Class Basidiomycetes Sub-class Agaricomycetidae Order Agaricales Family Strophariaceae Genus Hypholoma
Species Hypholoma fasciculare
The behavior and reaction of other fungi towards saprotrophic basidiomycetes is not always constant. In some cases, when a saprotrophic mycelium meets another fungus, the saprotroph can either gain territory or be inhibited by the other or none of them gains ahead (Pereira et al., 2013). Hypholoma fasciculare displays a high antagonist activity against other soil-borne fungi
8 (Pereira et al., 2013). According to this, H. fasciculare has been investigated as a competitive fungus to be used to promote the reduction of timber losses related to the Armillaria root disease (Chapman et al., 2001).
In chestnut agro-systems, saprotrophic and ectomycorrhizal fungi seem to interact with each other despite they occupy different soil horizons. Pereira et al. (2012) evaluated the effect of H. fasciculare and Pisolithus tinctorius (an ectomycorrhizal fungus) on the growth of C. sativa and reported the negative effect of H. fasciculare on the interaction of the ectomycorrhizal fungus and roots. This kind of suppression is expected to commit the ectomycorrhization of the chestnut trees thus constraining their development.
2. Evaluating soil fungal communities by metabarcoding analysis
Soil portrays a large reservoir of microorganisms biodiversity that are involved in key steps for the ecosystem functioning. In a single gram of soil it is likely to be present more than 1010
prokaryotes and about 1,000 Gb of microbial genome sequences (Orgiazzi et al., 2013). The knowledge of soil fungal community is important to understand the ecological interactions among organisms that occur in that ecosystem.
The conventional study of fungal communities relies on the identification of fungal species following their isolation, and/or culture and due to their morphological and biochemical tests. This widely used approach turned out to be time consuming and lead to problems in identification. More recently, molecular identification recurring to the sequencing of ITS regions has been the most reliable method for fungal identification. However to overcome the weaknesses (and sometimes the impossibility) of cultured-based identification of organisms, novel detection methods have been developed discarding the need to perform isolation and culture steps (Brunner et al., 2007).
An analysis with a genomic perspective of the complexity of environmental samples is becoming an important tool to understand the evolutionary history, as well as the functional and ecological biodiversity of microorganisms. The parallel sequencing of multiple templates, obtained from environmental DNA samples that contain sequences from innumerous species, was only possible by the emergence of next-generation sequencing (NGS) approaches (Shokralla et al., 2012). Given the high demand for this technology, a remarkable development of the sequencing systems become evident, which turned out to be faster and cheaper, and most of all with a higher level of precision (Gupta, 2008).
9 DNA barcoding for evaluating fungal communities
DNA barcoding is an efficient taxonomic method for identification of species present in unknown samples. In this method the information contained on the nucleotide sequence of a target region (DNA barcode) can be used for the efficient, fast and accurate species identification (Toju et al., 2012). This approach relies on the amplification of 500 to 800 bp sequences that allows the identification of different taxa. The amplification makes use of primers that fits for the widest taxonomic group possible relying on the concept of a “universal product code”, and produces an amplicon containing a specific sequence unambiguously attributed to a particular species (Brunner et al., 2007). Barcoding is a very useful approach to apply since it makes use of stable and unique sequences that are specific to one species (Schoch et al., 2012).
The major difficulty of DNA barcode is the genomic region that should be used as barcode, since it is the central point for multitaxon ecological and biodiversity studies. There are standardized barcodes according to the species to be identified. For most animals, a fragment of the mitochondrial COI gene is used as a barcode, while for plants a fragment of the plastid gene ribulose 1,5-bisphosphate carboxylase gene (rbcL) together with a fragment of the maturase (matK) gene are used (Cristescu, 2014). For bacterial identification, the 16S rDNA is used (Shokralla et al., 2012), while the standardized barcode for fungi is the nuclear internal transcribed spacer (ITS) of the rDNA (Schoch et al., 2012; Cristescu, 2014).
The fungal nuclear ribosomal DNA contains the information for three rRNAs (28S, 18S and 5.8S), which are separated by the internal transcribed spacer (ITS) regions (figure 2). Whole transcription unit is repeated in tandem many times, being the repeats separated by intergenic spacers (IGS). Two variable non-coding regions (ITS1 and ITS2) are comprised within the rDNA
repeat, specifically between the small subunit 5.8S rDNA (highly conserved) and each of the large subunit rRNA genes (Gardes and Bruns, 1993; Brunner et al., 2007; Nilsson et al., 2009; Toju et al., 2012).
10
Figure 2 – Organization of the nuclear-encoded ribosomal RNA (rDNA) region including the repeating units of nuclear rDNA coding regions (Bugni and Ireland, 2004). ITS1 (ITS-1) relies between 18S and 5.8S rDNAs, while ITS2 (ITS-2) is located between 5.8S and 26S rDNA (in fungi). Universal primers used for barcoding approaches are depicted in arrows.
Since ITS regions do not contain information for proteins or RNAs, they present a great rate of evolution that turns them typically species specific. In spite of this, the 18S nuclear ribosomal small subunit rRNA gene (SSU) is usually used for phylogenetic studies in fungi. Nevertheless, ITS has been considered the most used barcoding region of fungi, in part due to the conserved regions used for primers targets. In addition, this region joins together the advantages of being a high resolution barcode at different taxa levels with the simple amplification of a multi-copy region. Indeed, a readily amplifiable product can be obtained even when studying samples with few amounts of initial DNA, like environmental samples from wood and soil, or partially degraded DNA (Nilsson et al., 2008, 2009). Therefore, ITS barcodes combine the greatest resolving force for discriminating closely related fungal species with an increased PCR and sequencing efficiency through a widely range of fungi (Nilsson et al., 2009; Schoch et al., 2012).
For attaining ITS barcoding a set of specific primers were designed for the amplification of fungal ITS (White et al., 1990). However, as many of these primers allowed the co-amplification of plant or even other eukaryotic DNAs (Anderson et al., 2003), new primers (like ITSF1, based on the sequence of ITS1 primer), more specific for fungal sequences were designed by Gardes and Bruns (1993). In this way when using the pair of primers ITS1F/ITS2 the amplification become more selective towards fungi (Orgiazzi et al., 2012).
The entire ITS region (≈ 650 bp) can be sequenced in a single round of Sanger sequencing, providing an extremely efficient method for the creation of DNA barcode references libraries. However, this first-generation system is only capable of sequencing individual specimens thus limiting the processing of complex environmental samples (Shokralla et al., 2012). Due to the
11 high number of individuals present in an environmental sample, new and improved technologies for sequencing are required (Gupta, 2008; Shokralla et al., 2012). This gave rise to the so-called “metabarcoding” strategy that can be described as a rapid method of biodiversity assessment that combines two technologies, DNA taxonomy and high-throughput DNA sequencing, where the purpose is to identify in just one experiment a large range of species (Hajibabaei, 2012; Taberlet et al., 2012; Ji et al., 2013; Ali et al., 2014). This sequencing approach is capable of generating millions of sequences in just one run (Janzen et al., 2005; Ji et al., 2013). Therefore, next-generation sequencing (NGS) technology used for sequencing species-specific DNA barcodes is able to assist the mission of investigating the spreading of microbial communities patterns in complex environmental samples (Shokralla et al., 2012; Orgiazzi et al., 2013).
Next generation sequencing (NGS) in metabarcoding studies
The NGS technology extended the sequencing process across millions of reactions that occur simultaneously in a massively parallel fashion. As a result, the sequencing step is no longer limited to a single or few DNA fragments (Shokralla et al., 2012). Besides the diverse chemistry and tools for base incorporation and/or detection used by the different NGS technologies, there are two key steps in common: library fragmentation/amplicon library preparation and detection of the incorporated nucleotides. Specific protocols are distinct among diverse technologies and determine the type of data that is produced in each platform.
Two types of classified NGS technologies can be distinguished: ‘single-molecule’ sequencing (SMS) technologies and technologies based on polymerase chain reaction (PCR) (Metzker, 2010; Shokralla et al., 2012). SMS technology is an attractive approach due to its simplicity, and for being independent on a PCR amplification prior to sequencing (Pushkarev et al., 2009; Shokralla et al., 2012). HeliScope (Helicos BioSciences Corp., Cambridge, MA, USA) and PacBio RS SMRT system (Pacific Biosciences, Menlo Park, CA, USA) are two systems that use this technology. SMS technologies are known for being fast and cheap, producing a huge amount of data (Gupta, 2008; Harris et al., 2008; Pushkarev et al., 2009; Shokralla et al., 2012). This technology is able of analyzing genomic information without having the need for cloning, amplification or ligation. In contrast, PCR-based NGS technology involves a PCR step that could introduce a possible bias due to amplification of DNA prior to sequencing, but also presents several advantages.
12
Next-Generation DNA sequencing technologies based on PCR
Nowadays four different sequencing platforms rely on technologies based on PCR: Roche 454 Genome Sequencer (Roche Diagnostics Corp., Branford, CT, USA), Applied Biosystems SOLiD™ Sequencer (Life Technologies Corp., Carlsbad, CA, USA), Illumina sequencers (Illumina Inc., San Diego, CA, USA) and Ion Personal Genome Machine (Life Technologies, South San Francisco, CA, USA) (Shokralla et al., 2012). Besides generating improved sequences, these NGS sequencers are also less expensive comparatively to the conventional methods. The central point of these technologies provides a vigorous and economical workflow for better knowledge of specific genomic regions also allowing metabarcoding approaches (Harismendy et al., 2009; Shokralla et al., 2012; Taberlet et al., 2012).
The first metabarcoding studies relied on 454 pyrosequencing. Pyrosequencing is a non-eletrophoretic method for DNA sequencing that makes use of real-time sequencing-by-synthesis technology, comprising methods dependent on DNA polymerase. This method does not need the cloning of environmental samples, therefore eliminating some of the problems that come associated with that step (Nilsson et al., 2009). Sequencing based on 454 pyrosequencing is divided into three stages: sample preparation, emulsion PCR and sequencing (Carvalho and Silva, 2010; Shokralla et al., 2012). When using genomic DNA, DNA is first fragmented, into 300 to 800 bp fragments, and 454 adaptors are attached to their ends. In a metabarcoding study, DNA from an environmental sample is amplified using barcode sequence primers attached to 454 adaptors. At the second stage (emulsion PCR) the fragments are hybridized to microspheres (beads), in a way that each fragment binds to just one bead. Then, fragments are submitted to amplification through emulsion PCR thermal cycling into single water:oil micro-reactors that contain the PCR mix. Here, every fragment is amplified on the surface of the corresponding bead, generating innumerous copies of the original fragment, which became fused to the surface of the bead. Finally, sequencing takes place in picotiter plates (PTP), which are designed to contain one million wells per plate, and only one DNA bead per well. Engineered beads that carry immobilized enzymes necessary for the 454 pyrosequencing process are also deposited inside each well. During pyrosequencing, every time a nucleotide is incorporated into the new chain, by DNA polymerase the release of a pyrophosphate molecule occurs. This release starts a series of enzymatic reactions that lead to the production of light by luciferase being the signal captured by the charge-coupled device (CCD) camera. The amount of light that is generated is proportional to
13 the number of nucleotides that were incorporated (Carvalho and Silva, 2010; Shokralla et al., 2012). The emitted signals of light obtained after the introduction of each nucleotide introduction step will allow to determine the sequence produced by each bead.
3. Aims of the thesis
The main goal of this work was to study the influence of H. fasciculare on the microbial diversity of soils from chestnut orchards. Previous studies described high antagonist activity of H. fasciculare suggesting that the microbial richness and diversity will be expected to dramatically change in the presence of significant amounts of this fungal mycelium. Therefore, for determining the impact of H. fasciculare in this ecosystem, a metagenomic approach will be used for determining the soil fungal community by sequencing ITS1 barcodes from soil DNA samples using 454 pyrosequencing. Chestnut plants will grow on pots containing soil collected from chestnut orchards that will be then infected with H. fasciculare. Fungal community alterations will be followed by collecting soil samples along time (just before, six months and one year after the fungal inoculation) using a metabarcoding approach. For studying the contribution of native microbial ecosystem in H. fasciculare impact in plant development and microbial diversity, chestnut orchard soils will be used without or with previous sterilization.
14
CHAPTER II
15
1. Chestnut and soil sampling
Chestnuts and soils were collected in a 100-year-old and non-tilled chestnut orchard, located in Terroso (N41º 52 W6º 50; 886 m altitude), in the Natural Park of Montesinho (74,800 ha) in Bragança (Trás-os-Montes, Northeast of Portugal). This orchard was chosen because, in contrast with others, displayed a low abundance of H. fasciculare carpophores between September 2002 and December 2005.
2. Experimental design
Production of Castanea sativa plantlets
Castanea sativa seeds were surface sterilized with sodium hypochloride (5%, v/v) during 1h and washed three times with sterile distilled water. After stratification, the germination took place in sterile moistened sand, at 5 - 10ºC, for two months, following which, the radicle tips were pruned for promoting the root branching. The seedlings were then transferred into cuvettes, filled with sterile vermiculite/topsoil/sand (3:1:1, v/v/v), previously sterilized with formaldehyde at 4% (v/v). The plantlets were irrigated automatically for 30 seconds every 30 minutes and maintained under greenhouse conditions (day/night thermal regime 23º/18º±2ºC, 10 h light/14 h dark photoperiod, and 70±10% relative humidity). After two months, the uniform plantlets were selected and transferred to 2 L plastic pots containing collected chestnut orchard soil, half of which were either submitted to sterilization in the autoclave (120ºC for 1h) (S) or kept non-sterile (NS). Each pot was used for the growing of three chestnut plantlets.
Fungal inoculation of Castanea sativa plantlets
The H. fasciculare mycelium used for chestnut plantlets inoculation was grown in liquid-modified MMN medium, as described in Pereira (2012). The suspension cultures were kept in the dark, without agitation, at 23-25ºC, for two weeks. Plant inoculation was carried out by transferring 50 mL of the H. fasciculare fungal suspension into a hole made at the root system level. Mock treatments were used as controls and were performed using 50 mL of sterile culture medium.
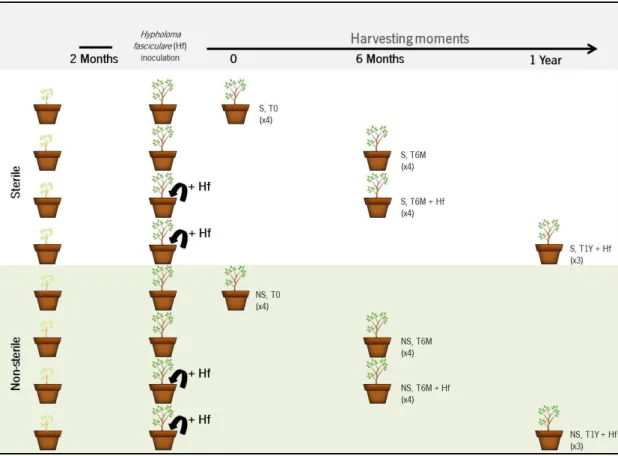
The inoculation of H. fasciculare into the chestnut plantlets pots (+Hf) was performed, in two different moments: two months (2M) or one year (1Y) after transplantation of plants to pots. Collection of plants and soil samples was performed six months (T6M) or one year (T1Y) after
16 fungal inoculation. Each treatment had three/four replicates (pots with three plants each), and for the pyrosequencing analysis some replicates of soil samples were mixed together (table 8, results and discussion). As controls, the same sampling periods were used in mock treatments. Every soil sample was thoroughly mixed and sieved using a 2 mm mesh, and stored at -80ºC until DNA extraction. Although plant developmental and physiological parameters were studied in all these treatments, for metabarcoding analysis only selected treatments were used for DNA extraction (cf. table A 1, annex). The experimental design used in the present work are represented in figures 3 and 4, respectively.
Figure 3– Experimental design used for evaluating the influence of H.fasciculare on the fungal
community present in chestnut orchards by metabarcoding. Sterile (S) and non-sterile (NS) chestnut orchard soils were used for growing chestnut plantlets (3 plants/plot, 3-4 replicates) during two months.
Inoculation of H. fasciculare (+Hf) was performed and soils were harvested immediately before inoculation
(T0), six months (T6M) and one year (T1Y). Mock treatments were used as controls, the number of replicas used for metabarcoding are depicted in bracktes.
17
Figure 4 – Experimental stages. Castanea sativa plants after two months of growing in orchards soils
that were previsously sterilized (S) or not (NS) (a) Soils preparation to perform the inoculation of
Hypholoma fasciculare (b)and fungal inoculation (c).
3. DNA extraction
To test if the protocol of extraction worked, two simple samples were firstly tested, (S, T0 and NS, T0). DNA extraction was performed following the protocol of Ultra Clean Soil DNA isolation kit (MO BIO Laboratories) with few adaptations. Differents amounts of soil samples were prepared for being used for extracting DNA: 0.25 g from single soil sample or 0.125 g of different soils sample replicas to form a soil mix. A soil sample (0.25 g) was vortexed in the presence of a solution provided by the kit, containing SDS and other disruption agents to help in cell lysis. The mixture was briefly vortexed and centrifuged for 10 min. Supernatant was transferred to a new microtube and protocol proceeded as described in the instructions provided by the supplier, except the last step, where the ressuspension was performed with 100 µL of ultra pure water.
DNA samples were submitted to quantification and quality evaluation in the NanoDrop ND-1000 (NanoDrop Technologies) spectrophotometer by A260 nm and A280 nm readings. A260 nm of 1.0
corresponds to 50 µL DNA/mL and the ratio A260 nm/A280 nm was used to assess the purity of DNA
samples. Dilutions were prepared from DNA stock samples, in order to get the same final concentration (10 ng/µL) of each sample for obtaining reliable results.
4. DNA amplification
DNA amplification was performed by the polymerase chain reaction (PCR), a technique which allows the production of millions of copies of a specific DNA sequence in a short time. In order to guarantee a homogenous amplification of ITS1 from environmental samples, three independent reactions of each DNA sample were performed. To perform 454 pyrosequencing it was necessary to design specific primers for the ITS regions of fungi that would be used as barcodes. The primers (FwITS1F and RvITS2) thus contained the ITS sequence primer, ITS1F (based on ITS1 sequence) and ITS2 (both depicted in figure 2), respectively, as well as adapters for the
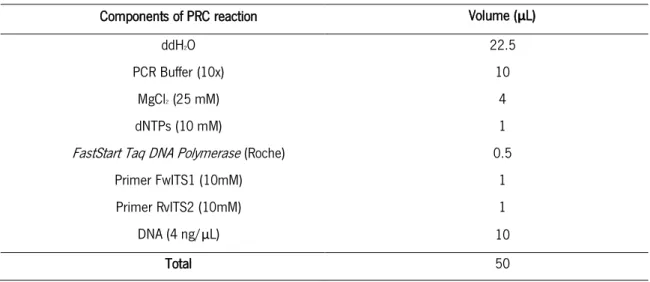
18 pyrosequencing (A or B) and a four-base library “key” sequence (TCAG) (table 3). In addition, the reverse primer included multiplex identifier sequences (MID) for the identification of each soil sample (figure 5). Therefore, for every DNA sample the primer forward FwITS1F was combined with a different reverse primer, which differs according to the MID sequence that is included. For the amplification, a reaction mix to be used in the PCR reaction was prepared (table 4).
Table 3 - Set of primers used for the ITS region amplification.
Primer Sequencing adaptor Key MID Specific template
FwITS1F A - CGTATCGCCTCCCTCGCGCCA TCAG - CTTGGTCATTTAGAGGAAGTAA RvITS2 B - CTATGCGCCTTGCCAGCCCGC TCAG XXXXXXXX* GCTGCGTTCTTCATCGATGC
XXXXXXXX* - Represents the specific sequence of which sample, respectively described next: S, T0 (A) - (ACGAGTGCGT); S, T0 (B) - (ACGCTCGACA); S, T0 (C) - (AGACGCACTC); S, T0 (D) - (AGCACTGTAG); S, T6M (A) - (TGTACTACTC), S, T6M (B) - (ACGACTACAG); S, T6M (C) - (CGTAGACTAG); S, T6M (D) - (TACGAGTATG); S, T6M + Hf (A) - (TCTCTATGCG); S, T6M + Hf (B) - (TGATACGTCT); S, T6M + Hf (C) - (CATAGTAGTG); S, T6M + Hf (D) - (CGAGAGATAC); S, T1Y + Hf (A) - (ACGCGAGTAT); S, T1Y + Hf (B) - (ACTACTATGT); S, T1Y + Hf (C) - (ACTGTACAGT); NS, T0 (A) - (ATCAGACACG); NS, T0 (B) - (ATATCGCGAG); NS, T0 (C) - (CGTGTCTCTA); NS, T0 (D) - (CTCGCGTGTC); NS, T6M (A) - (TACTCTCGTC); NS, T6M (B) - (TAGAGACGAG); NS, T6M (C) - (TCGTCGCTCG); NS, T6M (D) - (ACATACGCGT); NE, T6M + Hf (A) - (ATACGACGTA); NS, T6M + Hf (B) - (TCACGTACTA); NS, T6M + Hf (C) - (CGTCTAGTAC); NS, T6M + Hf (D) - (TCTACGTAGC); NS, T1Y + Hf (A) - (AGACTATACT); NS, T1Y + Hf (B) (AGCGTCGTCT); NS, T1Y + Hf (C) - (AGTACGCTAT).
Figure 5 – Representation of the primers used for the ITS1 region amplification comprising: the adapters A and B for the pyrosequencing (blue), the four-base library “key” sequence (red), the multiplex identifier sequence (MID) (orange) and the template-specific sequence for the amplification for the ITS1 region, primer forward FwITS1-F and the reverse primer ITS2 (dark green).
Table 4 - Components used for each PCR amplification.
Components of PRC reaction Volume (µL)
ddH2O 22.5
PCR Buffer (10x) 10
MgCl2 (25 mM) 4
dNTPs (10 mM) 1
FastStart Taq DNA Polymerase (Roche) 0.5
Primer FwITS1 (10mM) 1
Primer RvITS2 (10mM) 1
DNA (4 ng/µL) 10
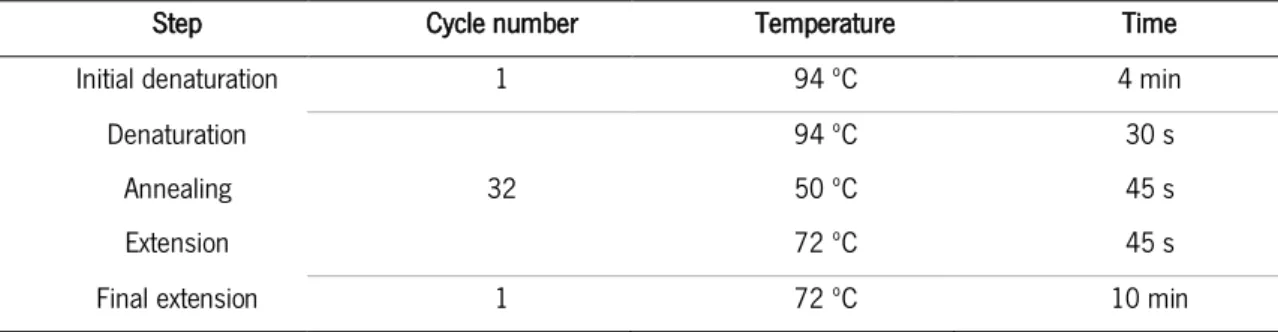
19 To perform the DNA amplification, a reaction mix was prepared and the amplification program presented in table 5 was used in a MJ Mini BioRad® thermocycler. After amplification, PCR products were kept at 4ºC up to electrophoretic analysis and then stored at –20ºC until 454 pyrosequencing.
Table 5 - Amplification program.
Step Cycle number Temperature Time
Initial denaturation 1 94 ºC 4 min
Denaturation 32 94 ºC 30 s 45 s 45 s Annealing 50 ºC Extension 72 ºC
Final extension 1 72 ºC 10 min
5. Agarose gel electrophoresis
Electrophoresis was performed in an agarose gel at 1.2 % (w/v) and occurred in 0.5x TAE buffer (0.01 M Tris, pH 8.0; 47.5 mM acetic acid, 25 mM EDTA), for 30 min at 100 V. For DNA visualization, 100 µL of SYBR safe (Invitrogen) was added to 100 mL melted agarose solution. To 10 µL of each DNA sample, 3 µL of 1x loading buffer (1.6 mM Tris-HCl, pH 7.6; 6% (v/v) glycerol; 6 mM EDTA; 0.005% (w/v) bromophenol blue) was added. A molecular marker was also loaded into the gel (Mass Ruler ™ DNA Ladder Mix, Fermentas). Observation of DNA fragments was performed on a 610 nm UV transilluminator (VWR Genosmart, VWR) coupled to an image acquisition system (VWR Genosmart, VWR).
6. High throughput sequencing - 454 pyrosequencing
Amplification products were quantified by spectrophotometry, using the Nanodrop ND-100 (NanoDrop Technologies), as previously described. DNA amounts (117 ng) from the three/four amplification replicas, obtained from each soil sample combination, were pooled together into a single microtube and stored at 4ºC. All the 30 microtubes were delivered at BioCant (Cantanhede, Portugal), where the subsequent steps were performed. To guarantee that equal amounts of DNA from each sample were used in the emulsion PCR, DNA quantification by fluorescence with Quant-iT™ PicoGreen® dsDNA Assay Kit (Invitrogen, CA, USA) was performed.
The number of molecules in each and every sample was defined in accordance to the size of the predicted amplicon (250-350 bp).
20 Pyrosequencing occurred in a Genome Sequencer GS FLX Titanium (Roche-454 Life Sciences, Brandford, CT, USA), in a ¼ of a PTP sequencing plate, from adaptor B, according to the standard manufacturer’s instructions at Biocant (Cantanhede, Portugal). Sequencing program was adjusted to produce an average of 7,000 reads per sample core.
7. Sequence processing and data analysis
A first step to filter the sequence data was performed at BioCant. This first quality filter aims to reduce the random sequencing errors. So, the sequences that presented less than 120 bp and displayed more than two ambiguous nucleotides (N) were discarded. The sequences in which the reverse primer was reached were also eliminated. Bases that presented low quality regions in both ends were trimmed through the use of a window of 7 bases, whose average phred score was 15. Sequences with more than 50% of low complexity regions, determined by DustMasker (Sogin et al., 2006) and chimera sequences identified by UChime (Edgar et al., 2011) were also discarded. Following this first treatment, the total number of quality reads was submitted to an analysis process in Metagenomics Analysis Server MG-RAST version 3.3.7.3 (Meyer et al., 2008). Here, the identification cutoff parameters were: maximum e-value of 1e-6, minimum identity of
97% and 50 bp as minimum of alignment length. Operational taxonomic units (OTUs) were identified by sequence top BLAST hit compared against the SILVA LSU database.
For comparing the most well-represented OTUs between soils samples, only those OTUs that presented more than 50 reads were considered. This cutoff number was determined according to the influence of cutoff values in the resulting number of reads and identified OTUs number. The identification of trophic level of each well-represented OUT was performed by literature search, determining: which were mycorrhizal (M), parasite (P), parasite/saprotroph (PS), saprotroph (S), yeast (Y) or were unclassified (Un).
8. Diversity and statistical analysis
The species diversity is a measure of diversity of a community that takes into account the species richness and their abundance.
Species richness refers to the number of different species (in this case OTUs) present in the community, whereas species abundance refers to the number of individuals (in this case, reads) of each species. Both parameters were investigated and analyzed by Species Diversity and
21 Richness 4.1.2. (SDR) (Seaby and Henderson, 2007), EstimateS 9.1.0. (Colwell, 2013) and Community Analysis Package 4.0 (CAP) (Henderson and Seaby, 2007) softwares.
Alpha diversity indices, such as Simpson diversity index (D) (in its reciprocal form), Shannon diversity index and Fisher’s alpha, are usually calculated for determining the diversity of specific community taking into account both the number of species and the proportion in which each species is represented. These parameters were computed by EstimateS 9.1.0 software (Colwell, 2013), as well as the species richness estimators (Chao1 and 1st order Jackknife). All these
parameters will be shortly described:
- Simpson’s index (Simpson, 1949) (equation 2.1) measures the probability of any two randomly chosen individuals taken from an infinitely large community belong to the same species. The value of D is indirectly proportional with the value of diversity. Therefore this index is usually expressed as 1 - D (complement) or 1/D (reciprocal). This index is more focused on the abundance of species in the sample than the species richness itself and thus retains the variance of the species abundance distribution. Shannon-Wiener index or Shannon index (H’) (Shannon, 1948) (equation 2.2) is a commonly used index to characterize species diversity in a single community. This index computed the uncertainty associated with identifying species in a community. For this Shannon index assumes that all species are represented in the community and the individuals are randomly sampled from an infinitely large community (Magurran, 2004).
D= -∑i=1𝑠 p
i2 (Equation 2.1)
H’= -∑i=1𝑠 pi ln pi (Equation 2.2)
where:
S, number of species
pi, proportion of the species i pi=ni/N
ni, number of individuals of specie i
N, total number of individuals ln pi, base 2 logarithm of pi
- Fisher’s alpha (Fisher et al., 1943) is a parametric index of diversity that accepts that species abundance follows a log series distribution and can be depermined by (equation 2.3) (Colwell, 2013).
22 S= α ln (1+𝑁𝛼 ) (Equation 2.3) where: S, number of taxa N, number of individuals α – Fisher’s alpha; N(1-x)/x
- Jackknife (1st and 2nd order) (Burnham and Overton, 1978, 1979), Chao1 (Chao, 1984;
Colwell and Coddington, 1994) and Chao2 (Chao, 1987; Colwell and Coddington, 1994) are richness species measures that allow the estimation of the total number of species in one specific community from sample data. The 1st order Jackknife (equation 2.4) estimates the total
richness using the number of species present in only one sample (Barros, 2007), whereas Chao1 (equation 2.5) uses the number of species represented by just one individual (singletons) and two individuals (doubletons) in the samples (Magurran, 2004; Barros, 2007).
SJ= s + Q1𝑛−1 𝑛 (Equation 2.4) SJ= s + 𝑄𝐽2 2𝑄𝐽 (Equation 2.5) where: SJ, estimated richness s, observed richness
QJ, number of species that occur in j samples
n, number of samples
The number of species/OTUs shared between soil samples was obtained by Species Diversity and Richness 4.1.2 software (Seaby and Henderson, 2007). The coefficients of similarity (Jaccard and Sørensen indexes, as well as Bray-Curtis coefficient) between soils samples were calculated by Community Analysis Package 4.0 software (Henderson and Seaby, 2007). For determining the variation between two sites, indexes of beta diversity were computed. These indexes measure the turnover of species between two sites, in terms of gain or loss of species, contributing for the understanding of how a community differs according to their species composition (Barros, 2007), and what manages that diversity (Condit et al., 2002). Several measures appropriate for the analysis of presence and absence data were also evaluated, such
23 as, Whittaker (ßW), Cody (ßc), Routledge (ßr, ßi, ße), Wilson and Shmida (ßt) and Harrison (1 and 2)
beta diversity measures by Species Diversity and Richness 4.1.2 software (Seaby and Henderson, 2007). All these similarity and diversity parameters will be shortly described:
- Jaccard (Jaccard, 1908) (equation 2.6) and Sørensen (Sørensen, 1948) (equation 2.7) indexes are similarity coefficients used for the determination of beta diversity analysis. Both indexes compare communities qualitatively (Barros, 2007).
ßj= a/(a+b+c) (Equation 2.6)
ßsor= 2a/(2a+b+c) (Equation 2.7)
where:
a, number of species found in both communities, A and B b, number of species found in community B but not in A c, number of species found in community A but not in C
- The Bray-Curtis coefficient (Bray and Curtis, 1957) (equation 2.8) is, also a coefficient for beta diversity, that is calculated according to the differences in abundance of each species between sites. As a consequence, the final distance will be influenced by the species with the largest differences in abundance (Kindt and Coe, 2005; Somerfield, 2008; Yoshioka, 2008).
S=100∑𝑝𝑖=12min(𝑌𝑖𝑗,Y𝑖𝑘)
∑𝑝𝑖=1(𝑌𝑖𝑗+𝑌𝑖𝑘) (Equation 2.8)
where:
Yij and Yik, measure of species i in samples j and k,
Min (Yij, Yik), minimum of Yijand Yik
p, number of species
- Whittaker (ßW) measure (Whittaker, 1960) analyzes the modification in the composition of a
community, according to environmental patterns (equation 2.9). On its turn, Cody (ßc) (1975)
definies the rate of compositional turnover along a environmental gradient (equation 2.10) (Tuomisto, 2010). Routledge (ßr) measure (equation 2.11), is quite similar to ßWmeasure and
appears to be suitable for ecological analysis of community data, conducting to the meaning of species turnover along gradients. Besides analyzing the presence and absence data, the
24 Routlegde (ßi) measure also appeals for the symmetry of samples sizes (equation 2.12), while
Routledge (ße) refers to the community turnover (equation 2.13) (Routledge, 1977).
- Wilson & Shmida (ßt) (Wilson and Shmida, 1984) is a measure of beta turnover, which
combines the concept of species turnover with the modification due to gain and loss of species along the gradient, similar to ßc but using a standardization by average sample richness (equation
2.14).
- Harrison 1 (Harrison, 1992) (equation 2.15) can be used in order to examinate the differentiation between sites. Harrison 2 (Harrison, 1992) measures the value by wchich regional diversity outrun the maximum diversity attained locally (equation 2.16).
ßW =𝑆 ά -1 (Equation 2.9) ßc =𝑔(𝐻)+𝑙(𝐻) 2 (Equation 2.10) ßr = 𝑆 2 2r+𝑆 (Equation 2.11) ßi =log(T)-(1 𝑇 ∑ 𝑒𝑖𝑖 log(𝑒𝑖)-( 1 𝑇 ∑ 𝛼𝑗𝑗 log(𝛼𝑗) (Equation 2.12) ße =exp(ßi)-1 (Equation 2.13) ßc =𝑔(𝐻)+𝑙(𝐻) 2ά (Equation 2.14) ß1=[𝑆 ά –1]/(N-1) (Equation 2.15) ß1=[ 𝑆 ά𝑚𝑎𝑥 –1]/(N-1) (Equation 2.16) where:
S, total number of species in both samples N, number of samples
T, total number of species r, number of species found g, cumulative gain in species l, cumulative loss in species H, range of habitat gradient
ά, average number of species found within samples
ά𝑚𝑎𝑥, maximum value of species richness for the two samples 𝛼𝑗and 𝑒𝑖, total number of species found in j and I, respectively
25 Non-metric multidimensional scaling (NMDS) was carried out to explore the similarity of soil fungal community among treatments (sterile or non-sterile soils samples, with or without fungal inoculation and with different chestnut growing times). The NMDS plots rank fungal communities (represented by points) in ordination space in a way that the distance between two points is inversely proportional to their similarity. The correspondence of the ordination diagram to the distances is described by a stress value (Kruskal's stress), with values less than 0.2 representing good ordination plots and greater than 0.3 provides a poor representation (Clarke, 1993). NMDS was performed by using Jaccard’s and Bray-Curtis similarities matrices.
A Pearson correlation coefficient was estimated in order to determinate the association between functional groups of fungi. This analysis was performed for both richness and abundance. Rarefaction curves were computed by Species Diversity and Richness 4.1.2 software (Seaby and Henderson, 2007). Graphics and ANOVA statistical analysis between diversity parameters was determined by GraphPad Prism 4.0 software (San Diego, CA).
26
CHAPTER III
27 Castanea sativa is a tree with major historical, economic and ecological importance in Portugal, in which high forest stands are located in the Northwest regions (Trás-os-Montes). The saprotrophic fungi Hypholoma fasciculare [currently designated as H. acutum (Sacc.) E. Horak 1971] is often found in these “soutos”, where is thought to be harmful to the soil fungal community associated to C. sativa (Baptista, 2007). According to previous results, the plant interactions established with this alleged antagonist may also be detrimental for chestnut tree sustainability, as reported on the study of Pereira et al. (2012). For studying the impact of H. fasciculare on chestnut tree development and soil fungal community present in chestnut orchards, the abundance of H. fasciculare carpophores that was witnessed between September 2002 and December 2005 was determinant to select the chestnut orchards to be studied. As we pretended to inoculate the soils with this fungus, soils from the orchard that presented the lowest abundance of H. fasciculare carpophores (Terroso, Bragança) were collected and used all over the work.
1. Impact of
Hypholoma fasciculare
on chestnut tree development
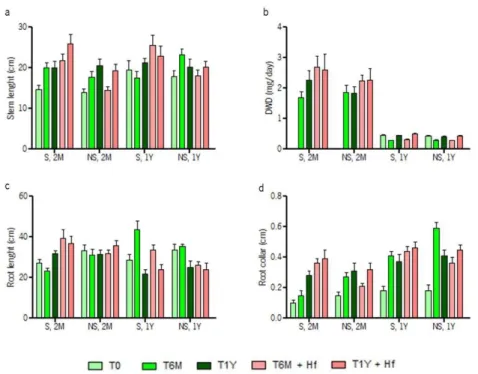
For evaluating the plant development and physiological conditions of plants growing in the presence of H. fasciculare (previous work performed by Pereira et al. unpublished data), chestnut plantlets were subjected to H. fasciculare infection (+Hf). These plants were grown in sterile (S) or non-sterile (NS) chestnut orchard soils; and plant samples were taken at differents periods – immediately before (T0), six months (T6M) or one year (T1Y) after inoculation (cf. figure 3, material and methods). Several growth parameters, such as stem and root lengths, daily increase of shoot dry weight (DWD), and root collar diameter were determined for evaluating plant development (table 6; figure 6).
As expected, a general increase of growth parameters occurred during the period of the experiment (differences detected between T0, T6M and T1Y samples), for both inoculated and non-inoculated chestnut plants, after two months upon transplantation (2M). When considering the plants that were inoculated one year upon transplantation (1Y) this increase was not always evident (table 6). For 2M chestnut plants, such increases were always more evident after H. fasciculare inoculation, specifically when using sterile soils (S) rather than non-sterile soils (NS). In older inoculated soils this patterns was also evident however with inferior differences. The higher stem lengths were detected in inoculated (S, 2M, T6M), (S, 2M, T1Y) and (S, 1Y, T6M) plants, which values were significantly higher (1.5-, 1.35- and 1.42-fold, respectively) than
28 the corresponding (NS, 2M, T6M), (NS, 2M, T1Y) and (N, 1Y, T6M) plants. While S plants displayed evident stem lenght increases after H. fasciculare inoculation (up to 1.29- and 1.46-fold in relation to non-inoculated plants, for 2M and 1Y plants, respectively), NS plants were negatively affected by H. fasciculare (up to 0.93- and 0.77-fold decrease in relation to non-inoculated plants, for 2M and 1Y plants, respectively) (figure 6a). These results are corroborated by the analysis of the DWD, where higher increases of about 1.2-fold (not significant) and 1.16-fold (significant) were detected after H. fasciculare inoculation in (S, 2M, T6M + Hf) and (S, 1Y, T1Y + Hf) plants, when compared to (NS, 2M, T6M + Hf) and (NS, 1Y, T1Y + Hf) plants, respectively (figure 6b). However, for this growth parameter a positive effect of H. fasciculare was noticed in both S and NS plants. For this growth parameter, a major difference between younger (2M) and older (1Y) chestnuts plants was evident, which is certainly due to the plant developmental stages studied that determines a higher daily increase on the dry weight in early development (2M) than in more advanced stages (1Y). Concerning the root length, the inoculated (S, 2M, T6M) plant exhibited significant higher length (1.7-fold higher) than its correspondent non-inoculated (S, 2M, T6M) plant. On the other hand, (S, 1Y, T6M + Hf) exhibited higher length (1.28-fold higher) than the correspondent (NS, 1Y, T6M + Hf) plant. Generally, 2M inoculated plants exhibited higher growth than the corresponding non-inoculated plants. In 1Y plants the inverse pattern was observed, inoculated samples appear to be negatively affected by H. fasciculare since non-inoculation samples exhibited higher root length (although not significant) in NS soils (figure 6c). Regarding the root collar diameter, a gradual increase was evidenced along the different times of chestnut growing, even though the soil condition (S or NS). However this increase was significantly higher in (S, 2M, T6M + Hf) comparing to its non-inoculated correspondent (S, 2M, T6M; 2.4-fold higer), but also to its non-sterile correspondent (NS, 2M, T6M + Hf; 1.71-fold higher). For (S, 2M, T6M) plants a significant decrease was evident when comparing with the correspondent non-sterile plant (NS, 2M, T6M; 0.56-fold lower). While 1Y plants, only (NS, 1Y, T6M) exhibited significant differences in both sterile correspondent (S, 1Y, T6M; 1.44-fold higher) and inoculated correspondent (NS, 1Y, T6M + Hf; 1.64-fold higher) (figure 6d). As controls, non-infected plants were studied in the same conditions. Therefore the overall results revealed that plants growing in previously sterile soil (S), whose inoculation was perfomed in chestnut plants transplanted two months ago, presented an increased growth that was more evident in the first six months upon inoculation (S, T6M + Hf). In plants grown on non-sterile soil (NS) there was no significant differences on the growth of C. sativa plants in inoculated
29 and control plants. This suggests that soil sterilization generally improve C. sativa root growth in the presence of H. fasciculare during the first six-months after inoculation. Afterwards, this effect seems to be dissipated. As in sterile soils a lower microbial diversity was detected, more nutrients may be ultimately available for C. sativa growing. This effect seems to be further improved by the presence of H. fasciculare within the first six months after inoculation. Indeed, in non-inoculated plants no significant differences were found on plant growth between sterile and non-sterile soil, but after H. fasciculare inoculation a statistically difference become evident. After one year of inoculation, the supression of root growth on chestnut plantlets growing in sterile soils, could be due to the development of a new microflora in those soils that could compromise the availability of nutrients.
On the other hand, in plants whose inoculation was performed after one year of transplantation (1Y), no evident differences in growth were detected, either in previously sterile or non-sterile pots, as well as in the presence or absence of H. fasciculare (table 6).
The occurrence of mycorrhization in Castanea sativa root tips was also evaluated by direct observation of ectomycorrhized root tips, followed by barcoding with ITS sequencing. The inoculation of H. fasciculare reduced the number of mycorrhized chestnut root tips of plants growing in S (up to 1.1- to 1.8-fold lower) and NS (up to 1.2- to 2.5-fold lower) soils, but also the diversity of morphotypes (figure 7) (Pereira et al., unpublished data), being mostly present the species Laccaria sp. (mainly in non-sterile soils) and Laccaria proxima (mainly in sterile soils). Therefore, the previous work performed by Pereira et al., (unpublished) suggested that the saprotrophic H. fasciculare do not seem to cause harm to chestnut plants, since a reduction of growth parameters was not detected, but could be rather advantageous for chestnut plants, in particular when they are growing in soils with a poor microbial community. However, a long term effect could still be occuring, since a decrease on ectomycorrhization and ECM diversity were observed. Concerning the comparison between S and NS soils, the percentage of mycorrhized roots was generally similar or lower in the sterile soil than in non-sterile ones (up to 1.1-fold lower). This pattern was the same for inoculated and non-inoculated C. sativa plants, and after six-months and one year following inoculation (figure 7).
![Table 7 – List of samples [type of soil (simple or mix), concentration of the DNA samples, and ratios estimated by NanoDrop ND-1000 (NanoDrop Technologies)] to perform DNA extraction](https://thumb-eu.123doks.com/thumbv2/123dok_br/17611590.820367/42.892.201.696.929.1093/samples-concentration-samples-estimated-nanodrop-nanodrop-technologies-extraction.webp)