Barbara Daniela Rocha Leite
Priming of a DNA metabarcoding approach
for species identification and inventory in
marine macrobenthic communities
Barbara Daniela Rocha Leite
Pr iming of a DN A me tabar coding appr oac h for species identification and in ventor y in mar ine macr obent hic communities
Universidade do Minho
Escola de Ciências
Master Thesis
Master in Molecular Genetics
Supervised by
Professor Doctor Filipe Oliveira Costa
Doctor Claudia Hollatz
Barbara Daniela Rocha Leite
Priming of a DNA metabarcoding approach
for species identification and inventory in
marine macrobenthic communities
Universidade do Minho
Escola de Ciências
A
CKNOWLEDGMENTS
I would like to address a few words to the ones who helped me through my academic journey and directly or indirectly contributed to this work.
Firstly, I would like to express my gratitude to my adviser, Professor Filipe Costa, for he instilled in me the greed to work in this area, and therefore made me challenge myself. A big thanks for your orientation, piece of advice, all the knowledge transmitted, patience, availability and promptness. Your honesty and encouragement as well as your support were the key to the development of my critical thinking and essential to my success. To you a huge thanks.
Secondly, to Claudia Hollatz for all the knowledge transmitted, all the patience, availability and dedication to help me when I need. Thank you for your sympathy, friendship and cheeriness. Since day one you helped me in the lab and your guidance was remarkable. It was a pleasure working with you!
To Dr. Conceição Egas, Dr. Hugo Froufe and Jorge Lobo for the collaboration in the project. Thank you for the availability, technical support and sharing of ideas.
To my lab colleagues for the companionship and the good moments we spent.
To Susana, Jéssica, Benedita and Marina for being there when I need. Thank you for the support during this journey and for the awesome moments we have spent. I never forgot my “Milho companheiras” who managed to put a smile on my face when times were tough. Your friendship has been important and I hope it prevails for the rest of our lives.
To my mother, father and sister. Though the distance and sacrifices were hard, they were important on my development as a person. You made me who I am. The pride you always shown, permanently encouraging me to pursue my goals were of the utmost importance. A special thanks to my little nephew for all the laughter, cries and our special cu-cu moments. For my grandfathers: I promise “to behave nicely”. To them and to all my family in general an eternal thank you.
To José, who always believe in me. Thank you for your dedication, piece of advice and specially for the patience at the end of this journey. Thank you for your friendship and all the happiness that you bring to my days. Thanks for all your love. Thanks for everything!
The present study was financed by FEDER through POFC-COMPETE, in the scope the project FCOMP-01-0124-FEDER-015429 funded by “Fundação para a Ciência e a Tecnologia” (FCT), Portugal. Work at CBMA was supported by FCT I.P. through the strategic funding UID/BIA/04050/2013.
Priming of a DNA metabarcoding approach for species identification and
inventory in marine macrobenthic communities
A
BSTRACT
In marine and estuarine benthic communities, the inventory and estimation of species richness are often hampered by the need of broad taxonomic expertise across several phyla. The use of DNA metabarcoding has emerged as a powerful tool on the fast assessment of species composition from whole environmental communities. Yet, specifically designed methodologies for marine and estuarine macrobenthic communities are still lacking. Here we tested the amplification success of five primer sets targeting different COI-5P regions with fragments ranging from 310 to 658 bp. To this end, we used two simulated macrobenthic communities (SimCom1 and 2), each community containing the same number of species (21), but different number of specimens (SimCom1: 21; SimCom2: 67). Sequences were generated using high-throughput sequencing on 454 platform and species identification were first performed against a compiled reference library of macrobenthic species. In order to achieve new identifications at species level, which had no representation in the reference library, two public databases, BLASTn and BOLD-IDS, were used to rerun those sequences with similarity between 70-97%. Interestingly, amplicons of 313 and 658 bp were equally successful on the detection of species in SimCom1 (≈62%), while for SimCom2 the highest success rate were obtained using a 418 bp fragment. However, the combination of the five primer sets was able to detect more sequences than any primer set alone, achieving 85% of represented species in SimCom1 and 76% in SimCom2, across all analysed marine phyla (Annelida, Arthropoda and Mollusca). Unrepresented species were also detected in these
communities, such as algae and the mussel parasitic copepod Mytilicola intestinalis. We
demonstrated that the application of combined primer sets coupled with high-throughput technologies has a great potential to overcome the challenges on marine bioassessment, and inventory, including the detection of a “hidden” biodiversity that could not possibly be identified based on morphology.
Desenvolvimento da técnica de DNA metabarcoding para identificação e
inventário de espécies em comunidades macrobentónicas marinhas
R
ESUMO
O inventário e a estimativa da riqueza de espécies, em comunidades bentónicas marinhas e estuarinas, são frequentemente dificultados pela necessidade de um amplo e especializado conhecimento taxonómico dos diversos filos. A utilização de DNA metabarcoding surgiu como uma ferramenta poderosa para uma rápida avaliação da composição das espécies constituintes das comunidades ambientais. No entanto, ainda falta conceber metodologias especificamente desenhadas para comunidades macrobentónicas marinhas e estuarinas. No presente estudo, testou-se o sucesso de amplificação de cinco pares de primers referentes a diferentes regiões do gene COI-5P com fragmentos que variam entre 310 a 658 pb. Com esta finalidade, usou-se duas comunidades macrobentónicas simuladas (SimCom1 e 2), cada comunidade contendo o mesmo número de espécies (21), mas um diferente número de espécimes (SimCom1: 21; SimCom2: 67). Usou-se a sequenciação de alto débito na plataforma 454 para gerar sequências e a identificação de espécies foi primeiramente realizada contra uma biblioteca de referência compilada de espécies macrobentónicas. De modo a obter-se novas identificações ao nível da espécie, que não tinham representação na biblioteca de referência, foram usadas duas bases de dados públicas, BLASTn e BOLD-IDS, para executar novamente as sequências com similaridades entre 70-97%. Curiosamente, os amplicões de 313 e 658 pb foram igualmente bem-sucedidos na deteção de espécies na SimCom1 (≈62%), enquanto que para SimCom2 obteve-se a maior taxa de sucesso utilizando o fragmento de 418 pb. No entanto, a combinação dos cinco pares de primers foi capaz de detetar mais sequências do que qualquer par de primers por si só, obtendo-se 85% das espécies repreobtendo-sentadas em SimCom1 e 76% em SimCom2, em todos os filos marinhos analisados (Annelida, Arthropoda e Mollusca). Nas comunidades simuladas também foram detetadas espécies que não estavam representadas, como algas e o copépode parasita de
mexilhões Mytilicola intestinalis. Este estudo demonstrou que através da aplicação de
viii
para ultrapassar os desafios da avaliação e do inventário da biodiversidade marinha, incluindo a deteção de biodiversidade “escondida”, a qual não seria possível identificar através da morfologia.
Palavras-Chave: DNA barcoding, Sequenciação de alto débito, Avaliação da biodiversidade,
C
ONTENTS
Acknowledgments ... iii
Abstract ... v
Resumo ... vii
List of Figures ... xi
List of Tables ... xiii
List of Abbreviations and Acronyms ... xv
1. Introduction ... 1
1.1 DNA barcodes in taxonomic identification of species ... 1
1.2 DNA metabarcoding ... 11
1.3 Aim of the thesis ... 17
2. Materials and Methods ... 19
2.1 Overview of the global approach and experimental design ... 19
2.2 Preparation of the simulated macrobenthic communities ... 20
2.3 DNA extraction ... 21
2.4 PCR amplification of the full and partial fragments of the COI-5P barcode ... 21
2.5 High-throughput 454-pyrosequencing protocol ... 23
2.6 Data processing and analyses ... 24
2.6.1 Reference library compilation ... 24
2.6.2 In silico evaluation of the discriminatory capacity of COI-5P fragments ... 24
2.6.3 High-throughput data processing ... 25
3. Results ... 27
3.1 In silico analysis of the impact of fragment size on species discrimination ability ... 27
3.2 Sequenced-based species identification through HTS ... 36
3.2.1 Global appraisal of HTS output ... 36
3.3 Assessing the comparative success of primer pairs in taxa detection from simulated macrobenthic communities ... 38
x
3.3.1 Differential taxa detection among the primers and simulated macrobenthic
communities ... 38
3.3.2 Taxa recovery success rates among the simulated macrobenthic communities . 40 3.4 Detection of species not listed in the simulated communities ... 42
4. Discussion ...45
5. Conclusion ...53
References ...55
L
IST OF
F
IGURES
Figure 1 Overview of the 454 sequencing technology. A – Library preparation. B – Fragments bound to beads (1:1). C – Emulsion PCR amplification. D – Load the beads onto the PicoTiterPlate device (1:1). E – Pyrosequencing reaction of 454 Sequencing Systems.
Adapted by http://454.com/. 13
Figure 2 Map of the human mitochondrial genome (16 569 bp). The black circle highlights the
COI gene. Taanman, 1999. 14
Figure 3 Schematic representation of the experimental design used in this study for testing the application of the metabarcoding approach to species identification in macrobenthic communities. SimCom1 – Simulated Community 1; SimCom2 – Simulated Community 2.
19 Figure 4 Schematic representation of the amplicons and their size, generated after PCR
amplification. The COI-5P barcode and the five primer pairs that were used in PCR
amplification within the standard barcode are represented. 23
Figure 5 Number of specimens per phyla (A) and number of taxon names present in COI-5P
reference library for seven representative phyla (B). 27
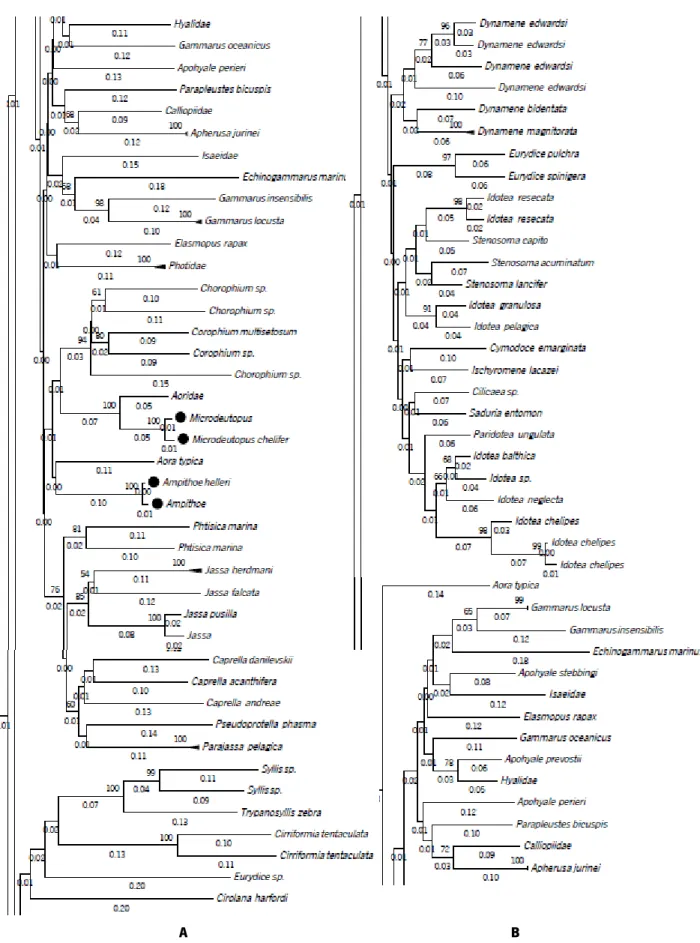
Figure 6 Phylogenetic NJ tree created from 315 sequences of A - full COI-5P DNA barcodes (658 bp) and B - short COI-5P fragments (158 bp) of our reference library. The NJ method was used and the node support was assessed through 1000 bootstrap replicates. - Species non discriminated by morphological analyses and species non discriminated in
phylogenetic tree. 29
Figure 7 Phylogenetic NJ tree created from 315 sequences of COI DNA barcodes reference library clipped with the primer pairs. A – ArF2/LoboR (418 bp); B – invF/LoboR (470 bp); D – mlCOIintF/LoboR (313 bp); E – ArF2/ArR5 (310 bp). The Neighbor Joining (NJ) method was used and the node support was assessed through 1000 bootstrap replicates. - Species non discriminated by morphological analyses and species non discriminated in
xii
Figure 8 Sequence reads abundances generated by 454 pyrosequencing for two simulated
macrobenthic communities. 37
Figure 9 Number of sequenced reads generated by 454 pyrosequencing for each of the 21
species of three phyla and each of the two simulated macrobenthic communities. 38
Figure 10 Global success rate of species detection of simulated macrobenthic communities. 40 Figure 11 Recovery success rate and number of species detected for each of the five primer
pairs in the two simulated macrobenthic communities. 41
Figure 12 Accumulation curve of number of taxa successfully recovered by each primer set in
L
IST OF
T
ABLES
Table 1 Applications of DNA (meta)barcoding approach for various loci and a broad range of organisms, compiling different studies. ... 7 Table 2 Taxonomic classification and distribution of the 21 marine macrobenthic species among the two different simulated macrobenthic communities. SimCom1 – Simulated Community 1; SimCom2 – Simulated Community 2; n – number of specimens per species. ... 20 Table 3 A - Primers used for PCR amplification of fragments of COI-5P gene from the two
different simulated communities and B - PCR primer combinations and respective thermal cycling conditions for the five primer pairs. ... 22 Table 4 Species detection (1) or failed detection (0) for each primer pair after HTS of SimCom1
and SimCom2. Dark grey: species that was detected with the five primers in the two simulated communities; Light grey: the two species that were not detected with any of five primer pairs in the two simulated communities. A – primer pair ArF2/LoboR; B – primer pair invF/LoboR; C – primer pair jgLCO1490/jgHCO2198; D – primer pair
mlCOIintF/LoboR; E – primer pair ArF2/ArR5. ... 39 Table 5 Detected taxa after the sequence similarity search in public databases (at 97%) that
were not listed in the simulated communities. P: primer pair used: A – ArF2/LoboR; B – invF/LoboR; C – jgLCO1490/jgHCO2198; D – mlCOIintF/LoboR; E – ArF2/ArR5. R: number of sequence reads generated by 454 pyrosequencing. ... 43
L
IST OF
A
BBREVIATIONS AND
A
CRONYMS
µL Microliter
AMBI AZTI’s Marine Biotic Index
ATP Adenosine triphosphate
BIN Barcode Index Number System
BLAST Basic Local Alignment Search Tool
BOLD Barcode of Life Database
BOLD-IDS Barcode of Life Database Identification System
BOLI Barcode of Life Initiative
bp Base pairs
CBOL Consortium for the Barcoding of Life
COI-5P 5’ end of the Cytochrome c Oxidase subunit I gene
DDBJ DNA Data Bank of Japan
DMSO Dimethyl Sulfoxide
DNA Deoxyribonucleic Acid
dNTPs Deoxynucleotide
dNTPs Deoxyribonucleotide Triphosphates
EMBL European Molecular Biology Laboratory
g Gramme
HTS High Throughput Sequencing
iBOL International Barcode of Life
ITS Internal Transcribed Spacer
K2P Kimura 2-Pameter
matK Maturase K
mL Mililiter
NCBI Nacional Center for Biotechnology Information
NJ Neighbor-Joining
xvi
OTU Operational Taxonomic Unit
PCR Polymerase Chain Reaction
PPI Pyrophosphate
rbcl Ribulose-biphosphate Carboxylase
RFLP Restriction Fragment Length Polymorphism
RNA Ribonucleic Acid
SimCom Simulated Communities
WFD Water Framework Directive
1. I
NTRODUCTION
The estimation of species richness and the recognition of the interactions with ecosystem functioning are essential to understand global biodiversity. Likewise, the impact of environmental change and anthropogenic disturbances need to be identified and mitigated to maintain a healthy environment and sustainable economy. However, the questions concerning to the historical genetic structure and identification of species remain a mystery (Bik et al., 2012).
The total number of extant species in the world is approximately 100 million (Chapman,
2009). However fewer than two million have been formally known (Fonseca et al., 2010) and
despite being an estimate, there is a redundancy in descriptions of many species names (Paterson et al., 2010). There is still a huge gap in our knowledge of biodiversity, the task of cataloguing all biological diversity faces primary problems, such as lack of resources, expertise and novel approaches to identify new taxa. This problem has been commonly referred by the scientific community as “taxonomic impediment” (Rodman and Cody, 2003). Additional conceptual and operational challenges to understand the complexity of biological diversity emerged from the inability of the researchers to find universal criteria for species recognition (Costa and Antunes, 2012).
The taxonomists work have been underestimated and the maintenance and development of infrastructures are needed (Bouchet, 2006). Technological developments and global initiatives are on demand to perform a profound change on taxonomy, increasing their influence in society (Wheeler, 2008).
1.1 DNA barcodes in taxonomic identification of species
Taxonomy is a scientific discipline responsible for identification, description and classification of biodiversity to define groups of species based on their common characteristics
(Costa and Antunes, 2012; Padial et al., 2010). Over the years, taxonomists were capable to
describe and to catalogue species. The first method implemented for species identification was
based on easily observable morphological characteristics (Taberlet et al., 2012). Expert
2
phenotypic plasticity and genetic variability of the species (Hebert et al., 2003a). Furthermore, the study of cryptic species (morphologically indistinguishable species) (Costa and Antunes, 2012), early developmental stages (eggs and larvae), parts of specimen bodies (e.g. one leg) or
semi-digested samples (e.g. gut contents) (Lindeque et al., 2013) were limited due to the necessity of
high level of expertise and the limitations of morphological keys, which were often effective only for a particular life stage (Hebert et al., 2003a).
The taxonomic challenge posed by cryptic species has been recognized for nearly 300 years (Bickford et al., 2007), similar morphology presented between species may lead to wrong species identification. For example, Herbert and collaborators (2004) revealed that previously considered single species with a large distribution range were indeed several species with seemingly morphologically identical adults but different juveniles with preference for different resources. Also,
a study developed with the polychaete Eurythoe complanata demonstrated that this species was
previously considered like a cosmopolitan single species, presenting a great morphological similarity with a wide geographic distribution, and through molecular analysis demonstrated the existence of ambiguities and high levels of genetic divergence, after being categorized as cryptic species (Barroso et al., 2010). Thus, the morphological taxonomic techniques may not reveal this “hidden” biodiversity and a significant proportion of diversity can be underestimated (Costa and Antunes, 2012). Therefore, the use of morphological approaches for routine species identification are complicated, it demands time and expertise across different phyla (Corell and Rodríguez-Ezpeleta, 2014). The advent of molecular techniques has given biologists a new tool for detecting biodiversity to overcome this operational constraints.
Over the past years several approaches has been developed to utilize DNA-based species
identification (Lindeque et al., 2013). In 1980, methods were proposed for species identification
based on DNA hybridization (Southern Blots and RFLP). Few years later, studies using DNA-based species identification significantly expanded by PCR-based amplification of DNA and the design of primers (Taberlet et al., 2012). DNA-based approaches revealed to be a source of information that allows access to biodiversity beyond morphology. This approach also demonstrated to be a tool which enables species identification to non-taxonomic experts. However these proposed methods also have disadvantages as expensive, time consuming and fail in the detection of taxa present in low abundance (Costa and Antunes, 2012).
In 1977 the Sanger sequencing emerged and enabled to recover sequence data from single
specimen at a time (Sanger et al., 1977). The advent of Sanger DNA sequencing technology
allowed the application of genomic approaches to taxon diagnosis using DNA sequences to identify organisms. Furthermore, Sanger sequencing led to large-scale, broad-scope biosystematics projects with a wide range of applications (Shokralla et al., 2012).
More recently, in 2003, developments in DNA technology led to a complement of taxonomy through the use of new genomic approaches for taxon diagnosis to identify species (Blaxter et al., 2005; Costa and Antunes, 2012). Paul Hebert and colleagues developed DNA barcoding approach. They used a relatively short sequence (i.e. approximately 650 bp) of a eukaryotic genome standardized zone (e.g. COI), named as DNA barcodes, as a molecular tag to generate vast DNA libraries for species identification in many taxa. In DNA barcoding approach, after DNA extraction is necessary to perform DNA amplification with barcoding primers and then proceed to sequencing. Finally, a sequence-based taxonomic identification via standard reference databases of known
organisms is performed (Hebert et al., 2003a). The primers designed to DNA barcoding are
versatile primers that are used in PCR amplification based on a single barcode within a short variable DNA region, target the same locus, and applied to different taxa found universally across
diverse phyla (Lobo et al., 2013; Taberlet et al., 2012). The use of these primers is huge
importance to barcoding success in species identification, in order to have high resolution of
taxonomic discrimination to improve the efficiency of taxon detection (Leray et al., 2013).
Therefore, this method intended to facilitate and increase the biodiversity discovery, in order to transform our ability of species identification in a practical and objective approach (Costa and Antunes, 2012).
Thereby, DNA barcoding approach shows to be universal (the same pattern to all organisms), rapid, rigorous, objective and practical. This molecular tool can improve conventional approaches limitations by allowing species identification in any stage of the life cycle and in analysis of gut
contents and excreta (Hebert et al., 2003a). The emergence of these technology also help the
resolution of the taxonomic impediment with the ability to faster a practical catalogue and describe biological diversity (Costa and Antunes, 2012; Teletchea, 2010). Moreover, further examination of divergent taxa can now allow the detection of morphological, ecological and behavioral differences (Lobo et al., 2015), going beyond the taxonomy. DNA barcoding has a broad scientific applications,
4
different groups of taxonomists, in wide target taxa (Stoeckle, 2003). Research projects on birds
(Hebert et al., 2004), fish (Costa et al., 2012), algae (Le Gall and Saunders, 2010), benthic
macroinvertebrates (Costa et al., 2007), macrofauna (Knox et al., 2012), meiofauna (Fonseca et al., 2010) and others taxonomic groups has been performed.
The application of DNA barcoding approach should take into account certain criteria in order to improve the limitations of morphologic identification. In DNA extraction the resistance to DNAse digestion can be a problem. In environmental samples, the extracellular DNA is adsorbed contrary to free DNA leading to the exchange of cell lysis step by a saturated phosphate buffer (Taberlet et al., 2012). Furthermore, the presence of additional taxa or decaying organic matter in sample can
inhibit PCR and sequence reactions (Creer et al., 2010). The species characteristics are also
important factor for achieving an efficient DNA extraction. For example, the molluscs are an important group of organisms which are challenging to perform DNA extraction due to the high
amount of mucopolysaccharides in their tissues that inhibit polymerase activity (Barco et al.,
2015).
The efficiency of the PCR amplification protocol is a critical step for barcoding successfully studies because they can introduce biases during amplification. The formation of PCR-induced chimeras is one of the most commonly source of sequence artifacts. Chimeras are produced when incomplete extension occurs during PCR amplification and the resulting amplicon fragments acts as a primer for a different sequence, leading to occurrence of false diversity estimates (Bik et al.,
2012; Corell and Rodríguez-Ezpeleta, 2014; Creer et al., 2010; Fonseca et al., 2012). These
negative effects can be minimized through PCR optimization and bioinformatics software
developments (e.g. Perseus, Quince et al., 2011) (Fonseca et al., 2012). When PCR reaches the
plateau phase, drive by the use of PCR cycles with a fast ramping rate, heteroduplex formation can
occur which give artificial gene diversity (Kurata et al., 2004). The coamplification of divergent
heteroplasmic copies of mitochondrial DNA can overestimate the number of unique species,
introducing biases (Song et al., 2008). The annealing temperature, by reducing at lower
temperatures (Ishii and Fukui, 2001) and the number of replication cycles, by keeping low the
number of cycles (Qiu et al., 2001) are important parameters to reduce bias of primer binding.
Also, the use of high template concentrations, intelligent primer selection and mixed replicate reaction preparations can be reduce the PCR-induced biases (Shokralla et al., 2012).
The sequenced gene region should be identical between specimens but different between species. Furthermore, the ideal gene target must be sufficiently conserved to be amplified with broad-range primers (Stoeckle, 2003). Many different nuclear and organellar DNA regions can be targeted for DNA amplification and sequencing (Taberlet et al., 2012). The genetic markers that can be used are the nuclear ribosomal RNA gene (12S, 16S and 18S), nuclear gene ITS (internal
transcriber spacer), chloroplast genes matK (maturase K) and rbcl (ribulose-biphosphate
carboxylase), and the mitochondrial gene COI (cytochrome c oxidase subunit I) (Stoeckle, 2003). The 16S is commonly used in studies of bacteria identification (e.g. Sogin et al., 2006) (Shokralla et al., 2012). Fungi contain introns in mitochondrial gene, however applying reverse transcription
in conjunction with PCR, ITS can be used for identification of fungi species (e.g. Nilsson et al.,
2008; Seifert, 2009) (Begerow et al., 2010). In plants, matK, rbcl and ITS can used to target for barcoding, due to the low sequence variation in mitochondrial DNA of plants (e.g. CBOL Plant Working Group, 2009) (Stoeckle, 2003). The COI and 18S are widely applicable in animal barcoding (e.g. Folmer et al., 1994; Fonseca et al., 2014) (Corell and Rodríguez-Ezpeleta, 2014). Besides the fact that is important to have consensus for universal barcodes, sometimes flexibility is needed in the marker choice. In nematodes, studies recognized that COI is inappropriate due to sequence diversity (Deagle et al., 2014). Also, there are similar problems for plant barcodes, due
to the low level of variability and low variation in phylogenetic markers (e.g. Cho et al., 2004)
(Chase et al., 2005).
The analysis of DNA barcode sequences involves three important steps. The first step is the sequence alignment to compare corresponding loci and the second is the construction of phylogenetic trees, using clustering methods such as Neighbor Joining (NJ) method (Saitou and Nei, 1987), to evaluate genetic distances among species (La Rosa et al., 2013). The last step is processing data generated by DNA sequencing approaches to make different analyses. The barcode-based identifications of unknown organisms relies on the ability to match a given sequence
to a library of reference barcodes based on known species (Hajibabaei et al., 2011). Recently
diverged species or the appearance of new species, through hybridization, difficult sequence-based species identification due to the intraspecific and interspecific genetic variation, which differ between groups of species (Stoeckle, 2003). The ability to quantify the absolute abundance of individuals based on sequence read counts is sometimes a problem. The variation in the number
6
variation in tissue cell density makes impossible species identification from sequence read data (Aylagas et al., 2014; Bik et al., 2012). Adopting bioinformatics approaches, by using recovering sequences to operational taxonomic units (OTU), can reduce the barcoding inefficient caused by
the large magnitude of taxonomic coverage (Creer et al., 2010; Deagle et al., 2014). Therefore,
the analysis of molecular data is only based on the presence/absence of taxa.
DNA barcoding approach has some disadvantages. As referred above, amplification of nuclear copies of DNA mitochondrial and chloroplastidial fragments (Song et al., 2008), chimeras (Fonseca et al., 2012) or heteroduplex formation (Kurata et al., 2004) are examples of limitations that can lead to misidentification and, consequently, statistical problems. Furthermore, the use of single-locus for preliminary barcode-based species delineation can lead to complications, such as incomplete lineage sorting. In these cases, the analysis of single-locus data, should be considered as OTU (Kekkonen and Hebert, 2014). OTU are clusters of species which allows in taxa identification through sequence identity (Bik et al., 2012; Blaxter et al., 2005). The Barcode Index Number System (BIN) is an analytical method that apply clustering algorithms creating a structured registry for OTU recognition, and sequences are automatically assigned to a BIN on the BOLD Workbench (http://www.boldsystems.org/). Considering that each specimen has one assigned name, creating a global exclusivity of names, the objectivity of DNA barcoding studies increase (Ratnasingham and Hebert, 2013).
Technological advances in taxonomy are not the solution to species identification problems. Contrariwise, the complementation of conventional approaches with DNA barcoding can have impact on the scientific community and enhance the species discovery (Costa and Antunes, 2012).
Table 1 Applications of DNA (meta)barcoding approach for various loci and a broad range of organisms, compiling different studies.
Key-applications Description Reference
18S
Marine metazoan communities; HTS Analysis of links between ecosystem structure and function and phyletic diversity of meiofuanal communities
Fonseca et al., 2010 Zooplankton; HTS Study of diversity and species richness of zooplankton communities Lindeque et al., 2013 Meiofauna; HTS Macroecology studies of meiofaunal communities and evaluation of
diversity levels
Fonseca et al., 2014 Marine metazoan communities; Biomonitoring; HTS Evaluation of the quality of marine benthic ecosystems by comparing
morphological and eDNA/RNA-based inventories Lejzerowicz et al., 2015
COI
Invertebrate phyla; “Universal” primers design “Universal” primers design to amplify COI gene from metazoan invertebrates
Folmer et al., 1994 DNA barcoding approach Development of DNA barcoding approach, based on COI gene, for
species-level assessment and identification
Hebert et al., 2003a Birds Identification of birds species and determination of intra- and
interspecific differences
Hebert et al., 2004 Lepidoptera; Cryptic-species Identification of Astraptes fulgetor butterfly, with the combination of
morphological and molecular tools Hebert et al., 2004 Moth; Wasp; Mini-barcodes sequences Identification of moth and wasp museum species using short barcode
sequences
Hajibabaei et al., 2006 Ciliate protozoa Species identification and variability studies of Tetrahymena thermophila
8
Crustacea Identification of Crustacea at order- and species-level Costa et al., 2007 Holozooplankton; Biomonitoring; Identification and recognition of holozooplankton species Bucklin et al., 2010 Benthic macroinvertebrate communities;
biomonitoring; Biomonitoring of freshwater benthic macroinvertebrate taxa Hajibabaei et al., 2011 Benthic macroinvertebrates; Non-destructive source of
DNA; Multiplex PCR strategy; HTS
Evaluation the ability of non-destructive DNA access and a multiplex PCR approach for biodiversity analysis of benthic macroinvertebrates
Hajibabaei et al., 2012 Macrofauna of deep-sea; MOTUs Quantification and comparison diversity of macrofauna of deep-sea
habitats
Knox et al., 2012 Soil extracellular DNA; New sampling and extraction protocols for DNA metabarcoding analyses
of soil extracellular DNA
Taberlet et al., 2012 Arthropods; Biomonitoring; Biodiversity assessment;
HTS
Detection of arthropod taxa and estimation of diversity metrics Yu et al., 2012 Top-shells (gastropods) Identification of gastropods (Gibbula sp.) providing a consistent data set
of COI sequences Barco et al., 2013
Marine invertebrates; Newly primers design Redesign of PCR Folmer primers: jgLCO1490/jgHCO2198 for
amplification of COI gene of marine invertebrates Geller et al., 2013 Marine metazoan; Newly primer design mlCOIintF primer design and combination with jgHCO2198 for
amplification of COI gene of marine metazoan diversity
Leray et al., 2013 Marine metazoan communities; Newly primers design LoboR/F primers design for amplification of COI-5P gene of marine
metazoan species Lobo et al., 2013
Copepods Identification of marine copepods and reliability and resolution analysis of statistical approaches
Blanco-Bercial et al., 2014 Lepidoptera; HTS Application of HTS technologies for parallel acquisition of DNA barcodes
Polychaeta Evaluation of the performance of DNA barcodes in discrimination of polychaete
Lobo et al., 2015
Multi loci
Marine invertebrates; Gut contents Study of macrophagous and microphagous diet. Amplification of COI for analysis of animals ingested and 18S for analysis of lesser eukaryotes ingested
Blankenship and Yayanos, 2005
Nematode communities; HTS Identification and diversity assessment of nematode species, amplifying small and large subunit of rRNA
Porazinska et al., 2009 Aquatic macroinvertebrate communities;
Biomonitoring; HTS
Species-level identification, based on COI and Cytochrome B of mtDNA, to diagnostic biomotoring of aquatic ecosystem
Carew et al., 2013 Marine macroinvertebrates; Biomonitoring Presence/Absence species evaluation using genetics based AMBI to
amplify COI and 18S gene
Ayalagas et al., 2014 Zooplankton; DNA extraction Alternative DNA extraction protocol for metabarcoding analysis, based on
18S and COI, on zooplankton communities
Corell and Rodríguez-Ezpeleta, 2014 Arthropod macrobiome; microbiome; HTS Utilization of 16S, 18S and COI to test detection capacity of arthropods
and microbiome from bulk sample
Gibson et al., 2014 Seagrass communities; Invertebrate communities;
Biomonitoring Identification and diversity estimation of invertebrate taxa associated with seagrass communities by comparing morphological and molecular inventories (based on COI and 18S)
10
The DNA barcode impact on life cataloging emerge global project focus on a wide range of species. The Barcode of Life Initiative (BOLI) began with the proposal of the DNA barcoding approach (2003). DNA barcodes are used to access biodiversity information, and consequently to build a new system for species identification – an open access database of reference barcodes (Costa and Antunes, 2012; Costa and Carvalho, 2010).
The Consortium for the Barcoding of Life database (CBOL - http://www.barcodeoflife.org/) implement DNA barcoding to promote a global scale genomic project, such as Marine Barcode of Life (MarBOL - http://www.marinebarcoding.org/), collaborating with a variety of institutions (Costa and Antunes, 2012). At present, CBOL involve 200 Member Organizations from 50 countries, which promotes barcoding through research groups, networks, workshops, conferences and training. The CBOL aims explore and develop DNA barcoding potential to species identification through the link of CBOL’s taxonomic data to publicly accessible sequences and the development of barcoding to make it more cheaper, faster and portable (Deagle et al., 2014). Actually, the public access to DNA barcoding data are possible on Barcode of Life Database (BOLD - http://www.boldsystems.org/), GenBank of National Center for Biotechnology Information (NCBI - http://www.ncbi.nlm.nih.gov/genbank/), European Molecular Biology Laboratory (EMBL - http://www.embl.org/) and DNA Data Bank of Japan (DDBJ - http://www.ddbj.nig.ac.jp/). BOLD database has allowed an improvement in taxonomic identification through providing barcode sequences and their association to other taxonomic data (e.g. geolocation data). To avoid the conflicting and dispersal data among databases, informatics tools allow databases collaboration, such as World Register of Marine Species (WoRMS, Worms Editorial Board, http://www.marinespecies.org/).
In 2010 was launched the International Barcode of Life project (iBOL - http://www.ibolproject.org/). This is a global project that use DNA barcodes as a tool for identifying known species and discover new ones in order to apply in such areas: forensics, conservation, diseases control and ecosystem monitory (Taberlet et al., 2012). The aim of the project is barcode a five million specimens, in order to construct a parameterized DNA barcode reference library for 500 000 eukaryotic species until 2015.
The contribution of DNA barcoding to technological, organizational and conceptual developments lead to improved taxonomy and to discover new species, without need of
morphological descriptions, increasing the capacity of efficiently manage ecosystems and monitory and recognize biodiversity (Costa and Antunes, 2012). Furthermore, the genetic techniques generated are cheaper, faster and more accurate taxonomic identification (Corell and Rodríguez-Ezpeleta, 2014).
1.2 DNA metabarcoding
Identification of multiple species, in a single experiment, from a single complex environmental sample is an extension of the barcoding concept and has been referred as DNA
metabarcoding (Taberlet et al., 2012; Taberlet et al., 2012). DNA metabarcoding overcomes
standardized DNA barcoding difficulties: identification of single specimens, DNA needs to be more or less intact and requires the isolation of specimens, which is time consuming and difficult. Also, the products obtained from DNA barcoding are generally sequenced by Sanger method, while in metabarcoding the mixed products are sequenced by high throughput sequencing technologies (Corell and Rodríguez-Ezpeleta, 2014). Therefore, the goal of DNA metabarcoding is identify taxa at species level, using a large number of samples (Taberlet et al., 2012).
Using high-throughput sequencing (HTS) in metabarcoding studies, a single bulk sample containing the entire organisms of an environmental community can be analyzed (Taberlet et al., 2012). Furthermore, this sample can also include degraded DNA (such as soil, water, faeces or
originates from cell lysis) (Taberlet et al., 2012). Comparing microbiota in healthy and disease
individuals (Chen et al., 2014), inferring ecosystem healthy (Hajibabaei et al., 2011), study ancient DNA (Sønstebø et al., 2010) or analyze diets from DNA fragments (Deagle et al., 2009) are some examples of HTS applications.
Since 2005, the appearance of HTS has been improvements in sequencing output, decreasing the costs and time consuming and reducing sources of PCR bias (Mardis, 2008; Shendure and Ji, 2008), enabling the utilization of HTS in a variety of applications. Access to massive amounts of sequencing data and improvements in read length leading to a better
representation of sample diversity (Shokralla et al., 2012). For example, Sogin and colleagues
(2006) using 16S as specific gene marker and applying HTS approach were able to analyze DNA sequence data from marine microbial community.
12
The available HTS technologies can be classified into two categories: PCR-based
technologies and single-molecule sequencing (Shokralla et al., 2012). The commonly used HTS
platforms for PCR-based technologies as, for example, Roche 454 Genome Sequencer (Roche Diagnostics Corp., Branford, CT, USA) or HiSeq 2000 (Illumina Inc., San Diego, CA, USA). The HeliScope (Helicos BioSciences Corp-, Cambridge, MA, USA) or PacBio RS SMRT system (Pacific Biosciences, Menlo Park, CA, USA) are systems used for single-molecule sequencing (Shendure and Ji, 2008). The rapid progress on HTS technologies led to the emergence of various sequencing systems. Due this, depending on the ecological research platforms should be appropriate (Shokralla et al., 2012).
The 454 Genome Sequences (www.454.com) was the first HTS technology which allowed sequencing 400-600 million bp per run with 400-500 bp sequence lengths in a single experiment by using real-time sequencing-by-synthesis pyrosequencing technology, increasing the sequencing capacity (Costa and Antunes, 2012). This is more five orders of magnitude than in traditional
Sanger sequencing (Taberlet et al., 2012). In this technique (Figure 1), after DNA amplification
from environmental samples, the DNA fragments are bound to beads, one fragment per bead (1:1 proportion), the beads are isolated individually and occurs emulsion PCR (oil micro-reactors that contain PCR components). The emulsion is broken, the DNA strands are denaturated and beads are individually deposited into well of fiber-optic slide. Beads carrying immobilized enzymes are sequenced and deposited into each well. The complementary strand is synthetized enzymatically to detect which base is added at each step. One of the four dNTPs (deoxynucleotides) is added to DNA and DNA polymerase incorporates the complementary to template. This incorporation releases PPI stoichiometrically. Then, ATP sulfurylase converts PPI (pyrophosphate) to ATP (adenosine triphosphate) acting as fuel to mediate the conversion of luciferin to oxyluciferin. This reaction generate visible light which is detected by a camera and analyzed in a program. Finally the reaction can start again with another nucleotide and ends when DNA sequence of the single stranded template is determined (Rothberg and Leamon, 2008).
Figure 1 Overview of the 454 sequencing technology. A – Library preparation. B – Fragments bound to beads (1:1).
C – Emulsion PCR amplification. D – Load the beads onto the PicoTiterPlate device (1:1). E – Pyrosequencing reaction of 454 Sequencing Systems. Adapted by http://454.com/.
The main advantages on the use of HTS-metabarcoding approaches are the long read length produced in a relatively short time, capability to apply bioinformatic tools and the low chances of
premature chain termination and non-simultaneous extension (Hajibabaei et al., 2011).
Furthermore, due to determination of taxon detection and identification efficiency, the success of this approach relies on the primer sets used and the target loci (Leray et al., 2013).
The genetic markers that can be used to DNA metabarcoding studies are the same as used in barcoding (referred in 1.1 section). The past taxonomic analysis is focused on nuclear genes, especially in 18S. Developed studies demonstrated that this nuclear region have a prevalence of insertions, which can introduce bias during PCR amplification, deletions, that can complicate
14
sequence alignments, and reported problems associated to recombination (Hebert et al., 2003a; Stoeckle, 2003). Furthermore, morphology-based identification and DNA metabarcoding approach rely on 18S gene, using meiofaunal taxa, showed an underestimation of species diversity relative to COI (Tang et al., 2012). Contrariwise, some of these limitations are not present in mitochondrial genome (Figure 2).
Figure 2 Map of the human mitochondrial genome (16 569 bp). The black circle highlights the COI gene. Taanman,
1999.
The COI gene lack of introns, has limited exposure to recombination and has haploid mode of inheritance (Hebert et al., 2003a). The 648 bp length of COI are short enough to be sequenced quickly and cheaply and are able to identify at species-level. Also, considering that amino acid sequence changes occur more slowly in COI, this gene marker is more likely to provide deeper
phylogenetic insights than alternatives (e.g. cytochrome b) (Hebert et al., 2003a). Due to the
evolution of mitochondrial gene, COI are able to discriminate closely allied species and phylogeographic groups within a single species (Cox and Hebert, 2001). A study using Tetrahymena thermophila species (ciliate species) demonstrated that species can be identified based on COI gene, revealing high degree of precision (Lynn and Strüder-Kypke, 2006). Hajibabaei and collaborators (2012) used HTS metabarcoding approach to access biodiversity of benthic macroinvertebrate community. HTS approach demonstrated to be effective in environmental studies, increasing the potential of using DNA information (Hajibabaei et al., 2012). In other study,
HTS metabarcoding approach was applied to test the efficacy of COI-pyrosequencing in the detection of arthropods and microbiome from a bulk sample. The authors confirmed that this approach provides biodiversity assessment and environmental monitoring (Gibson et al., 2014). The associated databases to COI gene region have boasts millions of taxonomically verified DNA sequences, which not verified with 18S gene region. Because DNA metabarcoding taxonomic identification is performed by sequence-based identification, the existence of a standard reference library of known organisms is the most important requirement to biodiversity assessment (Aylagas et al., 2014). Therefore, nuclear genome has limitations when compared to mitochondrial genome and as a result the standard mitochondrial DNA barcode region are effective for species identification.
Efficient PCR primers of broad taxonomic scope are fundamental in DNA barcoding research to allow amplification of the same locus across a wide range of taxa from different phyla, with the same efficiency (Lobo et al., 2013). Finding a unique suitable metabarcode within a short variable DNA region to target multiple species on an environmental sample, flanked by two highly conserved regions, (about 20 bp) is a difficult task (Taberlet et al., 2012). A large number of primers have been design for COI amplification from various animal groups. Folmer and colleagues (1994) designed the first “universal” primers, called LCO1490 and HCO2198 (“Folmer primers”), to amplify 658 bp fragments of the COI gene in a broad range of marine metazoan phyla. However, these primers often fail or perform poorly for many taxa (Blankenship et al., 2005; Lohman et al., 2009). The limited amplification success of Folmer primers are possibly related to mismatches occurring in the target annealing position, this led some authors to develop new primers with some level of degeneracy, this is created during primer synthesis by mixing nucleotides at the variable sites, thereby creating a pool of primers containing all variants (Geller et al., 2013; Leray et al.,
2013; Lobo et al., 2013). In 2013, Geller and colleagues redesigned “Folmer” primers using
degenerate positions and internal inosines. The use of inosines is useful because it can pair with any natural base (adenine, thymine or cytosine), without disrupt the primer’s annealing efficiency. The new jgLCO1490 and jgHCO2198 (658 bp) primers showed to be broadly applicable and complement the standard Folmer primers in DNA barcoding applications. Lobo and collaborators (2013) designed new enhanced primers, LoboF and LoboR (658 bp), for COI-5P barcode region to overcome the limitations of Folmer primers, especially in marine invertebrates identification. The
16
and cost-effective (Lobo et al., 2013). The forward primer mlCOIintF were designed within the COI region by Leray and collaborators (2013). In a study using coral reef fish gut contents, they combined mlCOIintF with jgHCO2198 (313 bp) and reported a higher success than using Folmer
primers (Leray et al., 2013). Recently, Gibson and colleagues (2014) used HTS and multiple
primers sets primers, including the combination ArF2 and ArR5 used in this study to maximize recovery of the arthropod macrobiome and the bacterial and other microbial microbiome of a bulk arthropod sample.
Another limitation to the use of the full length of barcode region is their application on the recovery of museum specimens, since the DNA is often degraded. Short sequences (≈100 bp) can regularly be obtained from old specimens and a new approach based on “mini-barcodes” was developed to identify unknown specimens (e.g. Fishes and Lepidoptera in Hajibabaei et al., 2006) (Meusnier et al., 2008). However, mini-barcode primers demonstrated a limited efficiency for DNA amplification from some taxa (Arif et al., 2011).
PCR amplification can introduce some sources of PCR bias, such as chimeric sequences formation. However, in metabarcoding, amplification failures of a particular taxa are not subject to optimization. These occurs because specimens that initially failed in amplification are masked by the detection of amplicons from other taxa present in the sample. Reference library preparation, detection of the incorporated nucleotides and utilization of primer cocktails can minimize these
effects and increase amplification success rates (Shokralla et al., 2012). Therefore, primers
designed for COI DNA barcode region has proved to be very robust, allowing routine detection of species segments of COI, and enabling amplification of most animal phyla (Stoeckle, 2003).
Biomonitoring programs, through the employment of biotic surveys, are essential to assess information about species composition, biodiversity changes and ecosystem status and trends
(Hajibabaei et al., 2011). Benthic macroinvertebrates communities are routinely used as
bioindicators to detect environmental disturbances in aquatic ecosystems. These communities display some of the highest diversity on Earth, yet there is a well-knowledge gap in understanding of their global biodiversity. Only 1% of their biodiversity are estimated to be known (Fonseca et al., 2010). Furthermore, due to the broad taxonomic diversity and a lack of consistently approaches (e.g. efficient primers), macrobenthic communities have been hard to identify (Lobo et al., 2013). Also, these communities contain development stages (e.g. eggs), cryptic species and associated
gut contents which difficult species identification (Leray et al., 2013). The bioassessment of macrobenthic fauna can be improved by novel approaches that significantly speed-up benthic macroinvertebrate monitoring, which is traditionally time-consuming undertaking (Baird and Sweeney, 2011). This is especially important under the European Union’s Water Framework Directive (WFD). The WFD was developed to implement an aquatic ecosystem-monitoring network, which commits European Union member states to achieve good qualitative and quantitative status of all water bodies by 2015. A classification for ecologic status (high, good, moderate, poor and bad) in order to define the ecologic and chemical status of aquatic bodies (Costa and Antunes, 2012).
1.3 Aim of the thesis
The main objective of the present work was to prime the development of a DNA metabarcoding methodology for routine species identification and inventory in marine macrobenthic communities, with particular focus on estuaries and coastal areas. In order to attain this objective, the partial goals and associated tasks were:
To compile a reference library of cytochrome oxidase I DNA barcodes of estuarine and
coastal marine invertebrates from Portugal to be used as a central framework for sequenced-based species identification through metabarcoding approaches. The reference library shall include dominant member of the three main marine phyla represented in macrobenthic communities, namely Annelida, Crustacea and Mollusca.
To evaluate the effect of the amplicon size, and location within the COI-5P barcode region,
on the sequenced-based species discrimination ability. For this purpose we carried out a structured in silico analysis based on the sequential pruning of the reference library in multiple fragments of different size. This in silico analysis was required because the metabarcoding approach typically uses shorter sequences than the full COI-5P barcode region.
To investigate the ability of different primer sets to amplify, and therefore enable
detection, of the diversity of species present in a macrobenthic assemblage of known species composition and abundance, through the use of experimentally assembled communities.
18
Hollatz executed the laboratory experiments here reported with the assistance of J. Lobo in primer design and preliminary tests. High-throughput sequencing (HTS) was carried out in Genoinseq, UC-Biotech (BioCant Park, Cantanhede, Portugal), under the supervision and support of Dr. C. Egas, together with Dr. H. Froufe in the upstream data treatment and analyses of HTS reads. The sequence data used in the reference library were compiled from published, submitted and unpublished projects led by the Molecular Ecology and Biodiversity group of CBMA, at University of Minho (Antunes et al., 2015; Borges et al., submitted; Gomes, 2014; Lobo et al., 2013; Lobo et al., 2015; Lobo et al., unpublished). The thesis author, B. Leite, executed all the downstream data analyses and annotation, data interpretation and discussion.
This master’s thesis is divided into 5 sections. Firstly, one proceeds to the historical context of the study through a general introduction of the topic of DNA metabarcoding. This also includes the objectives and the thesis structure. Secondly, there is an inventory of the materials and methods that were used for all experimental procedures. Lastly the results are presented, being followed by the discussion and the conclusion.
2. M
ATERIALS AND
M
ETHODS
2.1 Overview of the global approach and experimental design
The global experimental approach followed in this study is composed of three main stages. The first stage encompasses the reference library compilation of COI-5P DNA barcodes of marine invertebrates from mainland Portugal and Azores Islands, for sequenced-based species identification. The second stage comprises the evaluation of the amplicon size and location (within the COI-5P barcode), on the sequence-based species discrimination ability. Once defined the discrimination degree for different amplicons, the third stage is to test the species detection success in experimentally assembled macrobenthic communities whose COI-5P barcodes were amplified using 5 different sets of primer pairs. Two different simulated macrobenthic communities (SimCom) with known species composition were created, comprising a same number of species
but a different number of specimens per species. Figure 3 provides an overview of the global
approach and experimental design here followed.
Figure 3 Schematic representation of the experimental design used in this study for testing the application of the
metabarcoding approach to species identification in macrobenthic communities. SimCom1 – Simulated Community 1; SimCom2 – Simulated Community 2.
20
2.2 Preparation of the simulated macrobenthic communities
Specimens used for assembling the simulated macrobenthic communities were selected from the Molecular Ecology and Biodiversity research group collection. A total of 21 species were selected, in order to embrace the widest possible phylogenetic diversity within the three major phyla typically present in macrobenthic communities. The distribution of species per phyla was respectively 4.8% Annelida, 33.3% Arthropoda, and 61.9% Mollusca. Annelida was less represented due to the lack of available specimens in the collection at the time the study was being conducted.
Two simulated communities were assembled for DNA extraction, each community
containing different number of specimens per species (88 specimens in total). SimCom1 hadone
specimen of each species, while SimCom2 had one to five specimens of each species (Table 2). This approach aimed to test whether the relative abundance in the mixture affect the amplification success by the different primer sets.
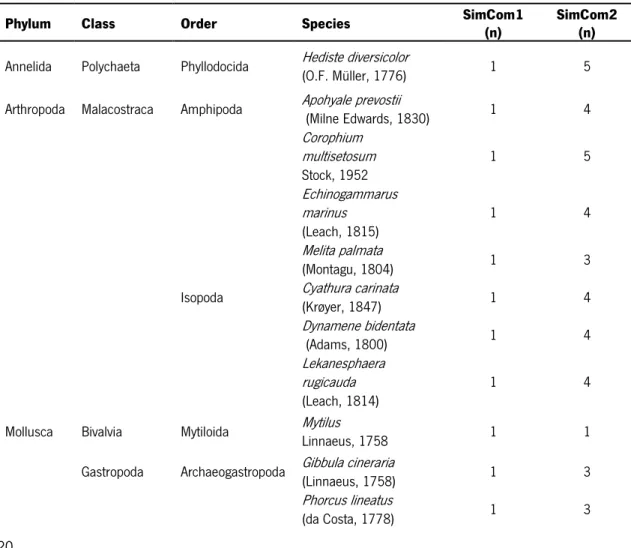
Table 2 Taxonomic classification and distribution of the 21 marine macrobenthic species among the two different
simulated macrobenthic communities. SimCom1 – Simulated Community 1; SimCom2 – Simulated Community 2; n – number of specimens per species.
Phylum Class Order Species SimCom1 (n) SimCom2 (n)
Annelida Polychaeta Phyllodocida Hediste diversicolor(O.F. Müller, 1776) 1 5
Arthropoda Malacostraca Amphipoda Apohyale prevostii (Milne Edwards, 1830) 1 4
Corophium multisetosum Stock, 1952 1 5 Echinogammarus marinus (Leach, 1815) 1 4 Melita palmata (Montagu, 1804) 1 3
Isopoda Cyathura carinata(Krøyer, 1847) 1 4
Dynamene bidentata (Adams, 1800) 1 4 Lekanesphaera rugicauda (Leach, 1814) 1 4
Mollusca Bivalvia Mytiloida Mytilus
Linnaeus, 1758 1 1
Gastropoda Archaeogastropoda Gibbula cineraria(Linnaeus, 1758) 1 3
Phorcus lineatus
Docoglossa Patella asperaRöding, 1798 1 2
Patella vulgata
Linnaeus, 1758 1 2
Littorinimorpha Alvania mediolittoralis
Gofas, 1989 1 4
Neogastropoda Nassarius incrassatus(Strøm, 1768) 1 2
Nassarius reticulatus (Linnaeus, 1758) 1 3 Nucella lapillus (Linnaeus, 1758) 1 3 Ocinebrina edwardsii (Payraudeau, 1826) 1 3
Pulmonata Siphonaria pectinata(Linnaeus, 1758) 1 2
Polyplacophora Chitonida Acanthochitona crinita(Pennant, 1777) 1 2
Lepidochitona cinerea
(Linnaeus, 1767) 1 4
2.3 DNA extraction
The pooled specimens of each of the two simulated macrobenthic communities were homogenized separately in a grinder and the resultant slurry was incubated at 56 °C to evaporate residual ethanol, for minimum period of two hours. The dried mixture of each homogenized simulated community was divided into 10 microtubes of 1.5 mL (about 300 mg) and the total DNA was extracted using E.Z.N.A. Mollusk DNA Kit (Omega Bio-tek), following manufacturer’s instructions. After extractions, aliquots of DNA were pooled in a single microtube of 1.5 mL, representing each simulated community (500 µL total volume).
2.4 PCR amplification of the full and partial fragments of the COI-5P
barcode
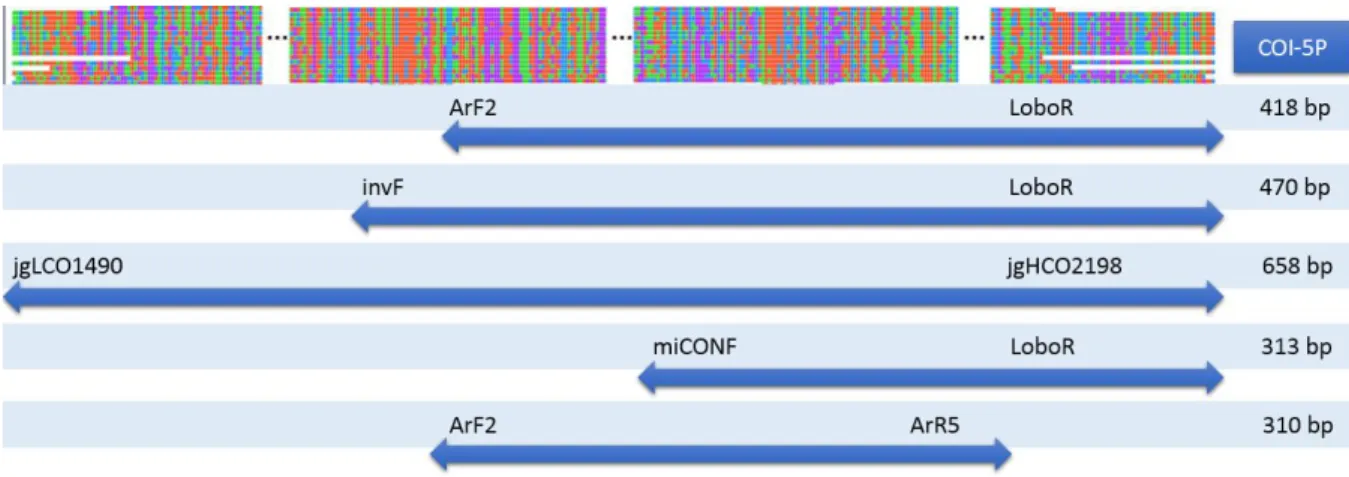
A preliminary assessment of the amplification success of a series primer pairs, including the newly designed by J. Lobo and other already published, was conducted using individual test specimens. Based on the results, five primer pair combinations, which amplify different fragments within COI barcode region, were selected for the metabarcoding tests (Table 3 A; Figure 4). The first PCR used the COI specific primers and the second PCR involved 454 fusion-tailed primers,
22
step, each PCR reactions contained 2.23 µL DNA template, 32.77 µL molecular biology grade water, 5 µL 10x Advantage Buffer SA, 2 µL dNTPs (5 mM), 2 µL forward primer (5 mM), 2 µL reverse primer (5 mM), 3 µL DMSO (6%) and 1 µL 50x Advantage2 Taq polymerase mix. The PCR thermal cycling conditions for each primer pair are displayed in Table 3 B.
Table 3 A - Primers used for PCR amplification of fragments of COI-5P gene from the two different simulated
communities and B - PCR primer combinations and respective thermal cycling conditions for the five primer pairs.
A
Primer name Sequence (5’ 3’) Reference
ArF2 GCICCIGAYATRGCITTYCCICG Gibson et al., 2014
invF ATRATYTTYTTYITIGTIATRCC Lobo J, this study
jgLCO1490 TITCIACIAAYCAYAARGAYATTGG Geller et al., 2013
mlCOIintF GGWACWGGWTGAACWGTWTAYCCYCC Leray et al., 2013
LoboR TAAAACYTCWGGRTGWCCRAARAAYCA Lobo et al., 2013
jgHCO2198 TAIACYTCIGGRTGICCRAARAAYCA Geller et al., 2013
ArR5 GTRATIGCICCIGCIARIACIGG Gibson et al., 2014
B
Primer combinations PCR conditions
ArF2/LoboR 94 °C 5’ 94 °C 30’’ | 46 °C 1’ | 68 °C 1’ 15x 68 °C 10’ | 4°C ∞ invF/LoboR 94 °C 5’ 94 °C 30’’ | 45 °C 90’’ | 68 °C 1’ 5x 94 °C 30’’ | 50 °C 90’’ | 68°C 1’ 40x 68 °C 10’ | 4°C ∞ jgLCO1490/ jgHCO2198 94 °C 5’ 94 °C 30’’ | 48 °C 30’’ | 68 °C 1’ 30x 68 °C 10’ | 4°C ∞ mlCOIintF/LoboR 94 °C 5’ 94 °C 30’’ | 62 °C (-1 per cycle) 30’’ | 68 °C 1’ 6x | 94 °C 30’’ | 46 °C 30’’ | 68°C 1’ 25x 68 °C 10’ | 4°C ∞ ArF2/ArR5 94 °C 5’ 94 °C 30’’ | 46 °C 1’ | 68 °C 1’ 15x 68 °C 10’ | 4°C ∞
Figure 4 Schematic representation of the amplicons and their size, generated after PCR amplification. The COI-5P
barcode and the five primer pairs that were used in PCR amplification within the standard barcode are represented.
The purified amplicons from the first PCR were used as templates in a second PCR with the same amplification condition used in the first PCR with the exception of using 454 fusion-tailed primers in a 30-cycle amplification regime. A negative control reaction (no DNA template) was included in all experiments. PCR success was checked by agarose gel electrophoresis.
2.5 High-throughput 454-pyrosequencing protocol
The amplicons were quantified by fluorimetry with PicoGreen (Invitrogen, CA, USA) and pooled at equimolar concentration. The two simulated communities were sequenced in the A direction with GS 454 FLX Titanium chemistry, following the amplicon sequencing protocol provided by the supplier (Roche, 454 Life Sciences, Branford, CT, USA) at Biocant (Cantanhede, Portugal).
The DNA was fractionated and subsequently bound to beads in a 1:1 proportion to ensure only one fragment per bead. Each segment was amplified in microreactors formed by emulsion PCR. The beads with DNA were distributed over an optical fiber plate and then the sequencing occurs by synthesis (sequencing of a DNA single strand and then synthesizing its complementary strands enzymatically).
24
2.6 Data processing and analyses
2.6.1 Reference library compilationA reference DNA (COI-5P) barcode library of estuarine and coastal marine invertebrates from Portugal was compiled for taxonomic identification of pyrosequencing reads generated in both simulated communities. The reference library comprises 315 barcode sequences of 300 taxa (species or genus), retrieved from private and public projects of the Molecular Ecology and Biodiversity Research Group (Antunes et al., 2015; Borges et al., submitted; Gomes, 2014; Lobo et al., 2013; Lobo et al., 2015; Lobo et al., unpublished data) and comprising taxa from the three main marine phyla (Annelida, Arthropoda, Mollusca). Species are represented from one to four sequences, which were selected among the longest and of highest quality (absence of ambiguous bases) available and sequences displaying intraspecific distance above 2%. The sequences were aligned using the ClustalW method (Thompson et al., 1994) implemented in the program MEGA v.6.0 (Tamura et al., 2013). All sequences were checked for the presence of indels, stop codons or unusual aminoacid patterns.
2.6.2 In silico evaluation of the discriminatory capacity of COI-5P fragments
Two in silico tests were carried out in order to evaluate the performance of different COI fragment sizes on the species-level discrimination capacity. First, the full length of the barcode region was divided into multiple fragments starting on 158 pb of the 5’ end, with 100 bp increments until 558 bp and then 658 bp. Second, all sequences of the reference library were clipped with the five primers pairs used in this study, with amplicon sizes of 310, 313, 418, 470 and 658 bp.
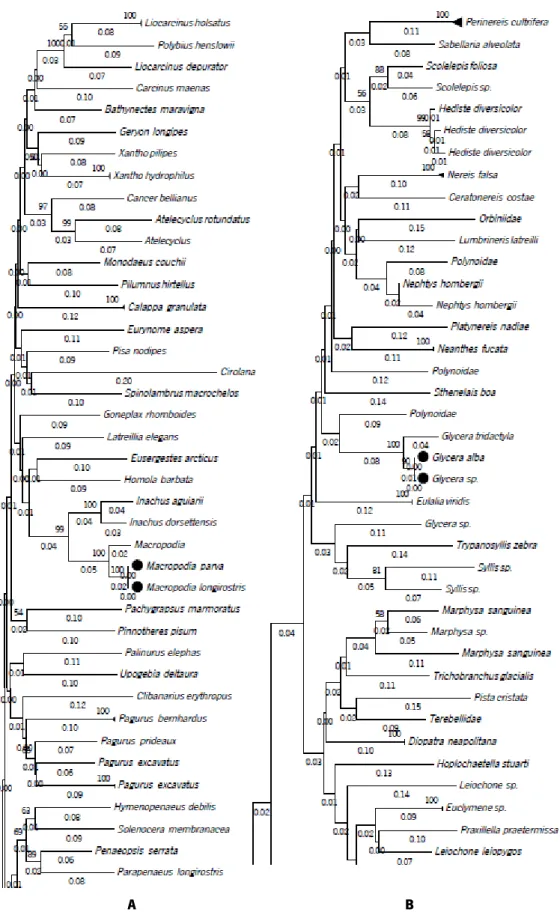
The Neighbor Joining (NJ) method was used to constructed phenograms (Saitou and Nei, 1987) in the program MEGA v.6.0, using the Kimura 2-parameter (K2P) substitution model (Kimura, 1980), the most used for analysis of DNA barcodes. Node support was assessed through 1000 bootstrap replicates. This provided a graphic representation of the divergence patterns among species allowing the visual inspection of clusters to determine the percentage of monophyletic clades. The monophyletic clades were evaluated in two different phases: (1) percentage of monophyletic clades with internal divergence higher than 3%; (2) percentage of
different species that were grouped in the same clade, in which case the genetic distance among species was verified using the, p-distance metric, calculated using MEGA v.6.0 program.
2.6.3 High-throughput data processing
The pyrosequencing reads (fasta files) were processed using an automated pipeline implemented at Genoinseq (Nex Gen Sequencing Unit, BioCant Park, Cantanhede, Portugal). The sequencing reads were assigned to the appropriate sample libraries (separately by primer and SimCom tested) based on the respective sequencing tags. To minimize the effects of random sequencing errors the sequencing reads were initially checked for quality and filtered (elimination of the sequence reads with less than 150 bp and the sequences that contained more than two undetermined nucleotides). Still at BioCant, the filtered reads obtained for each community were aligned against a reference library using the Usearch 6.1 software (Edgar, 2010). Finally sequence similarity searches at 97% minimum identity were performed against the reference library to assign a primary taxonomic identification.
In order to possibly identify new taxa that had no representation in the reference library, a new similarity search was conducted for all sequences that displayed similarities against the reference library below 97% and above 70%. We used BOLD Identification System (IDS) and GenBank’s BLASTn for this purpose. The BOLD-IDS for COI accepts sequences from the 5' region of the mitochondrial cytochrome c oxidase subunit I gene and returns a species-level identification
when one is possible (Ratnasingham and Hebert, 2007). GenBank®
(http://www.ncbi.nlm.nih.gov) is a comprehensive database that contains publicly available nucleotide sequences for formally described species (Benson et al., 2013). GenBank data retrieval is possible, for example, through the use of “The Basic Local Alignment Search Tool (BLAST)”, which finds regions of local similarity between sequences. The program compares nucleotide (BLASTn) or protein sequences (BLASTp) to sequence databases and calculates the statistical significance of matches (Altschul et al., 1990). Only matches > 97% similarity were considered for taxon identification in this analysis.
3. R
ESULTS
3.1
In silico
analysis of the impact of fragment size on species
discrimination ability
The reference library encompasses 315 sequences of marine and estuarine macrobenthic specimens, representing 266 taxa. The distribution of barcode sequences across the three main marine phyla, were: Annelida (19.68%), Arthropoda (60.32%) and Mollusca (16.51%). Other phyla with minor representations (< 4%) in the library were: Chordata (1.90%), Cnidaria (0.32%), Echinodermata (0.95%) and Nermetea (0.32%) (Figure 5 A).
The vast majority of the COI-5P barcodes included in the reference library were identified to species (266) but some were only to genus (34) or family (15) level only (Figure 5 B).
Cnidari a Nerm etea Echinoderma ta Chordat a Mollus ca Annel ida Arthrop oda 0 20 40 60 80 100 Ph yla p re se nt s in re fe en ce li br ar y (% ) Annel ida Arthrop oda Chordat a Cnidari a Echinoderma ta Mollus ca Nerm etea 0 25 50 75 100 125 150 Family Genus Species N um be r o f t ax on n am es pr es en ts in re fe re nc e lib ra ry (n )
Figure 5 Number of specimens per phyla (A) and number of taxon names present in COI-5P reference library for
seven representative phyla (B).
The NJ tree showed that regarding the fragment size, almost all species in the reference library were separated similarly in distinct clusters. Although minor shifts on the clade distances were noted among the different amplicons, as illustrated by Figure 6.
It is important to note that some species that were not previously resolved using the full COI-5P barcode region kept the same clustering pattern when compared to the other amplicons. In the full COI-5P barcode region 1.13% of the 266 total species were not distinguished, grouped in the